Impact of Incremental Increases in Cognitive Workload on Physiological Arousal and Performance in Young Adult Drivers Bruce Mehler, Bryan Reimer, Joseph F. Coughlin, and Jeffery A. Dusek such situations, physiological measures may show increased activation before the appearance of significant performance decrements. Although this position seems intuitively reasonable, to the best of the authors’ knowledge, published data documenting this relationship in the driving literature is relatively sparse. If a temporal relationship does exist whereby shifts in physiological arousal indicate changes in mental workload before driving performance is impaired, knowledge of such a relationship may be useful in the development of advanced safety systems. Basic cardiovascular measures (heart rate and blood pressure) have been shown to increase with escalating cognitive demand or workload in a range of environments (3, 4, 6–9); the most extensive work has been carried out in aviation (1, 3, 8–9). As a representative example from driving simulation, Brookhuis and De Waard (1) reported that heart rate increased with heightened task demand, such as entering a traffic circle, and dropped as task demands decreased, for instance, driving on a two-lane highway. In an on-road driving assessment, Brookhuis et al. (10) found that heart rate increased during the dualtask load of driving while having a telephone conversation. Lenneman et al. (4) measured several cardiovascular parameters during four conditions: baseline, during single-task driving, while subjects drove and engaged in a mildly challenging working memory task, and while engaged in a harder version of the same working memory task. They found that heart rate increased incrementally as the conditions became more mentally challenging. Although these studies suggest that heart rate may be a useful index of mental workload in driving research, the overall pattern of findings and the relationship to driving performance remain unclear. For example, while Lenneman et al. (4) were able to show that heart rate increased with workload, driving performance in the simulation did not degrade with increasing demand. Summarizing the results of studies from the HASTE project, Engström et al. (11) reported on the impact of visual and secondary cognitive tasks on performance and physiology in both simulated and on-road driving. In the simulator, they found that skin conductance increased during visual-based dual tasks, but there were no effects for heart period (inverse of heart rate) or heart rate variability. In the case of an auditory dual task, no significant effects were found in the simulator for any of these physiological measures. During on-road driving, only heart rate showed a significant increase with the dual-task load. Presently, a definitive relationship between changes in standard physiological parameters and workload has not been established in the driving literature. The authors previously examined the impact of four different simulated driving environments and four secondary tasks on heart rate as an index of workload (12). Heart rate generally increased with apparent task difficulty, but an objective ranking of conditions on workload
This study examined the sensitivity of heart rate, skin conductance, and respiration rate as measures of mental workload in a simulated driving environment. Workload was systematically manipulated by using increasingly difficult levels of a secondary cognitive task. In a sample of 121 young adults, heart rate increased incrementally with increasing task demand. Significant elevations in skin conductance and respiration rate were also observed. At the lower levels of added workload, secondary task performance was nearly perfect and changes in indices of driving performance were negligible. At the highest level of workload, all three physiological measures appeared to plateau, and a subtle drop in simulated driving performance became detectable. Taken together, the pattern of results indicates that physiological measures can be sensitive to changes in workload before the appearance of clear decrements in driving performance. These findings further highlight a role for physiological monitoring as a means to measure mental workload in product design and functionality research. They also support work exploring the potential for incorporating physiological measures of driver workload and attentional state in future safety systems.
The ability to measure driver workload is relevant in the study of automotive safety as well as in the design and evaluation of control, informational, and entertainment devices that are functional and user-friendly. Workload can be measured in a variety of ways, including performance-based measures, self-report, behavioral observation, and by physiological measures (1, 2). Each of these methods offers certain advantages and disadvantages. A well-rounded assessment will make use of as complete an array of inputs as is practical (3). In dynamically changing conditions such as driving an automobile, performance and physiological measures offer the advantage of being both objective and relatively continuous in nature. In some situations physiological indices may be more sensitive than performance-based measures for detecting initial changes in mental workload (3–5). This position suggests that individuals who are motivated to maintain a given level of performance will continue to invest mental resources in response to increasing demand up until the point at which their reserve of available resources is exhausted. In B. Mehler, B. Reimer, and J. F. Coughlin, New England University Transportation Center, AgeLab, Massachusetts Institute of Technology, 77 Massachusetts Avenue, E40-279, Cambridge, MA 02139. J. A. Dusek, Institute for Health and Healing, Abbott Northwestern Hospital, 800 East 28th Street, Minneapolis, MN 554073709. Corresponding author: B. Mehler,
[email protected]. Transportation Research Record: Journal of the Transportation Research Board, No. 2138, Transportation Research Board of the National Academies, Washington, D.C., 2009, pp. 6–12. DOI: 10.3141/2138-02
6
Mehler, Reimer, Coughlin, and Dusek
was not possible due to the mixed environment and task design. There was an association between age and the magnitude and character of heart rate responses, with younger drivers exhibiting greater heart rate reactivity. To more fully examine the sensitivity of physiological measures as indices of mental workload in the context of driving, the following study was conducted with several key design features in mind. Since there are situations in which heart rate may actually decrease during otherwise arousing conditions (orienting response, sensory intake) and individuals tend to differ in which physiological parameters are most reactive (13, 14), several physiological parameters were assessed simultaneously. Heart rate and skin conductance (sweat gland activity) were selected as primary measures of interest. Respiration rate, which has been examined sparingly in the driving literature (15), was included as a promising measure on the basis of pilot testing. Monitoring forearm electromyograms was explored during pilot work, but it was found that high variability from functional steering activity tended to mask any subtle muscle tension changes that may have been present. Heart rate variability (HRV) was also considered as a measure. Although there is a lack of consensus as to the most appropriate method of quantifying HRV for various applications (3), most attention related to mental workload has focused on the 0.1-Hz frequency band. Nachreiner et al. (16) assert that decreases in the HRV 0.1-Hz band reflect increased time pressure or emotional strain. However, they argue that it should not be used as a measure of mental workload, particularly when evaluating operator tasks or interface design. Brookhuis and De Waard (1) state that HRV shows sensitivity to computational effort but not to compensatory effort, while observing that heart rate has generally been found to be sensitive to both. Consequently, heart period data were collected in a manner that would allow the examination of various HRV indices at a future date, but basic heart rate changes were examined for this study. To ensure reasonable habituation of the arousal associated with the novelty of the experimental setting, an extended period of singletask driving was provided before the introduction of additional workload. A secondary task was selected that allowed mental workload to be increased systematically in a stepwise fashion from a modest level to levels expected to adversely affect driving performance. The secondary tasks were deliberately presented in an ascending order from lowest to highest demand to observe the systematic buildup of workload arising from both objective task difficulty and sustained load. Since earlier work suggested that age may influence the characteristics of the cardiovascular response (12), it was decided to restrict the current sample to younger adults and examine the influence of age in a subsequent investigation. Finally, previous simulator and on-road investigations of physiology and workload have involved modest samples in the range of 12 to 48 subjects. Therefore, it was felt it would be a valuable contribution to obtain a sample that was large enough to minimize concerns associated with potentially underpowered studies (4).
7
(59 male). The average age for male and female participants was 24.6 and 24.4 years, respectively (standard deviation = 2.8 years for each group). All participants were required to be between 20 and 29 years old, have a valid driver’s license for over 3 years, be in good health, and speak and read English. Individuals were excluded if they had previously participated in a driving simulation study. Recruitment was conducted by using online and newspaper advertisements. The study protocol was approved by the Massachusetts Institute of Technology (MIT) institutional review board.
Apparatus The driving simulator consisted of a fixed-base, full-cab Volkswagen New Beetle situated in front of an 8- × 8-ft projection screen. Participants were provided with an approximately 40-degree view of a virtual environment at a resolution of 1024 × 768 pixels. Graphical updates to the virtual world were computed by using Systems Technology Inc. STISIM Drive and STISIM Open Module (17) based upon a driver’s interaction with the original equipment manufacturer wheel, brake, and accelerator. Additional feedback to the driver was provided through the wheel’s force feedback system and auditory cues. Each driver’s forward velocity in feet per second and lateral position in feet from the center line were sampled and stored at a resolution of 30 samples per second. The simulation scenario was designed to limit the influence of contextual changes on physiological arousal. The driving course consisted of a desert roadway composed of a mix of long straightaways, embedded curves, and an occasional small village to provide minimal stimulation and reduce monotony. The villages were all composed of a single intersection surrounded by a few small buildings. Traffic control devices were not presented in the direction of travel. Stop signs did appear in the crossing roadway, but no “cross traffic” was present. The posted speed limit throughout the simulation was 45 mph. Although oncoming cars did appear, no vehicles were presented in the drivers’ lane of travel. Physiological data were collected by using a MEDAC System/3 instrumentation unit and NeuGraph software (NeuroDyne Medical Corporation, Cambridge, Mass.). Data sampling was carried out at a rate of 250 samples per second to provide sufficient resolution for detecting the electrocardiogram (EKG) R-wave and calculating the interbeat interval. Custom software extensions (release 4.2A) were developed by NeuroDyne Medical to record time and distance values from the STISIM package to allow synchronization of the physiological and driving performance data. The software supported time-based triggering of visual and auditory stimuli and was used to present prerecorded instructions and items for the cognitive task while subjects were in the simulator. Since auditory stimulus presentation and physiological data collection were controlled by the same program, it was possible to link physiological activity to specific points in the experimental protocol.
Secondary Task METHODS Participants A total of 132 participants were enrolled. Data from 11 were excluded because of hardware failures, methodological errors, or incomplete physiological recordings. The final sample included 121 participants
An auditory prompt–verbal response “n-back” task was selected as a dual task that could be used to systematically ramp up the total task demand on a driver without requiring direct conflict with the manual control or visual processing demands of the primary driving task. This task has also been shown to be sensitive to changes in on-road driving conditions (18). The form of the n-back employed consisted of a series
8
of 10 single-digit numbers (0 to 9) presented aurally to the subject. Each value was presented once per test set, and the order of the digits varied with each presentation. The 10 numbers were presented with an interstimulus interval of 2.25 s, thus requiring a fairly rapid response from the subject to keep pace with the task. Consecutive tests appeared every 30 s, allowing for only a brief pause between sets. Each task level consisted of four test sets for a total testing period of 2 min per level. Three levels of difficulty were employed. In the 0-back version, the subject was simply to repeat out loud each number immediately after it was presented. The 0-back test is a low-level cognitive challenge that requires the driver to attend to a secondary task in addition to driving, but it is not particularly difficult and was not intended to be significantly stressful. In the 1-back condition, instead of repeating the current number, the subject was required to recall from memory and respond out loud with the number that was presented just before the current number (i.e., one back from the current number). This represents an additional step up in cognitive load in that the individual must both correctly recall from short-term memory the item presented previously as well as entering and holding the new item in memory. It was expected that the 1-back would have moderate impact on individuals. The 2-back form of the task required subjects to recall from memory and to say the number that was presented two numbers before the current value (i.e., two items back). The overall layout of the task was designed to sequentially increase the cognitive load on the subject both in terms of absolute difficulty and sustained load.
Transportation Research Record 2138
cal measurements as well as driving performance measures under single-task driving conditions. The physical demands of the driving task were consistent throughout the baseline and secondary task periods. In all, subjects were in the simulator for 27 min before the introduction of the secondary tasks. Audio instructions were presented describing the 0-back task while the subject continued to drive. A demonstration was given in the instructions, and a practice set of numbers provided before a 2-min test period of four trials (40 numbers) took place. Audio instructions for the 1-back task were then presented. The instructions, including an example of the task, were 30 s in duration and were followed by a 30-s practice set. To ensure that the task was clearly understood, the instructions were repeated, along with another example of the task, followed by another practice set. After the second practice set, the 2-min test period of four trials (40 numbers, 36 expected responses) took place. Instructions for the 2-back task followed. Thirty seconds of instructions were played, along with an example of the task, followed by a 30-s practice set. To ensure that the task was clearly understood, the instructions were repeated, along with another example of the task, followed by another practice set. The basic instructions with example and a third practice set were then presented, for a total of 3 min of instructions and practice. After the third practice set, the 2-min test period of four trials (40 numbers, 32 expected responses) took place. The procedure of presenting additional examples and practice sets for the 1-back and 2-back was developed over a series of pilot tests to ensure that all participants understood the more challenging forms of the n-back.
Procedure Motivational Considerations Upon arrival, participants were asked to review and sign a participation consent form. Physiological sensors were then attached. To minimize invasiveness, a wrist-to-wrist configuration with the ground (reference) placed on the back of the neck was used for EKG recording. Compared to a more traditional leg placement, the placement of the ground on the back of the neck offered advantages in the routing of lead wires on the driver while having minimal impact on the magnitude of the EKG R-wave. The skin was cleaned with isopropyl alcohol, and standard pregelled silver–silver chloride disposable electrodes (Vermed A10005, 7% chloride wet gel) were applied. Skin conductance level (SCL) was measured with a constant current configuration and nonpolarizing, low-impedance gold-plated electrodes that allowed electrodermal recording without the use of conductive gel. Sensors were placed on the underside of the outer flange of the middle fingers of the nondominant hand. Respiration was monitored by using an expandable belt that produced a varying resistance value with chest expansion and contraction. Subjects then entered the simulator and listened to recorded audio instructions describing the simulator and the simulation. An introductory training period during which the subject drove for 8 min was intended to allow the subject to become familiar with and adapt to driving the car while also being attached to the physiological monitoring sensors. The subject was then asked to sit quietly in the simulator for another 5 min before being presented with audio instructions covering the next active driving phase of the experiment. The 5-min rest period allowed the subject to further recover or adapt to the research conditions. After the instructions to resume driving, the subject drove for 10 min without any further prompts or external stimulation beyond the driving simulation. This phase was intended to provide further habituation and a reference period for physiologi-
To enhance the demands of driving during the simulation, a financial incentive was designed to “encourage people to maintain speed, obey the traffic laws, and devote attention to secondary cognitive tasks” (19, p. 318). During the initial briefing subjects were told that in addition to the base compensation of $20, an additional $10 could be earned during the drive by performing a series of secondary tasks. In order to simulate the conflicting demands of real automobile driving, subjects were instructed that some of the incentive could be lost for unsafe driving events, such as a crash or traveling too fast or too slow in relation to the posted limit. In actuality, all subjects received the bonus payment regardless of performance.
Data Analysis Physiological activity (heart rate, skin conductance level, and respiration rate) and driving performance data (mean velocity, standard deviation of velocity, and standard deviation of lane position) were extracted from four 2-min intervals. The first interval, ending 30 s before the start of the secondary task, served as a baseline for the 2-min testing intervals during each of the three levels of the n-back task. Respiration data for 10 of the 121 subjects were dropped from the analysis because of movement artifact that precluded accurate quantification in one or more of the selected analysis periods. Recorded audio was used to assess participant’s accuracy for each of the scored secondary tasks. Comparisons were computed with SPSS 11.5 (20) by using a repeated measures general linear model procedure. Pairwise t-tests were computed for significant results with a least significant differ-
Mehler, Reimer, Coughlin, and Dusek
9
ence adjustment for multiple comparisons. No adjustments were made for missing data. Significant results are reported when p < .05 or lower.
14
% Errors
12
RESULTS
10 8 6 4 2
Secondary Task Performance
0
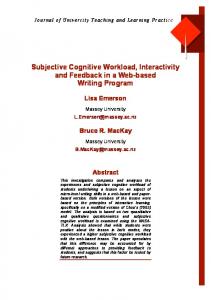
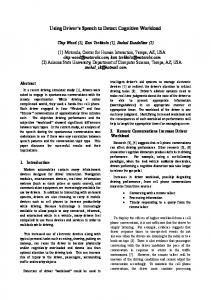
Although a few participants failed to respond verbally to one or more of the individual n-back task sets (four per difficulty level), the overall completion rate was greater than 98%. Four individuals did not respond to one or more of the 0-back trials, while all participants completed at least one set for both the 1-back and 2-back (Table 1). Using the error rate for all tests undertaken by the participants as an index, performance was essentially perfect (0.02%) across subjects for the 0-back (Figure 1). As the level of cognitive challenge increased, error rates appeared of 2.3% for the 1-back and 12% for the 2-back. The effect of task difficulty on error rate was significant across all three levels of the n-back task [F(2, 238) = 65.7, p < .001]. The observed error rates support the assertion that workload increased across the task periods.
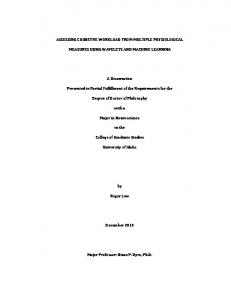
Physiological Response A significant main effect of task level appears across all three physiological measures: heart rate [F(3, 360) = 116, p < .001], skin conductance level [F(3, 360) = 37, p < .001], and respiration rate [F(3, 330) = 59, p < .001]. Table 2 depicts the average physiological response across the three measures. Heart rate increased markedly by 3.1 beats per minute and then by an additional 4.8 beats per minute during the first two secondary load states (0-back and 1-back), respectively. Heart rate increased by a modest 1.1 additional beats per minute during the 2-back. Overall, heart rate increased an average 8.9 beats per minute from the end of the driving baseline through the 2-back task (Figure 2). Peak heart rate at the start of each task level was significantly higher; the values presented here represent relatively conservative mean values for each 2-min period. Pairwise comparisons of the incremental increases in heart rate were significant for each period at the p < .005 level. The incremental increases in skin conductance and respiration rate were also significant ( p < .005) from baseline to the 0-back and from the 0-back to the 1-back. During these two intervals, skin conductance increased by 2.4 and 1.4 micromhos, respectively, while respiration rate increased by 2.8 and 0.7 breaths per minute, respectively. The additional increases in skin conductance (0.02 micromhos) and respiration rate (0.22 breaths per minute) between the 1-back and 2-back were minimal and not statistically significant. The near flattening of the response curve for all physiological measures during the 1-back
0-back FIGURE 1 difficulty.
0-back 1-back 2-back
Two
1
2 1
2
Three
1 1
Four
Total
1
4 2 3
NOTE: Entries represent the number of participants in each cell.
n-back errors as function of task
Driving Performance Driving performance data are summarized in Table 3. In contrast to the substantive changes in the physiological measures, the magnitude of statistical differentiation in the driving performance measures as a function of task level was modest. The difference between adjacent levels was either nonsignificant or in a seemingly counterintuitive direction for the first two step changes, as described below. Overall, a significant main effect appears across the four levels of the task for mean velocity [F(3, 357) = 3.1, p < .05], standard deviation of velocity [F(3, 357) = 13.0, p < .001], and standard deviation of lane position [F(3, 357) = 34.9, p < .001]. Although significant main effects appear across the different levels of each measure of driving performance, the mean differences are minimal and might be considered inconsequential if assessed in isolation in an evaluation of the impact of task engagement on safety. Pairwise comparisons show a statistically nonsignificant trend (pairwise p > .05) for velocity to drop slightly from baseline to the 0-back and again from the 0-back to the 1-back task. The primary effect is in a 1-ft/s increase from the 1-back to the 2-back condition. The standard deviation of velocity was the only performance measure that showed a consistent shift in the direction of a performance decrement across the periods (i.e., increased variability with increasing task load). However, the increases in standard deviation of velocity from baseline to the 0-back and from the 0-back to the 1-back were not statistically significant (pairwise p > .05), and only the change from the 1-back to the 2-back reached this criterion.
Number of Nonresponse Trials One
2-back
and 2-back tasks may indicate that a threshold had been reached relative to the amount of additional effort that participants were willing or able to invest in the combined demands of driving and the secondary cognitive task (Figure 2).
TABLE 2 TABLE 1
1-back
Baseline 0-back 1-back 2-back
Summary of Physiological Response Measures Heart Rate (beats/min)
Skin Conductance (micromhos)
Respiration Rate (breaths/min)
70.5 (10.4) 73.6 (10.9) 78.3 (12.4) 79.4 (13.5)
19.6 (18.4) 22.0 (19.7) 23.4 (21.2) 23.4 (21.5)
16.7 (3.4) 19.5 (3.9) 20.2 (3.7) 20.4 (3.6)
NOTE: Table entries are means with the standard deviation in parentheses.
Transportation Research Record 2138
82 80 Heart Rate
78 76 74
Heart Rate
72
Respiration Rate Skin Conductance
70 68
24 23 22 21 20 19 18 17 16 15 14
SCL & Resp. Rate
10
Baseline 0-back 1-back 2-back Task Level (2 minute periods) FIGURE 2 Mean physiological activity as function of task level (2-min periods).
Lateral control showed a slight but statistically significant drop in variability from baseline through the 0-back and 1-back. However, during the 2-back, lateral control appears to recover to a level near that of the 1-back. By traditional interpretation, these values indicate little change or even a slight improvement (decreased variability) in driving performance. In actuality, they most likely reflect compensatory responses by the drivers to exert a more rigid control over driving performance while attentional resources are shifted to the secondary task. With the introduction of the 2-back task, all three of the driving performance measures showed a slight shift in the direction of decreased control or safety (i.e., increased velocity, standard deviation of velocity, and lane position).
DISCUSSION OF RESULTS In this simulation study with young adult drivers, average heart rate increased in a stepwise manner from single-task driving through three increasingly demanding levels of an auditory cognitive task. Skin conductance and respiration rate both followed a similar pattern of increased physiological activation from single-task driving through the first two levels of the secondary cognitive task and then reached a plateau without further significant increases between the 1-back and 2-back task. It is worth emphasizing that the first incremental increase in workload, the 0-back task, represents a modest demand on the driver. Subjects merely had to repeat each single-digit number immediately after it was presented, and the error rate was essentially 0%. The 0-back task might appear to demand relatively little cognitive effort, but the task produced an elevation in heart rate of
TABLE 3
Baseline 0-back 1-back 2-back
Summary of Driving Performance Measures Average Velocity (ft/s)
Standard Deviation of Velocity (ft/s)
Standard Deviation of Lane Position (ft)
68.76 (5.84) 68.49 (5.01) 68.09 (6.33) 69.04 (5.96)
1.93 (1.15) 2.13 (1.65) 2.41 (1.89) 2.88 (1.90)
0.72 (0.23) 0.62 (0.19) 0.53 (0.17) 0.60 (0.21)
NOTE: Table entries are means with the standard deviation in parentheses.
approximately 35% of the total change seen over the course of the three dual-task conditions. More dramatically, skin conductance increased by 63% of the total change evident over the three tasks, and respiration rate increased by 75%. This finding is in line with the position (4) that heart rate can be sensitive to changes in workload before the appearance of clear decrements in task performance measures. It further illustrates that skin conductance level and respiration rate also provide a similar indication of change in workload. The relationship between the secondary task errors and the increase in physiological measures is consistent with the presumption that motivated individuals will attempt to maintain performance. This compensation is done by investing additional mental resources up to the point that resource capacity is close to or fully utilized. Approximately 88% of the total increase in heart rate, near 100% of the increase in skin conductance, and over 94% of the increase in respiration rate were observed at the intermediate difficulty level of the 1-back task, during which cognitive task performance was still high (a nominal 2.3% error rate). In contrast, as the error rate increased markedly (to 12%) during the more challenging 2-back task, the physiological measures showed only modest or negligible additional gain. These results are consistent with the notion that the resources participants had available (their capacity) or were willing to invest to maintain task performance (their motivation) had reached a tipping point and significant decrements in performance began to appear. This study reinforces previous work indicating that heart rate can be a sensitive measure of cognitive workload in the driving environment (1, 4). It extends the set of potentially useful measures available to driving research by demonstrating that respiration rate appears to be sensitive to modest increases in workload during simulated driving, as evidenced by the increase of three breaths per minute from baseline to the 0-back task. However, some caution must be observed in interpreting the respiration data, particularly given the marked plateau of the respiration rate at the level of the 0-back task. All three n-back tasks involved subjects verbally responding to the auditory stimuli that were presented at a rate of 10 items per 30-s trial. It is possible that the pacing of the task encouraged individuals to take breaths between item presentations, which, at 20 items per minute, closely corresponds to the mean respiration rate. In retrospect, it is apparent that a task without fixed-rate pacing is necessary to elucidate how respiration is affected by increasing cognitive load. Although it is plausible that the increase in respiration rate associated with the introduction of the n-back tasks is due to the change in workload, it could be an artifact of the task pacing. It is also possible that respiration rate was constrained from increasing beyond the level observed during the 0-back due to the consistent pacing across the three tasks. In contrast with the HASTE project findings (11), which found skin conductance sensitive to increases in visual but not auditory secondary tasks during simulation, it was found that skin conductance clearly documented a change in physiological arousal associated with the increasing complexity of auditory n-back tasks. That three distinct physiological indices appeared sensitive to changes in cognitive workload may have significance beyond providing parallel measures. There is a substantive body of research on cognitive tasks and arousal demonstrating that individuals differ in which physiological measures show the most reactivity, though it is not often discussed outside the psychophysiological literature (13, 14). Thus, one individual may be most reactive in heart rate, another in sweat gland activation (skin conductance), and another in respiration, and so forth. This phenomenon is referred to as individual response stereotype or individual response specificity. Inspection of individual records from this data set revealed that there were participants who showed
Mehler, Reimer, Coughlin, and Dusek
significant reactivity during the cognitive tasks in one of the physiological parameters while demonstrating limited or no obvious change in other measures. This finding suggests that reactivity in some subjects would have been missed if only a single physiological parameter had been used to assess workload. It is the authors’ intention to return to this and other data sets in the future to carry out individual case analyses to determine the percentage of responses that would have been overlooked by using single measures. This possibility of Type II error (failure to detect a real phenomenon) by employing a single physiological index has been raised within the psychophysiological research community (21). This is an important point to be considered in human factors research using physiological measures to assess workload as well as by development teams that are investigating the use of physiological parameters as input into the design of safety detection systems. This study demonstrates that physiological measurement tools designed for laboratory or medical environments can be successfully used in simulated driving conditions. Movement artifacts associated with the driving task were present in the recordings but were, in most instances, correctable after manual review of automated detection routines. The wrist-to-wrist configuration was selected for EKG measurement since it is seemingly less intrusive than a more traditional chest lead placement. Subsequent methodological investigation in the authors’ laboratory indicates that a modified lead II EKG lead configuration, with electrode placements just below the left and right collar bones and on the side at approximately the level of the lower left rib, provides a significant reduction in movement artifact and electromyogram contamination from active steering wheel control. This approach is recommended for research applications. These placements can be made while maintaining a high degree of modesty and are well accepted by research subjects. The development of unobtrusive measures for future production vehicles that are acceptable to consumers and deal appropriately with artifacts in real time presents a greater challenge. Recent developments—such as the work reported by Partin et al. (15) on modification of a seat-based pressure detection system to monitor respiration—provide encouragement for advances in unobtrusive sensing, although issues of vibration and signal dampening from heavy clothing must be resolved. EKG monitoring directly from the steering wheel has been explored with some success (22); however, single-handed wheel grip and hand removal during active steering or to interact with vehicle controls results in discontinuities in monitoring with this approach. In summary, these findings provide additional support for the value of using physiological measures of mental workload in drivingrelated human factors research and possibly for future application in monitoring operator capacity in safety-related systems. All three physiological measures indicated changes or differences in relative workload before, or in the absence of, significant performance-level effects. The point is not that physiological measures are superior to performance-based measures, but simply that they can provide indications of changes in load or engagement at lower levels of demand and temporally earlier in the demand curve. The diagnosticity of peripheral measures such as heart rate and skin conductance has been questioned since other factors such as emotional or physical workload also affect these variables (23). Although this point is well taken, it does not detract from the capacity of these measures to signal that total load across these domains has increased. The robust results across all three physiological measures suggest that single parameters such as skin conductance or respiration rate may provide insight into drivers’ overall workload in a manner consistent with heart rate. Most importantly, the association between measurements provides
11
redundancy that may allow future vehicle safety systems using physiological measures of driver state to sample across physiological parameters. This may provide system designers with a method of overcoming the limitations associated with any single measure (24) that may not be captured during all activities or that is underreactive in a given individual.
LIMITATIONS The data presented here are based on the sequential presentation of each level of task difficulty. While participants were given a practice set before the presentation of the scored 0-back task, it is not possible to estimate the extent to which evaluation apprehension or novelty contributed to the arousal observed during this initial level. It would be useful to extend this work by examining the effect of multiple presentations and a random presentation order for each level of secondary workload. The possible confounding of the pacing of verbal responses during the n-back tasks on respiration has already been discussed. It will be important to look at respiration under conditions without such pacing to determine more accurately the usefulness of respiration rate as a measure of workload. Finally, the extent to which the results generated in the driving simulator apply to actual driving is unknown. A series of studies is currently underway that attempts to address these questions.
ACKNOWLEDGMENTS The authors gratefully acknowledge the support of Ford Motor Company and the U.S. Department of Transportation’s Region I New England University Transportation Center at the Massachusetts Institute of Technology. The authors also acknowledge the contributions of Jonathon Long, Alex Pina, and Alea Mehler for their effort in the collection and processing of data and Katie Godfrey for comments on the text.
REFERENCES 1. Brookhuis, K. A., and D. De Waard. Assessment of Drivers’ Workload: Performance and Subjective and Physiological Indexes. In Stress, Workload, and Fatigue (P. A. Hancock and P. A. Desmond, eds.), Lawrence Erlbaum Associates, Mahwah, N.J., 2001, pp. 321–333. 2. Wickens, C. D., and J. G. Hollands. Engineering Psychology and Human Performance, 3rd ed. Prentice Hall, Upper Saddle River, N.J., 2000. 3. Wilson, G. F. Psychophysiological Test Methods and Procedures. In Handbook of Human Factors Testing and Evaluation (S. G. Charlton and T. G. O’Brien, eds.), Lawrence Erlbaum Associates, Mahwah, N.J., 2002, pp. 127–156. 4. Lenneman, J. K., J. R. Shelley, and R. W. Backs. Deciphering Psychological-Physiological Mappings While Driving and Performing a Secondary Memory Task. Presented at Third International Driving Symposium on Human Factors in Driver Assessment, Training, and Vehicle Design, Rockport, Maine, 2005. 5. Brookhuis, K. A., and D. De Waard. The Use of Psychophysiology to Assess Driver Status. Ergonomics, Vol. 36, No. 9, 1993, pp. 1099–1110. 6. Backs, R. W., and K. A. Seljos. Metabolic and Cardiorespiratory Measures of Mental Effort: The Effects of Level of Difficulty in a Working Memory Task. International Journal of Psychophysiology, Vol. 16, No. 1, 1994, pp. 57–68. 7. Sazabo, A., F. Peronnet, L. Gauvin, and J. J. Furedy. Mental Challenge Elicits “Additional” Increases in Heart Rate During Low and Moderate Intensity Cycling. International Journal of Psychophysiology, Vol. 17, No. 3, 1994, pp. 197–204.
12
8. Veltman, J. A., and A. W. K. Gaillard. Physiological Workload Reactions to Increasing Levels of Task Difficulty. Ergonomics, Vol. 41, No. 5, 1998, pp. 656–669. 9. Kramer, A. E. Physiological Metrics of Mental Workload: A Review of Recent Progress. In Multiple-Task Performance (D. L. Damos, ed.), Taylor & Francis, London, 1991, pp. 279–328. 10. Brookhuis, K. A., G. De Vries, and D. De Waard. The Effects of Mobile Telephoning on Driving Performance. Accident Analysis and Prevention, Vol. 24, No. 3, 1991, pp. 309–316. 11. Engström, J., E. Johansson, and J. Östlund. Effects of Visual and Cognitive Load in Real and Simulated Motorway Driving. Transportation Research Part F: Traffic Psychology and Behaviour, Vol. 8, No. 2, 2005, pp. 97–120. 12. Reimer, B., B. L. Mehler, A. E. Pohlmeyer, J. F. Coughlin, and J. A. Dusek. The Use of Heart Rate in a Driving Simulator As an Indicator of Age-Related Differences in Driver Workload. Advances in Transportation Studies: An International Journal, Special Issue, 2006, pp. 9–20. 13. Andreassi, J. L. Psychophysiology: Human Behavior and Physiological Response, 5th ed. Lawrence Erlbaum Associates, Mahwah, N.J., 2006. 14. Sternback, R. A. Principles of Psychophysiology: An Introductory Text and Readings. Academic Press, New York, 1966. 15. Partin, D. L., M. F. Sultan, C. M. Thrush, R. Prieto, and S. J. Wagner. Monitoring Driver Physiological Parameters for Improved Safety. SAE World Congress, Detroit, Mich., 2006. 16. Nachreiner, F., P. Nickel, and C. von Ossietzky. Sensitivity and Diagnosticity of the 0.1-Hz Component of Heart Rate Variability As an Indicator of Mental Workload. Human Factors, Vol. 45, 2003, pp. 575–590.
Transportation Research Record 2138
17. STISIM Drive. Systems Technology Inc., San Diego, Calif., 2005. 18. Zeitlin, L. R. Subsidiary Task Measures of Driver Mental Workload: A Long-Term Field Study. In Transportation Research Record 1403, TRB, National Research Council, Washington, D.C., 1993, pp. 23–27. 19. Reimer, B., L. A. D’Ambrosio, J. F. Coughlin, M. E. Kafrissen, and J. Biederman. Using Self-Reported Data to Assess the Validity of Driving Simulation Data. Behavior Research Methods, Vol. 38, No. 2, 2006, pp. 314–324. 20. SPSS 11.5 for Windows Users Guide. SPSS Inc., Chicago, Ill., 2002. 21. Gale, A., and J. A. Edwards. Individual Differences. In Psychophysiology: Systems, Processes, and Applications (M. G. H. Coles, E. Donchine, and S. W. Porges, eds.), Guilford Press, New York, 1986, pp. 431–507. 22. Osaka, M., H. Murata, Y. Fuwamoto, S. Nanba, K. Sakai, and T. Katoh. Application of Heart Rate Variability Analysis to Electrocardiogram Recorded Outside the Driver’s Awareness from an Automobile Steering Wheel. Circulation Journal, Vol. 72, No. 11, 2008, pp. 1867–1873. 23. Gaillard, A. W. K., and A. F. Kramer. Theoretical and Methodological Issues in Psychophysiological Research. In Engineering Psychophysiology: Issues and Applications (R. W. Backs and W. Bouscsen, eds.), Lawrence Erlbaum Associates, Mahwah, N.J., 2000. 24. Wilson, G. F., and F. T. Enggemier. Physiological Assessment of Workload in Multi-Task Environments. In Multiple-Task Performance (D. L. Damos, ed.), London, 1991, pp. 329–360. The Vehicle User Characteristics Committee sponsored publication of this paper.