Uncertainty Modeling in Classified Remotely Sensed Scenes .... objects. However, in high resolution remotely sensed data larger regions (i.e. a larger number of .... an independent solution (Java, Python) using existing open source libraries.
12th AGILE International Conference on Geographic Information Science 2009 Leibniz Universität Hannover, Germany
page 1 of 8
Implementation of Indeterminate Transition Zones for Uncertainty Modeling in Classified Remotely Sensed Scenes 1
Jochen Schiewe1, Manfred Ehlers2, Christoph Kinkeldey1, Daniel Tomowski2
HafenCity University Hamburg, Lab for Geoinformatics and Geovisualization, Hebebrandstr. 1, D22297 Hamburg, E-Mail: {jochen.schiewe, christoph.kinkeldey}@hcu-hamburg.de 2 University of Osnabrück, Institute for Geoinformatics and Remote Sensing, Seminarstr. 19a/b, D49364 Osnabrück, E-Mail: {mehlers, dtomowski}@igf.uni-osnabrueck.de
1.
INTRODUCTION
With the increasing importance of information derived from remotely sensed data for planning and decision processes also the necessity increases to generate binding and sound statements about the geometric and thematic uncertainties that go along with this information. However, in contrast to classical approaches problems arise in the course of an a priori evaluation of classification results, in particular for those that are based on spatial high resolution data. Consequently, new developments are necessary which are treated in the project „CLassification Assessment using an Integrated Method (CLAIM)“ which is performed by the authors and which is funded by the German Research Foundation (DFG). A key problem during the evaluation process is caused by the imperfections in the reference (“ground truth”) data itself. Because of the increased demands concerning better geometrical and thematic accuracies of modern sensor systems these uncertainties are becoming even more dominant and should not be neglected anymore. Hence, we propose an integrated approach that considers not only uncertainties in the classified but also in the reference data. Furthermore, the phenomenon of indeterminate boundaries gains in importance which can for instance be treated with methods known from fuzzy logic theory. But on the other hand so far no comprehensive solutions are known for the evaluation of uncertainties along indeterminate boundaries or within the resulting fuzzy transition zones. Based on a more detailed description of the overall problem and our general approach (see section 2) the focus of this contribution is on the geometric-semantic construction of these indeterminate transition zones (section 3). Some remarks on the implementation (section 4) and an outlook (section 5) complete this intermediate report about the project CLAIM.
2.
PROBLEM AND GENERAL APPROACH
2.1 General problem It is obvious that a variety of uncertainties has to be considered during the extraction of thematic information from remotely sensed data. For example, Gahegan & Ehlers (2000) describe a chain of uncertainties which runs parallel to the modeling process, i.e. from the acquisition of data over the classification towards the building of (topographical) objects in the end. Because single error sources cannot exactly be determined or cannot be determined at all, mostly approximating and summarizing methods are applied to describe the classification quality. For these purposes standardized empirical approaches are applied that look for the coincidence of reference and classified data and derive error matrices or single characteristic values (like overall, user and producer accuracy, or Kappa coefficient) from it (Congalton, 1991). Considering thematic processing of high resolution remotely sensed scenes new problems are arising which have been partly solved through the application of automated, region-based (or objectoriented) methods for segmentation and classification purposes and alternative (e.g. fuzzy logic) approaches for the actual allocation of a feature to an (topographical) object. On the other hand it has
12th AGILE International Conference on Geographic Information Science 2009 Leibniz Universität Hannover, Germany
page 2 of 8
to be stated that a comprehensive adaption of processes for the a posteriori evaluation of classification results has not been taken place so far. In this context, the following aspects have to be mentioned (for a more detailed discussion also refer to Schiewe & Ehlers, 2007 or Schiewe & Gähler, 2008): •
Within classical evaluation procedures (e.g. during a comparison between classification result and reference) one assumes that errors occur in the classified data only. This assumption is certainly acceptable for lower resolution remote sensing data due to the existence of reference data of higher order. But for high resolution data uncertainties in the reference data should not be neglected any longer because of the worse “relative resolution” between reference and sensor data. Consequently, we propose the need for an integrated evaluation method which also considers uncertainties in reference data.
•
Due to the higher spatial resolution indeterminate transition zones between certain object classes are increased in terms of the absolute number of pixels. Although adapted methods (like fuzzy logic approaches) have been developed for thematic classification purposes, analogous fuzzy logic methods for evaluation purposes are hardly applied.
•
Although region-based (or object-specific) methods are applied for interpreting remote sensing scenes, most evaluation approaches are still based on point- or pixel-based samples for comparing reference and classified data. Here also a transition towards object-specific evaluation methods becomes necessary.
2.2 Indeterminate transition zones This contribution focuses on modeling indeterminate transition zones and describing their uncertainties. In fact, a variety of reasons justify the usage of such transition zones in particular for processing high resolution remote sensing data as an alternative to conventional probabilistic methods. Among others these reasons are the following:
•
During an interpretation process rules for the allocation of an image object to a given (topographic) class normally assume determinate or discrete boundaries between these objects. However, in high resolution remotely sensed data larger regions (i.e. a larger number of pixels) evolve between classes (e.g., along the boundary of a forest) which make a unique allocation impossible or at least very subjective. Such indeterminate transition zones originate from limited positional accuracies or insufficiently semantic definition of objects and their boundaries.
•
A categorization of inherently complex spatial phenomena into discrete classes is strongly correlated with a given specific application leading to a certain object description process (Zhang & Goodchild, 2002). As a consequence, vague categories emerge from these descriptions, e.g. the differentiation between “city” and “suburb” or the categorization into “highly polluted” and “low polluted”. Using modern sensors a stronger thematic depth can and shall be achieved, so that this effect of vagueness occurs even more often.
•
Using modern sensors this fuzziness effect is even more increased due to the smaller ground pixel sizes because the spectral variance increases within regions which represent a single topographical object. This leads to a larger number of mixed elements (e.g. forest consists of trees, bare ground, etc.).
•
Finally it has to be mentioned that observed data quite often are not suited for a unique allocation to predefined (topographical) categories (Zhang & Goodchild, 2002).
For modeling indeterminate regions within a classification process the application of (ε-) bands (refer to Chrisman, 1992) or the fuzzy logic theory have been proposed. With respect to the latter the
12th AGILE International Conference on Geographic Information Science 2009 Leibniz Universität Hannover, Germany
page 3 of 8
concept of varying memberships to a class (from „no membership at all“ to „perfect membership“), along with its application for classification tasks, have been demonstrated by Fisher (2000). Also Wang (1990) postulates the application and proposes the derivation of a fuzzy partition matrix which summarizes the membership values of a feature to every possible class as defined in the object catalogue. Edwards & Lowell (1996) define a membership function for the description of spatial uncertainties. Here for all pairs of objects classes (so-called “twains”) fuzzy widths are introduced based on the mean deviations derived from repeatedly digitizing boundaries from aerial photos. The authors realized that not only the thematic membership but also the size of the polygons under consideration have an influence on the fuzziness (i.e., the smaller the area, the larger the fuzziness).
3.
GENERATION OF TRANSITION ZONES
Based on the outlined problem the general task consists in the definition of an extended quality or certainty measure (section 3.3) which considers uncertainties and indeterminate transition zones in both the reference and the classification result. In a first step the transition zones have to be constructed which run along all boundaries between the given objects. For that purpose geometric and semantic aspects have to be taken into account (section 3.1 and 3.2).
3.1 Geometric Modeling The transition zones serve as a model of the boundary area between two classified geographical objects. Their geometry is constructed depending on the kind of adjacent objects. Basically it is assumed that the transition areas are of symmetric kind, i.e. two adjacent objects share the same transition zone geometry.
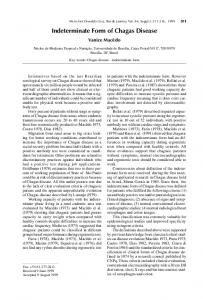
Figure 1: Creation of buffer around object boundaries (left) and definition of fuzzy membership function (right). In order to create the geometries for the transition zones the boundaries are buffered on both sides (fig. 1, left). The buffer's width depends on the classes of the respective objects and is being defined in advance on the basis of semantic aspects for each occurring pair of object classes (see section 3.2). Inside of the transition zone a fuzzy membership function is applied perpendicular to the object's boundary. The function values are defined in the interval [0.0, 1.0] (fig. 1 right). The result is a function that provides a value of 1.0 (full membership to respective class) on the inner boundary of the transition zone and a value of 0.0 (no membership) on the outer boundary. Currently the concept is limited to linear fuzzy functions but future research will consider nonlinear membership functions as well. It appears reasonable to apply different kinds of fuzzy functions
12th AGILE International Conference on Geographic Information Science 2009 Leibniz Universität Hannover, Germany
page 4 of 8
in order to consider the shape of different transitions between certain objects. Apart from the straightforward constellation which includes an object having just one single neighboring object the case of multiple adjacencies must also be taken into account. Figure 2 shows a way of dealing with this situation. The specified approach guarantees a consistent course of the function for the whole transition zone of the object without having to deal with special cases such as zone overlapping separately. Thus, the uniqueness of the membership calculation for the class of the respective object is ensured.
1.Segmenting of the object's boundary into partial boundaries
2.Creation of a transition zone for each partial boundary
3.Aggregation of partial zones to one overall transition zone
Figure 2: Creation of transition zones for multiple neighbors.
3.2 Semantic Modeling As already pointed out before, obviously the thematic membership of the neighboring objects under consideration have a significant influence on the fuzziness of the boundary and the width of the transition zone (Edwards & Lowell, 1996). For the implementation of our method we assume that artificial man-made structures like settlements or infrastructure for transportation systems have smaller und sharper border regions (because of their compact or elongated shape) than natural objects which show a more fuzzy behaviour (e.g. between ocean and coast or between forest and grassland). Because the landscape is more and more shaped through settlement or farming activities, the complexity of shape and fuzziness of elements is constantly reduced and the widths of the border regions become smaller, too. In our opinion a generally accepted specification for the width of border regions in terms of absolute numbers is not possible due to a couple of factors, in particular: •
Seasonal influences: Status and width of border regions of vegetation classes depend on the phenological situation of the examined plant community. The spectral reflectance of vegetation is always changing during its growth (see for example Lorenzen & Jensen, 1991) and depends on the physiological state of vegetation (see for example Penuelas et al., 1993). As another example, missing mulch during winter leads to a reduction of biomass in the class “forest” leading to a decrease of the width of the border regions.
•
Size and shape of neighbor regions: Edwards & Lowell (1996) discovered that the size of examined polygons has an influence on the sharpness of a border, and with that on the border width. As a consequence, smaller regions tend to be more fuzzy compared to larger regions, assuming otherwise stable conditions. Obviously, this fact makes it difficult to attach one and only one absolute width value to all regions of an object class.
12th AGILE International Conference on Geographic Information Science 2009 Leibniz Universität Hannover, Germany
page 5 of 8
•
Ground Sampling Distance: A high spatial resolution in combination with advanced multispectral sensors leads to a better spatial und spectral information content. In the classification process this leads to a huge number of very fine class constellations (salt and pepper effect). With that even more expert knowledge is needed to analyze and define the width of border regions compared to the case of low resolution remote sensing data so it becomes even more difficult to give generally valid definitions of transition zone widths from a semantical point of view.
•
Up-to-dateness: A general constraint for a valid analysis of reference and classified data is the temporal comparability of both data sets. If this criterion does not apply, the assumed width of the border regions is not valid in all cases. Caused by wrong or missing information the congruence of an object in the reference and the classified data set is not granted in all cases.
Alternatively, a qualitative approach for the definition of the width of boundary regions can be transferred from ecology. Jalas (1955) and Sukopp (1972) developed a system that describes the intensity of human influences, distinguishing “natural habitats” and “artificial habitats”. Based on that, regions under consideration are classified on a scale from “ahemerob” (natural) to “polyhemerob” (artificial). As result we have a measure for the influence of mankind on landscape. First approaches for the combination of the “grade of naturalness” with remote sensing data have been developed in the Austrian SINUS-project (refer to Wrbka et al. 2003). In this project a statistical correlation has been determined between landscape metrices calculated from remote sensing data (for example, the number of landscape elements, Shannon-diversity-index, Shannon-evenness-index) and the degree of the influence of mankind on landscapes. Based on these results and our own test series we started first attempts for the definition of boundary region widths. The result is an ordinal ranking that shows each class and its associated boundary width and how the classes are related to each other. We use a qualitative scale for the description of the width of the border regions, starting with „0“ for a very small width and ending with „+++++“ for a very large width (see table 1). Finally, we make the assumption that in the comparison of adjacent classes always the artificial (and thus sharp-sized) class assigns the width of the border region (minimum assumption). rank order class
classification
width
1.
habitat
very large width
+++++
2.
water
large width
++++
2.
small structures (for example naturalness grove)
large width
++++
3.
forest
average width
+++
4.
grassland
average width
++
4.
fallow land
average width
++
5.
farmland
marginal width
+
5.
fruit- and winegrowing areas
marginal width
+
5.
settlement and industry
marginal width
+
6.
traffic infrastructure very marginal width 0 Table 1: Comparison of the relations of border regions for different classes
12th AGILE International Conference on Geographic Information Science 2009 Leibniz Universität Hannover, Germany
page 6 of 8
3.3 Computation of the certainty measure CFCM The class memberships (μREF and μCLASS) determined as described in sections 3.1 and 3.2 form the basis for the derivation of the class-specific fuzzy certainty measure (CFCM). It provides an evaluation of the coincidence between reference and classification under consideration of uncertainty and fuzziness in both data sets. Apart from the transition zone areas the class memberships can either be 1.0 (if the point lies within an object of the class) or 0.0 (if the point does not lie within an object of the class). In the area of the transition zones the class memberships are determined by the fuzzy function leading to a value in the interval [0.0, 1.0]. Computing the difference between the class memberships μREF and μCLASS yields the overall certainty measure for each class as follows:
1 n CFCM (c ) = 1 − ∑ | µi , REF (c ) − µi ,CLASS (c ) | n i =1
∀i | µi , REF > 0 ∨ µi ,CLASS > 0
µREF(c):
class membership value of a pixel / area for class c in reference data
µCLASS(c):
class membership value of a pixel / area for class c in classification data
n:
number of pixels / areas under examination
A large CFCM value for a certain class indicates a high compliance between the objects of the class in the reference dataset and the classification.
4.
IMPLEMENTATION ASPECTS
Concerning the software implementation of the concept two major goals have been defined: On the one hand it is supposed to support the validation and the further development of the method, and on the other hand it shall serve as a library for the operational application of the process. For the actual realization a number of possibilities of software environments have been taken into account: •
an extension of a standard GIS software (ArcGIS);
•
a solution based on raster-oriented remote-sensing software (ERDAS IMAGINE, ENVI);
•
a solution based on a mathematics environment (MATLAB, Maple);
•
an independent solution (Java, Python) using existing open source libraries.
Since the implementation approach follows a high-standard object-oriented design the quality of the platform's programming interface was of particular importance. Finally, the evaluation of the mentioned options resulted in the choice of a solution based on the MATLAB platform. In the current version it provides a modern and comprehensive interface for object-oriented programming and a sophisticated development environment. The integration of supplementary MATLAB-packages such as the 'mapping toolbox' helps to decrease development time and efforts through the provision of useful standard routines – e.g. the routines for input and output of geodata and geometrical operations.
12th AGILE International Conference on Geographic Information Science 2009 Leibniz Universität Hannover, Germany
page 7 of 8
Following this approach, the basic model for the calculation of the certainty measure CFCM has been implemented within a relatively short period of time. The current state of the implementation already serves as an instrument for the validation of transition zones and their construction parameters. It is planned to extend the software gradually during future developments in order to build up a comprehensive library for practical use.
5.
CONCLUSIONS
The presented concept of modeling indeterminate transition zones in both the reference and the classified data allows for a well-founded description of uncertainty in classified remotely sensed data. Both geometrical and semantical aspects are considered in this process. With that the derivation of fuzzy logic membership values becomes possible which then lead to a class-specific certainty measure, providing the desired quantitative, integrated evaluation of the classification accuracy. The corresponding model has already been implemented in the MATLAB environment which serves as base for the validation of the transition zones and the construction parameters. Test series based on synthetic and real data and the integration of additional expert knowledge will help to further develop and to quantify the control parameters (e.g., for determining the width of transition zones) and the presented heuristic ordinal arrangement of classes. Also a successive expansion of the software library is part of our future work.
ACKNOWLEDGEMENTS The work presented here is part of the project “Development of an integrated, fuzzy logic- and object specific method for the a priori evaluation of classification results (CLAIM), which is funded by the German Research Foundation (DFG).
BIBLIOGRAPHY Chrisman, N.R. (1982): A Theory of Cartographic Error and Its Measurement in Digital Databases. AUTOCARTO, (5): 159-168. Congalton, R. (1991): A review of assessing the accuracy of classifications of remotely sensed data. Remote Sensing of Environment., (37): 35-46. Edwards, G. & Lowell, K.E. (1996): Modeling Uncertainty in Photointerpreted Boundaries. Photogrammetric Engineering & Remote Sensing. 62(4): 337-391. Fisher, P. (2000): Sorites paradox and vague geographies. Fuzzy Sets and Systems, (113): 7-18. Gahegan, M. & M. Ehlers (2000): A Framework for Modeling of Uncertainty in an Integrated Geographic Information System, ISPRS Journal of Photogrammetry & RS, 55: 176-188. Jalas, J. (1955): Hemerobe und hemerochore Pflanzenarten. Ein terminologischer Reformversuch. Acta Soc. Flora Fauna Fennicia, 72: 1-15. Lorenzen, B. & Jensen, A. (1991): Spectral properties of abarley canopy in relation to thespectral properties of single leaves and the soil. Remote Sens. Environ. 37: 33-47. Penuelas, J., Filella, C., Biel, C., Serrano, L. & Save, R. (1993): The reflectance at the 950- 970 nm region as an indicator of plant water status. Int. J. Remote Sens, 14: 1887-1905
12th AGILE International Conference on Geographic Information Science 2009 Leibniz Universität Hannover, Germany
page 8 of 8
Schiewe, J. & Ehlers, M. (2007): Fuzzy models for handling uncertainty in the integration of high resolution remotely sensed data and GIS. In: Morris, A. & Kokhan, S. (Hrsg.): Uncertainty in Environmental Security (NATO-Workshop, Kiew): 89-106. Schiewe, J. & Gähler, M. (2008): Modelling uncertainty in high resolution remotely sensed scenes using a fuzzy logic approach. In: Blaschke, T., Lang, S. & Hay, G.. (Eds.): Object-Based Image Analysis Spatial Concepts for Knowledge-Driven Remote Sensing Applications. Lecture Notes in Geoinformation and Cartography: 755-768. Sukopp, H. (1972): Wandel von Flora und Vegetation in Mitteleuropa unter dem Einfluß des Menschen. Berichte über Landwirtschaft, 50: 112-139. Wang, F. (1990): Improving Remote Sensing Image Analysis through Fuzzy Information Representation. Photogrammetric Engineering & Remote Sensing. 56(8): 1163-1169. Wrbka, T. et al. (2003): Landschaftsökologische Strukturmerkmale als Indikatoren der Nachhaltigkeit, final report of "SINUS" research project, Federal Ministry of Education and Research, Vienna, Austria (CD-ROM). Zhang, J. & Goodchild, M. (2002): Uncertainty in Geographical Information. Taylor & Francis