Implementing Green Technologies and Practices in a High Performance Computing Center (Submitted to IGCC’13, June 2013, Arlington VA USA)
J. U. Patel, S. J. Guercio, A. E. Bruno, M. D. Jones, and T. R. Furlani Center for Computational Research University at Buffalo, State University of New York 701 Ellicott St., Buffalo, NY USA 14203 Email: jaypatel,sguercio,aebruno2,jonesm,
[email protected] Abstract—In this paper we describe a comprehensive strategy of modelling, sensing, and using energy-aware technologies to improve the operational efficiency of a high-performance computing (HPC) data center. Modelling was performed using state of the art computational fluid dynamics (CFD) for optimizing air flow and air handler placement. Also included were the installation of a complete environmental monitoring system to provide the real-time tools needed to monitor operating conditions throughout the data center and utilize this information to calibrate the CFD models and realize energy savings. This system was used to implement subfloor leak management, isolation of unneeded regions, perforated tile optimization, and bypass airflow management to maximize the efficiency of the center’s cooling infrastructure without adding additional power. In addition, given the high-density of servers in a typical HPC data center rack, rack-based chillers that more efficiently deliver cooling to the servers were installed, allowing several of the large data center air handling units to be shut down. These changes, along with implementing a policy of energy awareness in major and minor equipment purchases, allowed us to achieve a remarkable ten-fold increase in computational capacity while simultaneously reducing the total energy consumption by more than 20%. The strategies and techniques utilized here are readily transferable to other existing data centers. Keywords—Data center efficiency, Green IT, data center monitoring, NYSERDA ,design studies, energy-aware systems, measurements, modelling and prediction , performance analysis and design
I.
I NTRODUCTION
Current trends in data centers have led to a crisis in terms of electrical and cooling capacity. The increasing computational power offered by rapid advances in processor design and fabrication has been offset by limitations in the ability to power (and more often, cool) the resulting high density server farms. Indeed, in 2006, 1.5% ($4.5B) of all the electricity consumed in the United States was consumed by data centers [1]. Given the ever increasing role that information technology plays in society, business, and science, it is not too surprising that data center operational costs have become a major concern, with institutions looking for ways to reduce cost while still providing and indeed expanding services. For example, federal agencies are mandated by Executive Order 13423 to achieve a 30% reduction in facility energy intensity by 2015 [2]. The trend is even more prevalent in high performance computing (HPC) centers, where server density is very high, and the servers typically run at greater than 90% utilization. HPC is
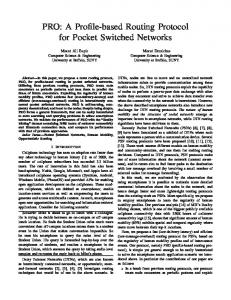
a critical technology for research, product development, and commerce in the U.S., therefore addressing these concerns is of critical importance. The highly compute and storage-intensive nature of HPC brings unique challenges in the domain of energy conservation, which have been studied in the context of scheduling compute intensive calculations to save energy [3]–[7], maximizing CRAH cooling efficiency [8], [9], as well as modeling feedback and control from cooling devices [10]. There are also established guidelines within the broader engieering context of data center efficiency [11]. In this work we present results from a series of cost-saving energy conscious measures undertaken on an existing data center facility that provides HPC resources to a large research university. Like many HPC providers, we are tasked with working within an existing data center whose fundamental parameters (location, power infrastructure, number and types of cooling devices, etc.) are already established. We then ask ourselves how we can best optimize this facility for energy efficiency while still accomplishing its core mission of high-performance scientific and engineering computing. A. Background The Center for Computational Research (CCR) [12], a leading academic supercomputing facility, provides University at Buffalo faculty and collaborators with access to highend computational resources, including an 8000 core cluster (QDR InfiniBand interconnect), a GPU cluster consisting of 64 NVidia Fermi GPUs, and more than 500 TB of high-speed storage. Total aggregate compute capacity is more than 100 TFlop/s (1 Flop/s = 1 double precision floating-point operation per second). In 2012, more than 2.1M jobs were run on CCR resources corresponding to 2.3M CPU days. CCRs 4000 sq. ft. data center, built in 2005, has three 225kVA Galaxy UPS modules [13] for input power (675kVA total), and seven Liebert [14] Model FH740c 30-ton computer room air handlers (CRAHs) for a total of 210 tons of cooling capacity. The CRAHs operate entirely on chilled water, which is supplied by a recently upgraded facility that is able to leverage the regional cool climate through air exchange for a substantial portion of the year. Fig. 1 shows the layout of the data center in early 2010, and is a conventional picture of such a facility. Cooling is provided by the CRAHs in the sub-floor plenum, which then makes its way to the servers through the ventilated tiles (squares
CCR Data Center (06/01/2010) 32 31 30 29 28 27 26 25 24 23 22 21 20 19 18 17 16 15 14 13 12 11 10 PAN13 PAN12 PAN11 PAN10
PAN9
PAN8
PAN7
PAN6
PAN5
9 PAN4
8
PAN3
PAN2
7
6
5
4
3
2
1
0
U4 U3 U2 U1
PAN1
SHARK
MUDP4
A CAC 5 B
600
C
dell dell dell dell dell dell dell dell dell (sc1425) (sc1425) (sc1425) (sc1425) (sc1425) (sc1425) (sc1425) (sc1425) (sc1425)
D
D23
D22
D21
F23
F22
F21
K16 D16
D15
D14
D13
D12
D11
D10
D09
D08
F16
F15
F14
F13
F12
F11
F10
F09
F08
Shark 1 (UPS+servers) Shark 2 (4/7 CRAHs+Panel21)
E F25
F27
UPS3
F24
F26
F07
F06
500
CAC 4
F
F05
dell dell dell dell dell dell dell dell dell dell dell dell (sc1425) (sc1425) (sc1425) (sc1425) (sc1425) (sc1425) (sc1425) (sc1425) (sc1425) (sc1425) (sc1425) (sc1425)
G
UPS1
J
L
K27
K25
K24
K23
K22
K16
K21
K15
K14
K13
myrinet K12
Force10 Force10 dell dell EMC (e1200) (e1200) (sc1425) (sc1425) (cx700) K11
K10
K09
K08
K07
EMC (cx700)
EMC (cx700)
K06
K05
PMM4
M28
M27
M26
M25
M24
M23
M16
M22
M15
M14
M13
M12
M11
M10
M06
dell dell dell dell dell dell dell (sc1425) (sc1425) (sc1425) (sc1425) (sc1425) (sc1425) (sc1425)
N
CAC 3
M
K28
PAN14
CAC 6
dell dell dell myrinet (sc1425) (sc1425) (sc1425)
K
SHUT OFF
I
M05
dell dell (pe1850) (pe6800)
BYPASS
O P PMM3
Q R
Force10 Force10 (e600) (e600) S14
S13
EMC EMC (cx700) (san01)
EMC (cx700)
EMC (cx700)
EMC (cx700)
EMC (cx700)
EMC (cx700)
EMC (cx3)
S12
S11
S10
S09
S08
S07
S06
RDC1 UPS2
CAC 7
S15
CAC 2
S16
S T U
U15
U14
U10
U12
U09
U08
U07
U06
400 300 200
PMM2
U05
PMM1
V
Electrical Load [kW]
H
PMM6
100
W
EMGCY
15 -1 2-
17 -1 1-
20 09
20 20 09
-1 0-
-0 9-
25
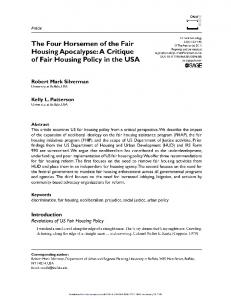
Fig. 2. Electricity usage in the second half of 2009 prior to upgrades, in units of kW. Black symbols and lines are servers measured before the UPS system, red symbols and lines (lower curve) are 4/7 of the CRAHs. Chilled water usage is not shown.
2) with dots in Figure 1), and an alternating hot and cold aisle arrangement (red and blue triangles, respectively). Note that CRAHs are numbered in order (1-7) counter-clockwise from the lower right-hand corner in Figure 1. Not surprisingly, as the Centers usage has grown, the need for additional resources has also grown. The biggest challenge has been to meet this growth in demand and still stay within our environmental limitations of power and cooling. No one would argue that the design shown in Figure 1 is optimal in terms of energy efficiency (modern large scale facilities can use containerized designs and/or entirely cool with ambient air), but not everyone has the luxury (or budget) to purchase pre-built containers or carry out a major data center renovation. Given these limitations, we carried out an aggressive campaign from late 2009 to the present to comprehensively reduce energy utilization, while simultaneously refreshing and expanding the centers computing and storage capacity. The methodology to achieve this, described in detail in the following sections, can serve as a useful roadmap for other organizations to follow to achieve similar results. It is important to note that our effort was aided significantly by three (with a fourth in progress) data center energy efficiency grants from the New York State Energy Research and Development Authority (NYSERDA) [15], as well as a National Institute of Health (NIH) [16] S10 equipment grant. I MPLEMENTATION
There were four major components to our strategy for improving the energy efficiency of our HPC operation: 1)
-0 8-
SHARK
Fig. 1. CCR machine room layout prior to the upgrades (early 2010). Computer room air handlers are labeled CAC 1-7 (counter-clockwise in order from the lower right-hand corner of the room, and are each 30-tons in cooling capacity. Each small square is a standard machine room tile, two feet square. Tiles with dots are ventilated (25%) to provide more airflow from the sub-floor. Red racks (mainly in upper right quadrant) were candidates for replacement.
II.
20 09
DD
20 09
CC
28
-0 620 09
BB
22
0
02
PMM5
AA
20 09
Y09
-0 7-
Y10
30
Y11
20 09
Y12
-0 6-
Y13
20 09
Y14
PAN16
Y15
Z
CAC 1
Y16
PAN17
Y
PAN15
X
Data Center Environmental Monitoring: improved
3)
4)
monitoring of the data center environment in order to guide key decisions on both hardware and operations. Data Center Modelling: computational fluid dynamics studies were performed to study and optimize the subfloor supplied air flow. Server Replacement: energy awareness in major and minor equipment acquisitions, as demonstrated in three key purchases in which major energy savings were achieved while simultaneously increasing compute capacity. Rack-based Chilled Water Cooling System: employing cooling systems that more efficiently deliver cooling to the servers.
At the outset of this project in 2009, we typically operated with an IT electrical load of approximately 400 kW (as shown in Fig. 2), and an overall data center PUE of 1.76 (detailed calculation in section III-A). We expand on each of the four components of our strategy below. A. Data Center Environmental Monitoring 1) Electrical: The first step in planning the upgrade strategy was to measure our energy utilization to better understand how current technology could help us achieve our goals of increased computational capacity and improved energy efficiency. Accordingly, we installed Shark model 200 energy meters [17] to measure the energy usage throughout the data center. The first Shark unit was deployed in line with the main power feed to CCRs uninterruptible power supply and is therefore capable of displaying real-time electrical usage for all of the CCR systems fed by the 675 kVA uninterruptable power supply (UPS). In practice, all of CCRs computing, network, and storage systems are fed by the UPS system, so this Shark monitor provides the core electrical monitoring capability. The second Shark unit was placed in the electrical supply line that provides power for 4 of the 7 total 30-ton Liebert air
Shark Meters
Synapsense
modbus SQL
IPMI Servers
IPMI 2.0
APC 7841 PDUs
SNMP
mySQL database server
nyserda.ccr.buffalo.edu web site
Fig. 3. Flow of monitoring information from the servers and Shark meters. The dashed line indicates that in the future we will incorporate the environmental sensor data from the SynapSense system into our main data warehouse.
conditioning units. The CRAH systems make up the balance of CCRs energy usage, as each Liebert air handler typically uses 12-15 kW of direct electrical power. Figure 2 shows the electricity usage measured by these Shark meters in the second half of 2009 (prior to the upgrades described in this paper). The black lines and symbols are the servers measured by the first Shark meter before the UPS (so losses in the UPS are included), and the red lines and symbols are from the second Shark meter and measure the electrical consumption of 4 of the centers CRAH units. Unfortunately, 3 of the 7 CRAH units were on a separate circuit and not metered during this timeframe. As evident in Figure 2, the total energy budget for the center was about 500 kW in this period, which represented about 60% of our total capacity. Fine-grained, server-based power monitoring is achieved through IPMI [18], the intelligent platform monitoring interface, an industry standard originally led by Intel but now supported by most major manufactures. IPMI standardizes access to important features in computer servers for so-called lights-out management features, namely the system health and monitoring even if the server is not actually running (as long as it is plugged in). The servers must first be enabled for IPMI over the local area network (using TCP/IP), and at the time only our newest servers had platform support for IMPI 2.0 (first specified in 2004), and could directly report power usage. CCRs older servers (purchased in 2005) support IPMI 1.5 and do not support direct power reporting, so it was necessary to instrument the older servers with metered power supplies (in this case APC 7841 power distribution units, or PDUs). The information produced by all the electrical monitoring hardware devices is automatically retrieved and stored in a central MySQL [19] database for power usage (discussed in more detail below). The ability to store, retrieve, and mine historical power consumption data will be key in the ongoing efforts to manage our power (and chilled water) consumption, as well as provide real-time access to the data provided by the Shark monitors, the metered PDUs, and the servers. A schematic diagram of the data gathering process, is shown in Figure 3. The central MySQL database houses the data repository for power usage, and also serves this data to the web interface reporting on this project. Data collection is customized to support the varying methods used by the hardware devices. The Shark meters use Modbus [20], a serial protocol often used for programmable industrial devices. Our newer servers utilize IPMI over the local area network (using TCP/IP). Access to the information gathered by the
APC 7841 PDUs was through the simple network monitoring protocol (SNMP), again over TCP/IP. A collection of Perl scripts constantly gathers and parses this information from the database server, which in turn is used to publish the information on the project web site [21]. In late 2011 we added a supplementary monitoring package from SynapSense [22] to give us an accurate picture of the environmental conditions in our data center at all times. The SynapSense environmental monitoring package consists of wireless sensors that are strategically placed throughout the data center. The sensors take readings every 5 minutes and transmit the data to a central server where it is then stored in a MySQL database (Figure 3). The central server runs a software application called SynapSoft that is responsible for storing and accessing this data. SynapSense gives us the capability to measure static pressure (above and below the floor) chilled water flow rates, water temperature, rack temperature of inlet and exhaust (at top middle and bottom) and power consumption. It is also expandable with a wide variety of sensors and can interface with third-party monitoring equipment manufacturers and has the ability to calculate our power usage effectiveness (PUE) in real-time. The collected data can be presented in real-time or over a customizable period of time in either a graphical or live imaging format. This capability provides us immediate feedback with respect to changes, allowing us to instantaneously determine how the changes affect the data centers operational environment. For example, when surplus perforated floor tiles were closed off as suggested by our computational fluid dynamics (CFD) study,the sensors immediately registered an increase in static pressure above the subfloor, resulting in greater airflow in areas that were previously under-cooled. We have also used SynapSense to identify areas in our data center where hot aisle air is seeping into the cold aisles, and used inexpensive blanking panels to prevent this from happening, further improving our cooling efficiency. Ideally, it would have been our strong preference to install the SynapSense (or other) monitoring package at the outset of our project, as it could be utilized to provide a historical record of our data center operations as well as valuable information to guide our data center efficiency project. Unfortunately, funding for the monitoring package was obtained in our third NYSERDA grant and therefore not available until late 2011. 2) Modelling & Cooling: With our electrical utilization well characterized, we next turned our attention to airflow within the center. To establish a baseline for improvements, the subfloor plenum space used to distribute air through ventilated floor tiles was studied using computational fluid dynamics (CFD). OpenFOAM [23] was used as the CFD solver (typically requiring 144 cores in parallel computation, further computational details are available upon request from the authors) and Paraview [24] was used for post processing and visualization, while geometry creation and meshing was done using ANSYS Fluent [25]. Standard guidelines were followed (see, for example, References [26] , [27] and references therein) in modelling data centers. The initial model was validated against a commercial study done in 2009 as part of a University-wide facilities effort to optimize data center spaces. The starting point is shown in Figure 4, which shows the state of the subfloor prior to optimization.
Fig. 4. CFD of the Data Center as of 2009-06 shows the air pressure and velocity in the subfloor. The data represented is prior to any energy improvements.
Fig. 5. Modelled results after implementing reduction and relocation of perforated floor tiles and idling two CRAHs (CRAHs 5 and 7, numbered counter-clockwise from the lower right corner of the room).
Figure 4 shows the velocity and static pressure of the air movement within the sub floor plenum. The simulation uncovered some noticeable areas of low pressure underneath the floor. The results of the CFD analysis pointed to excessive air leakage from the subfloor plenum resulting in reduced cool airflow in the areas where it is needed. The study suggested a few simple solutions that could be readily implemented with minimal cost to improve the data center cooling efficiency, including relocation and reduction in the number of perforated tiles, and sealing all unmanaged tiles (openings without grommets or a seal). Figure 6 shows the CFD studys predicted results based on these modifications, which clearly indicates that substantial improvements can be realized. Indeed, an increase in the under the floor static pressure of more than a factor of two was predicted based on these modest changes. Also the region of unoccupied space (close to CRAH 7, in the lower left corner) was isolated using inexpensive baffling, leading to the idling of CRAH 1, while preserving the subfloor pressure. This final arrangement is shown in Figure 6. Having characterized our data centers operation in terms of electrical consumption and cooling, we were well positioned to devise a strategy to achieve a substantial gain in efficiency, both in terms of data center power usage efficiency and highperformance computing (floating point operations per Watt). We begin with our server replacement strategy. We will revisit and validate the CFD model results in Section III-B.
Fig. 6. Modelled results after implementing all of the proposed modifications of the CFD analysis. Under the floor average static pressure was improved as a result of reduction and relocation of perforated floor tiles and isolation of the unused portion of the floor in the lower left corner of room. Note that 3 CRAHs were idled (CRAHs 1, 5, and 7, numbered counter-clockwise from the lower right corner of the room).
B. Server Replacement
Table I, which was used to guide our replacement strategy, summarizes, on a per-server basis, the comparison between existing equipment and candidate replacement servers.
Throughout our upgrade process we deployed thermally advantageous low-voltage processors (which are also higher density and offer significant performance advantages) to replace older generation processors. The latest generation of multi-core processors from Intel (and AMD, its primary competitor in the HPC market) take advantage of advances in semiconductor manufacturing to substantially reduce the overall power requirements while still increasing performance.
Table I shows a power consumption and peak performance comparison, between an existing compute server (purchased in 2005) and candidate replacement servers. For example, in the first upgrade the predicted savings in power was roughly 194 W per server at maximum load (467 W − 273 W). In addition, there is also a substantial improvement in peak performance of a factor of 5.7 (along with an concomitant increase in memory size from 2 GB to 24 GB, and local
TABLE I.
A COMPARISON BETWEEN EXISTING AND CANDIDATE REPLACEMENT SERVERS . D UE TO FUNDING TIMELINES , THE SERVER UPGRADE PROCESS WAS DIVIDED INTO 3 DISTINCT STAGES . P EAK PERFORMANCE IS THE UPPER LIMIT IMPOSED BY THE PROCESSOR ARCHITECTURE AND FREQUENCY AND IS MEASURED HERE IN GF LOP / S . 1 GF LOP / S = 109 DOUBLE - PRECISION FLOATING POINT OPERATIONS PER SECOND . M AXIMUM POWER UNDER WORKLOAD AND IDLE POWER CONSUMPTION WERE TAKEN FROM VENDOR PLANNING TOOLS .
Existing (2 cores) Candidate for stages 1,2 (8 cores) Candidate for stage 3 (32 cores) Candidate for stage 3 (32 cores)
Processor 3.2GHz ”Irwindale” Xeons 2.27GHz ”Nehalem” Xeons 2.13GHz ”Westmere-EX” Xeons 2.20GHz 6132HE ”Magny-Cours” Opterons
Peak Performance per core [GFlop/s]
Peak Performance per server [GFlop/s]
Power Used Max/Idle [W]
Number Replaced /Power(Max) [kW]
6.4
12.8
467/136
256/119.6
9.1
72.0
273/139
128/34.9
8.5
272.6
1230/615
8/9.8
8.8
281.6
865/433
8/6.9
disk from 80 GB to 320 GB to meet updated application requirements). HPC applications are typically highly compute and memory intensive, with a lower emphasis on local disk (network and shared storage consolidation were not addressed in these studies and are left for future work). Table I uses vendor data center planning software tools, which are relatively conservative in terms of their power estimates. Actual power utilization was expected to be less than that predicted by the vendor planning software, which we have quantified with measured data as described below. Due to the funding timeline of the NYSERDA awards, the server upgrade process was divided into 3 distinct stages. In each of the first 2 stages, we elected to replace 256 of our old servers with 128 new servers (as defined in Table I). Since each of the new servers has 8 cores, as opposed to 2 cores in the old servers, the core count for each of the first 2 stages actually increased from 512 cores to 1024 cores despite a factor of 2 decrease in the number of servers. In the third and final upgrade (stage 3), we replaced 256 older servers with 16 32core servers. The 32-core servers were split between Intel and AMD based processors as a compromise between measured application needs and power efficiency. By matching the core count (512) between the old and new servers, we were able to budget the cost of the SynapSense monitoring package and chilled-water cooled racks into the stage 3 upgrade. While vendor data center planning tools were used to help guide our server replacement process, the actual impact of the server replacement on the centers electrical consumption was determined by measurement as described in Section II-A. Based on historical data measured over the course of a year, each of the old servers (circa 2005) consumed on average 266 W (204.3 kW total electrical demand for 768 servers). Measured energy usage for the stage 1 replacement servers, which were installed in January 2010, averaged 17.7 kW (128 servers corresponding to 138.3 W per server). Similarly, the measured average energy usage for the stage 2 replacement servers, which were installed in January 2011, was 19.1 kW (128 servers corresponding to 149.2 W per server). Finally, the stage 3 upgrade consisting of 16 32-core servers, carried out in August 2011, yielded an average measured electrical consumption of 7.2 kW. These averages are constantly re-evaluated and used in the real-time portion of the project monitoring website to continually update the electrical consumption and energy savings. From the server replacement alone (excluding any savings due to reduced cooling), the total reduction in electrical consumption was 160.3 kW (204.3 kW−17.7 kW−19.1 kW− 7.2 kW). Put another way, the electrical load from our servers in this phase of the project was decreased by almost 80%,
while substantially increasing our computing capacity. C. Rack-based Chilled Water Cooling Systems After the upgrade to more efficient servers, we turned our attention to the cooling system to improve operational efficiency. Based on the CFD simulations, we now had the data to support the suspicion that our CRAH units are by in large an inefficient way to cool our servers. The air is blown directly under the floor and along the way the flow is restricted by various obstructions (piping, cabling, plumbing, etc.) eventually, making its way through the hundreds of perforated floor tiles to the servers. Because of these subfloor restrictions, some areas of the data center receive more airflow than others as demonstrated in Figures 4 and 6. In some cases, as predicted by our CFD simulations and measured by the SynapSense sensors, we found the velocity of airflow from the perforated tiles was actually too high and was causing hot spots within the bottom of some racks. Basically, the high-velocity air simply blew right past the servers. Another issue that we were able to observe through the monitoring environment was the infiltration of the hot air into the cold air aisles. Although there are several potential solutions to address these issues, we decided to install Rittal LCP Plus [28] in-rack cooling units to handle cooling of our highest density racks. Rittal in-rack chillers are designed to provide precise cooling directly to the servers in a closed loop system in which the air providing the cooling never leaves the rack. The doors on the racks are solid and the hot air exiting the servers is drawn in by a series of low RPM high volume fans and directed over a heat exchanger before it returns as cool air to the front of the servers. We can set the precise temperature of server inlet air and the chiller uses an automatic valve to adjust the water flow through the heat exchanger to give us the exact amount of required cooling. This technology eliminates many of the airflow and cross aisle contamination problems that were prevalent in the data center. The chilled water racks also use significantly less power than a traditional CRAH unit. For example, the CRAH units that we have provide 30 tons of cooling and consume on average 12.5 kW of power whereas the in-row chiller units provide 8 tons of spot cooling and use a relatively meagre 850 W of power. Accordingly, we can achieve 30 tons of precisely positioned cooling with 1/4 the power (3 kW) needed for the CRAH unit. In total, we installed 8 Rittal LCP+ rack based chillers (the monitoring interface for one such unit is shown in Figure 7), which house the center’s highest density (in terms of thermal
a measurement taken during an electrical shutdown. The IT electricity usage will be our measured UPS input, subtracting the estimated loss. Ideally we would measure this loss, but it has not yet been practical to do so given the fixed nature of the electrical system.
Fig. 7. Rittal LCP+ web interface for monitoring in-line cooling racks. Eight such coolers, each with a 28 kW capacity are installed on the highest density equipment. The closed loop system eliminates hotspots and is one of the most efficient ways to deliver cool air directly to the servers. Temperature set points can be used for fine control of input temperatures to the servers.
load) servers. The total power consumption for all 8 racks is a modest 6.8 kW ( 0.85 kW per rack). Employing rack based chillers immediately allowed us to completely power down two of our 30 ton CRAH units for a net savings of 18.2 kW of electrical power (30.7 kW if a third CRAH is idled) while also providing much more effective cooling to our servers. III.
R ESULTS
A. Power Usage Effectiveness (PUE) and Data Center infrastructure Efficiency (DCiE) Here we document our calculation of power usage effectiveness (PUE) and data center infrastructure efficiency (DCiE), both before and after our sequence of upgrades. We use the PUE/DCiE quantities as defined by the Green Grid [29], and later expanded and more widely adapted by the Data Center Efficiency Task Force [30]. As we perform continuous monitoring at the level of the UPS system, sampling on the average of tens of minutes, we place our measurements in the level 1 category, subscripted by the averaging interval in months (M), and continuous sampling, namely, PUEL1,YC (or PUEL1 using Ref. [30], noting that we are using monthly average consumption numbers rather than annual since we do not have full annual data before and after our upgrades). Hereafter for simplicity we will drop the subscripts.
PUE =
Electrical + Cooling Total Energy = . IT Energy IT Electrical
(1)
In Eq. 1 we will use the following assumptions: •
20% loss in UPS/PDU systems, backed by the UPS manufacturers documentation (the UPS modules are rated at 93% at our typical load, and we will assume similar efficiencies at the PDU and power supply level, which should be an upper bound), as well as
•
Panel 21 (shown in Figure 2) houses a set of critical networking equipment and shares the same electrical feed as four of the seven CRAH units. This panel was metered (2011-09) and we will use the cumulative average (2011-09 to 2013-01) of 10.2 kW for its IT contribution.
•
Chilled water costs of .375 kW/ton based on a NYSERDA evaluation of our chilled water plant [31].
•
Measured average electricity usage of the CRAHs, 12.5 kW, over the course of 3 months, used for calculating savings in retiring CRAHs.
•
Lighting, we estimate that lights are utilized in the data center approximately 1/3 of the time.
•
We will ignore a small component of non-IT infrastructure that is fed from the UPS. Strictly speaking these items (smaller UPS modules, motor controls for our chilled water heat exchange system, etc.) should be broken out, but we believe them to contribute less than the uncertainty in our UPS/PDU loss estimate.
As shown in Table II, we had a data center facility of average efficiency to begin with, especially considering the shared use nature of the building. Through the upgrades we not only greatly increased our computational capacity by a factor of seven as outlined above, but also managed to increase our efficiency at the same time. Our plans are to idle a third CRAH unit, which should further increase our overall DCiE to 63%. Given the relatively inexpensive cost of chilled water at our facility, the largest gains in efficiency are provided by taking the cooling directly to the servers and turning off the relatively inefficient CRAHs. B. Pressure The SynapSense environmental monitoring system installed as part of this project has proven invaluable in terms of providing an accurate, real-time representation of our data center operational conditions. Indeed, it would be our strong recommendation that all data centers install an environmental monitoring system. Without this capability, managers are simply flying blind with respect to the centers operational conditions and accordingly lack a means to systematically improve operational efficiency. For example, our ability to measure static pressure (above and below the floor) and model changes was utilized to guide the management of the data center perforated floor tiles, resulting in a remarkable 50% increase in average static pressure (from .05 to .08 inch wg). This was achieved simply by reducing the number of perforated floor tiles and sealing off all unmanaged floor openings. The current data center static pressure map, as output from our monitoring system, is shown in Figure 8. C. Overall Energy Savings Figure 9 shows the cumulative effect of our series of upgrades, including the three NYSERDA funded awards (which
TABLE II.
VALUES USED IN PUE/DC I E EVALUATION , EXPRESSED IN UNITS OF AVERAGE K W. T HE LAST COLUMN REFLECTS TURNING OFF A THIRD CRAH UNIT IN 2012-11. IT Electrical UPS/PDU Losses Cooling, direct electrical Cooling, chilled water Lighting PUE DCiE
[2009-10,2009-12] 388 kW*0.8+10.2 kW=321 kW 388 kW*0.2=77.6 kW 87.5 kW 78.75 kW (4 kW)/3=1.3 kW 1.76 57%
[2011-01,2012-10] 308 kW*0.8+10.2 kW=257 kW 308 kW*0.2=61.6 kW 62.5 kW 56.25 kW (4 kW)/3=1.3 kW 1.71 59%
[2012-11-2012-12] 331 kW*0.8+10.2 kW=275 kW 331 kW*0.2=66.2 kW 50 kW 45 kW (4 kW)/3=1.3 kW 1.59 63%
600 Shark 1 (UPS+servers) Shark 2 (4/7 CRAHs+Panel21)
500 Electrical Load [kW]
NYSERDA-1 NYSERDA-2 NYSERDA-3 NIH S10
400 300 200 100
20 09 20 0809 25 20 1110 17 20 -0210 09 20 0510 04 -0 20 710 27 20 -1011 19 20 0111 11 -0 20 411 05 20 0611 28 20 0911 20 20 1212 13 -0 20 312 06 20 -0512 29 20 0812 21 -1 113
0
Fig. 8. Real-time view of the static pressure measures in inches wg. In this view, dark blue represents higher static pressure and dark green represents lower static pressure. The measured average static pressure is about .08 inch wg and represents a 50% improvement relative to that measured prior to the data center energy efficiency project.
all involved server trade-ins as discussed above) and the acquisition of a new compute cluster funded by a NIH S10 equipment grant (372 servers, nearly 90 kW in electrical demand, and the highest density equipment housed in the chilled water racks). Clearly visible are the decreases in electrical consumption that occurred after each of our three NYSERDA funded server replacements, each of which also resulted in a significant increase in our computational capacity. Purely as a result of these upgrades we have reduced our overall electrical footprint by about 105 kW (which includes not only the server upgrades but also the additional NIH cluster as well as the idled CRAHs), while increasing our computational capacity by a factor of 7 (from 13 TFlop/s of peak performance to approximately 100 TFlop/s). Remarkably, using peak performance per Watt as a handy measure of our computational productivity, we have gone from 36 GFlop/s/W to 234 GFlop/s/W. To give a rough measure of return on investment (ROI) for each phase of the upgrades, we take the server electrical and cooling savings (an additional 20% of the direct electrical savings) and find 7, 7.5, and 3 years respectively for the monetary ROI on the three server replacement stages. It should then also be noted that the performance gain (of new servers over the old) is approximately 2.8, 2.7, and 1.4, which complements the financial ROI, and makes the composite ROI
Fig. 9. Electricity usage for the entire upgrade period, from 2009-06 to 201212. Black symbols and lines are servers measured before the UPS system, red symbols and lines (lower curve) are 4/7 of the CRAHs. Noted are the specific energy savings projects (NYSERDA grants) as well as addition of a substantial compute cluster from an NIH S10 grant.
approximately the same for all three server replacements at about 2-3 years. The in-row cooling upgrade has the longest (purely financial) ROI at 7.8 years, while the CFD study, monitoring, and ventilated tile optimization is approximately 4.5 years. The purely infrastructure investments (cooling, CFD study, tile placement) will also almost certainly have the longest duration. The end result being that our users benefit from the increased compute capacity and the administration is equally pleased with the reduced operational costs resulting from the smaller energy footprint. IV.
C ONCLUSIONS & F UTURE W ORK
Unfortunately, many existing data centers were built when energy efficiency was not as important a driver in data center design as it is today, and therefore in most cases they are not operating as efficiently as their more modern counterparts. Exacerbating this situation is the fact that demand for computing and storage capacity is steadily growing, and institutions are in the unenviable position of looking for ways to reduce operational costs while also expanding services. All is not lost however, as this study clearly demonstrates that relatively modest steps can be undertaken to substantially improve the operational efficiency of existing data centers while simultaneously expanding computing, storage, and networking capacity. While these strategies were implemented in our high-
performance computing center, they are equally applicable to most data centers. Specifically we demonstrated that data center environmental monitoring systems and CFD-based airflow simulations can be employed to significantly improve the cooling efficiency throughout the data center through simple relocation and reduction in the number of perforated floor tiles. The costs of the monitoring system (commercial) and CFD study (inhouse expertise) were returned after approximately six months of idling a single CRAH.
[6]
[7]
[8]
[9]
Along with these strategies, implementing a policy of energy awareness in major and minor equipment purchases, allowed us to achieve a remarkable ten-fold increase in our computational capacity while simultaneously decreasing our total energy consumption by 20%. Impressively, as of January 2013, these strategies have saved the university more than 4 million kWh in electrical costs. Dissemination is an important component of this program and up-to-the-minute results of our study are found at the link http://nyserda.ccr.buffalo.edu, which includes “Cost Savings” and “CO2 Savings” odometers that present up to the minute summaries.
[10]
[11] [12] [13]
In future work we will establish longer baseline PUE/DCiE measurements, and continue to make investments in high density energy efficient computational servers and storage, while expanding our direct cooling infrastructure (if possible, we also hope to comparatively evaluate passive cooling solutions). We also hope to explore finer-grained efficiency opportunities in workload scheduling/monitoring, and network and data storage consolidation.
[14]
ACKNOWLEDGMENTS
[19]
The authors gratefully acknowledge generous support from NYSERDA Grants 19717, 17689, and 10943, which provided the majority of the funds used to implement the IT efficiencies described here. The authors also gratefully acknowledge NIH grant 1S10RR028863-01 which provided funds to support an upgrade of our core computing and storage resources.
[20] [21]
R EFERENCES [1]
[2]
[3]
[4]
[5]
(2008) U.S. Environmental Protection Agency, Report to Congress on Server and Data Center Energy Efficiency: Public Law 109431. [Online]. Available: http://www.energystar.gov/ia/partners/prod development/downloads/EPA Datacenter Report Congress Final1.pdf (2007, April) Executive Order 13423, U.S. Federal Register. [Online]. Available: http://www.archives.gov/federal-register/executive-orders/ 2007.html L. Wang, G. von Laszewski, J. Dayal, and T. Furlani, “Thermal aware workload scheduling with backfilling for green data centers,” in Performance Computing and Communications Conference (IPCCC), 2009 IEEE 28th International, dec. 2009, pp. 289 –296. L. Wang, G. von Laszewski, J. Dayal, X. He, A. Younge, and T. Furlani, “Towards thermal aware workload scheduling in a data center,” in Pervasive Systems, Algorithms, and Networks (ISPAN), 2009 10th International Symposium on, dec. 2009, pp. 116 –122. J. Moore, J. Chase, P. Ranganathan, and R. Sharma, “Making scheduling ”cool”: temperature-aware workload placement in data centers,” in Proceedings of the annual conference on USENIX Annual Technical Conference, ser. ATEC ’05. Berkeley, CA, USA: USENIX Association, 2005, pp. 5–5. [Online]. Available: http://dl.acm.org/citation.cfm?id=1247360.1247365
[15] [16] [17] [18]
[22] [23] [24] [25] [26]
[27] [28] [29]
[30]
[31]
J. Moore, J. Chase, and P. Ranganathan, “Weatherman: Automated, online and predictive thermal mapping and management for data centers,” in Autonomic Computing, 2006. ICAC ’06. IEEE International Conference on, june 2006, pp. 155 – 164. T. Mukherjee, Q. Tang, C. Ziesman, S. Gupta, and P. Cayton, “Software architecture for dynamic thermal management in datacenters,” in Communication Systems Software and Middleware, 2007. COMSWARE 2007. 2nd International Conference on, jan. 2007, pp. 1 –11. Q. Tang, S. Gupta, and G. Varsamopoulos, “Thermal-aware task scheduling for data centers through minimizing heat recirculation,” in Cluster Computing, 2007 IEEE International Conference on, sept. 2007, pp. 129 –138. ——, “Energy-efficient thermal-aware task scheduling for homogeneous high-performance computing data centers: A cyber-physical approach,” Parallel and Distributed Systems, IEEE Transactions on, vol. 19, no. 11, pp. 1458–1472, nov. 2008. A. Banerjee, T. Mukherjee, G. Varsamopoulos, and S. Gupta, “Coolingaware and thermal-aware workload placement for green hpc data centers,” in Green Computing Conference, 2010 International, aug. 2010, pp. 245 –256. (2013, May) ASHRAE Datacom Series. [Online]. Available: https: //www.ashrae.org/resources--publications/bookstore/datacom-series (2013, May) Center for Computational Research, University at Buffalo, SUNY. [Online]. Available: http://www.ccr.buffalo.edu (2013, May) MGE, Acquired by APC. [Online]. Available: http: //www.apc.com (2013, May) Liebert, Emerson Network Power. [Online]. Available: http://www.emersonnetworkpower.com/en-US/Brands/Liebert (2013, May) New York State Energy Research and Development Authority. [Online]. Available: http://www.nyserda.ny.gov (2013, May) U.S. National Institute of Health. [Online]. Available: http://www.nih.gov (2013, May) Shark200, Electro-Industries/GaugeTech Inc. [Online]. Available: http://www.electroind.com/shark200.html (2013, May) IPMI, Intelligent Platform Monitoring Interface. [Online]. Available: http://www.intel.com/design/servers/ipmi (2013, May) MySQL, Oracle Inc. [Online]. Available: http://www. mysql.com (2013, May) Modbus. [Online]. Available: http://www.modbus.org (2013, May) CCR/NYSERDA Energy Savings Monitoring Page. [Online]. Available: http://nyserda.ccr.buffalo.edu (2013, May) SynapSense Inc. [Online]. Available: http://www. synapsense.com (2013, May) OpenFOAM. [Online]. Available: http://www.openfoam. org (2013, May) Paraview. [Online]. Available: http://www.paraview.org (2013, May) ANSYS Fluent. [Online]. Available: http://www.ansys.com J. Rambo and Y. Joshi, “Modeling of data center airflow and heat transfer: State of the art and future trends,” Distrib. Parallel Databases, vol. 21, no. 2-3, pp. 193–225, Jun. 2007. [Online]. Available: http://dx.doi.org/10.1007/s10619-006-7007-3 P. Kumar and Y. Joshi, Fundamentals of Data Center Airflow Management. Springer, 2012. (2013, May) Rittal LCP+. [Online]. Available: http://www.rittal-corp. com/products/index.cfm?n1ID=5&n2ID=50&n3ID=173 “Usage and public reporting guidelines for the green grids infrastructure metrics (pue/dcie),” White Paper 22, The Green Grid, October 2009. [Online]. Available: http://www.thegreengrid.org/en/ Global/Content/white-papers/Usage%20and%20Public%20Reporting% 20Guidelines%20for%20PUE%20DCiE “Recommendations for measuring and reporting version 2 measuring pue for data centers,” Report, Data Center Efficiency Task Force, 2011. [Online]. Available: www.thegreengrid.org/%7E/ media/WhitePapers/Data%20Center%20Metrics%20Task%20Force% 20Recommendations%20V2%205-17-2011.ashx?lang=en L. Cavanaugh, TRC Energy Services, 2011, private communication.