Implementing realistic occupant behavior in building energy simulations – the effect on the results of an optimization of office buildings. Wout Parys1, Dirk Saelens1 and Hugo Hens1 1
Laboratory of Building Physics, K.U.Leuven
Corresponding email:
[email protected]
SUMMARY In this research, the façade of a typical cellular office building is optimized for the moderate Belgian climate. Heating, cooling and lighting energy use are taken into account, assuming fixed system efficiencies. This results in a clear hierarchy of building designs, of which a representative set of 10 is selected. 144 profiles, based on state of the art empirical models of occupancy, lighting and blind control and heat gains by appliances, are defined and implemented for the set of building designs. Standard deviations up to 10% on the primary energy indicator are found, which implies a significant sensitivity that has to be taken into account when comparing simulated energy performances of building designs. Heating energy use proved quite robust to varying occupant behavior, in contrast with cooling and lighting energy use. INTRODUCTION In 2006, the Energy Performance Regulation came into force in Flanders, the northern part of Belgium. The EPR demands an evaluation of the building as a whole. This holistic approach has instigated a new search for optimized building designs. In office buildings however, many design and control decisions have conflicting consequences on the energy demand for lighting, heating and cooling, so finding this optimum is not straightforward. Earlier attempts to define optimal office building designs for a moderate climate, such as in [1] and [2], resulted in airtight, well insulated buildings with a very low glazing-to-wall-ratio (15%) and high thermal mass. In these studies lighting energy consumption was not considered. Instead, artificial lighting was represented as a constant heat gain. In [3], the total energy savings potential of daylighting for an office building with varying glazing material and glazing-to-wall-ratio was calculated. They did not include shading devices in their work, although it is well-advised to provide this in offices to control glare and direct solar irradiation. All of the aforementioned studies neglect the interaction between the building and its users: they assume a constant occupancy during working hours and no user control over lighting, blinds, windows or heating and cooling set points. As stated in [4] however, heating and cooling energy demands are sensitive to user behavior and require a more advanced user model. The aim of this research is twofold. Firstly, an optimization targeting minimum primary energy use is performed for a typical Belgian office building. Daylighting and the lighting energy use are included and the user behavior is simplified. Subsequently, a representative set of building designs is selected from the results of the optimization process and the impact of
advanced modeling of user behavior on the calculated energy demands, and thus the ranking of the designs after optimization, is assessed. METHODS Building model The model used in this study is a free standing building with cellular office spaces. It has 4 floors with a surface of approximately 500 m2. The floor plan (figure 1) is based on statistical research of Flemish office buildings [5]. The orientation of long axis of the building is varied: either west-east or north-south.
Figure 1. Floor plan of office building model. The external wall is a masonry cavity wall and the floor is a heavyweight, concrete construction. All surfaces are considered perfect diffusers, with a reflectance of respectively 70%, 50% and 30% for ceiling, walls and floor. The boundary conditions for the optimization process, listed in table 1, are in accordance with the respective standards ([6], [7], [8] and [9]). Table 1. Basic boundary conditions for building optimization Office cell Conference Sanitary Installed lighting power 11 W/m2 (1) 11 W/m2 4.5 W/m2 Occupancy 7am-5pm 10am-11am 2pm-3.30pm Ventilation rate (2) 36 m3/hpers 36 m3/hpers (3) 14 m3/hm2 supply supply extraction Int. gains (4) occupied 20 W/m2 45 W/m2 Int. gains (4) unoccupied 2 W/m2 Heating set points 21°C/15°C 21°C/15°C Cooling set points 25°C/30°C 25°C/30°C -
Storage 3.5 W/m2 -
Circulation 3.5 W/m2 7am-5pm
-
-
-
8 W/m2 1 W/m2 -
(1) Each luminaire is equipped with a daylight sensor and a dimmable electronic ballast. The lights are ideally dimmed according to the daylight level, up to a minimum light output of 3%. (2) Ventilation starts at 5am and ends at 5pm [8]. Fresh air is supplied at 16°C. (3) During occupancy 15 persons are assumed in the conference room. (4) Internal gains due to appliances and people. The split between convective and radiative gains is 50/50.
Heating and cooling demands are calculated with TRNSYS version 16 [10]. The building is simplified to a multi-zone model of 1 storey, with adiabatic ceiling and floor. Whole year simulations are performed for the moderate climate of Uccle, Belgium. The SHGC of every fenestration system –glazing and shading device- is dependent on the angle of incidence of the solar radiation. The WIS software [11] is used to compute the SHGC. The light simulations are performed with the Daysim software [12]. Daysim calculates the illuminance
in certain points due to daylight based on the daylight coefficient approach [13], combined with the Perez all-weather sky luminance model [14]. Optimization variables The design optimization variables and their ranges are the following: U-value of the opaque part of the external façade. This ranges from 0.6 W/m2K (the legal maximum for new constructions in Flanders up until Jan. 1st 2010) to 0.15 Wm2K (the Passive House Standard). Glazing-to-wall-ratio of the office cells. This ranges from 21% to 71%. Glazing type. 8 glazing types were selected from manufacturer’s data (see table 2). Glazing with U-value higher than 1.1 W/m2K is rarely placed in Belgium nowadays, so this is not considered. Types 1 to 6 represent the whole commercially available spectrum of visible transmittance (in discrete steps) and associated Solar Heat Gain Coefficient (SHGC) for double argon-filled low-e glazing. Types 7 and 8 are triple glazing. Shading device. The considered types are: (a) no shading device, (b) external screen and (c) external fixed louvers. Exception is the north-faced façade, where no shading device is applied. The louvers are horizontal for the south orientation and tilted 30° for the east and west orientation. The external screen is automatically lowered at 250 W/m2 solar radiation on the façade and is retracted when the radiation falls under 150 W/m2. Table 2. Various glazing types used in optimization Nr. Visible Transmittance [-] SHGC [-] 1 0.19 0.20 2 0.36 0.26 3 0.48 0.29 4 0.61 0.35 5 0.59 0.44 6 0.77 0.59 7 0.72 0.48 8 0.72 0.48
U-value [W/m2K] 1.1 1.1 1.1 1.1 1.1 1.1 0.6 0.8
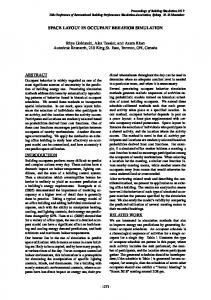
Behavioral model The sensitivity of the optimization results for realistic user behavior is studied by applying different user profiles on a selection of building designs. The profiles are produced based on a varying distribution of active and passive users in the building, a concept based on [15]. As many user control decisions occur at arrival or at departure from the office cell, the occupancy model can no longer be limited to an average profile. Detailed stochastic occupancy models for office cells have been proposed in [16] and [17]. In [18], a model for the use of spaces and movement between spaces in a building is introduced. These models however are designed to simulate the occupancy in existing buildings and require detailed inputs. Therefore, the decision was made to work with the occupancy model of the original Lightswitch model ([19]), with the improvement of cumulated arrival and departure probability functions as suggested in [20] (see figure 2). To account for the variability of occupancy among office buildings, 3 levels of occupancy are produced by multiplying the cumulated arrival probability function with factors 0.9, 0.7 and 0.5.
a) b) c) Figure 2. Occupancy model. a) cumulated probability function of arrival, b) cumulated probability function of departure, c) probability function of temporary absence (from [19]). In [15], the active and passive use of artificial lighting are defined. A passive user switches on the lights at arrival and keeps it on, even when temporarily absent. The switch-on decision of an active user depends on the daylight illuminance level and whether the user arrives, whereas the switch-off decision depends on the estimated time of absence. The probability functions that are used for the stochastic model of user decisions are those of [15], except for the intermediate switch-on probability [20]. Four distributions are defined: 100%, 90%, 70% and 50% of active users. Field data from two Austrian office buildings in [21] yield respectively about 95% and 85% of active users of lighting. In comparison to the well-established probability functions of the manual use of artificial lighting, models for occupant control of shading systems are less mature. Difference in driving variables and fenestration systems make comparison between the models difficult. The first complete model was introduced in [15]. It is a deterministic model, based on the observations in [22]. It defines an active shading user as someone who closes the shading system when 50 W/m2 direct solar radiation hits the work plane and doesn’t open it until arrival next morning. A passive user keeps the shading system closed during the whole year. The concept of active and passive use is maintained in this research, but the stochastic model of [23] is used for active blind control. It is based on over 5 years of field research and proposes probability functions of actions –lowering or raising of blinds- on arrival and during presence. These are function of illuminance levels inside and outside and the current position of the blinds. The model predicts actions on blinds and yields the subsequent position of the shading system. For this research, the resulting blind position is discretisized to 3 possible positions: fully lowered, fully retracted or halfway lowered. As quasi all studies point out that manual blind use is driven by visual stimuli, the spectrum of shading devices as optimization variable is extended. An internal screen, designed to control the visual environment is added to each of the proposed shading systems. Once again, four distributions of users are defined: 100%, 90%, 70% and 50% of active users. The combination of the aforementioned models results in a stochastic behavioral model, with a 5 minute time step, describing in detail occupancy and light and blind use in the office cells, which then serve as inputs for the building simulation. The boundary conditions for the spaces other than the office cells are those of table 1, by lack of appropriate behavioral models. Per selected building design, 144 building use profiles will thus be calculated: - 3 occupancy levels. - 4 distributions of active and passive users of artificial lights. - 4 distributions of active and passive users of blinds. - 3 levels of internal gains due to appliances in offices: 7W/m2 – 13 W/m2 – 26 W/m2.
RESULTS Optimization results Heating as well as cooling demands are calculated, to ensure a comparable level of thermal comfort in the building designs. In Belgium, heating is generally produced by boilers on fossil fuels, whereas cooling is produced by chillers on electricity. The SPF of chillers can roughly be estimated at 2.5 times that of a boiler. Since the conversion factor to primary energy is 2.5 for electricity and 1 for fossil fuels, the cooling and heating demand can be added and considered to be a fairly good indicator for the primary energy use for room climatization. The latter is only true for traditional cooling and heating production. For more innovative systems as heat pumps or geothermal free cooling, a different weighting factor for heating and cooling demand is necessary. Taking lighting energy use in account, this is multiplied by 2.5 and is added together with the heating and cooling demands as a rough indicator for total primary energy consumption of the building. Minimizing the latter is the objective of the optimization. The highest ranked building designs, regardless of the orientation of the building, are those with a combination of: - very low U-values of the opaque façade (0.15 – 0.20 W/m2K). - an external shading device. - moderate to large glazing-to-wall ratios (43% - 71%). - glazing types 3 or 4 (table 2), which combine a rather high visible transmittance with a moderate SHGC.
a) b) Figure 3. Primary energy indicator for building designs with a) external louvers, Uopaque = 0.15 W/m2K, glazing type 4 on the north façade and varying glazing-to-wall-ratio and glazing type on the south façade. b) no shading device, Uopaque = 0.20 W/m2K and varying glazing-to-wallratio and glazing type. Figure 3 illustrates the results of the optimization process for orientation west-east of the main building axis. The optimal glazing-to-wall-ratio is about 50% for the situation with an external shading device, when glazing with an optimal equilibrium between SHGC and visible transmittance is used. This ratio is smaller when standard HR-glass is used (type 6), because of the high SHGC. When glazing with a very low visible transmittance –and thus SHGC- is applied (type 1), the optimal ratio is higher, in order to maintain the balance between lighting energy use and cooling energy use. The same principles apply for the
situation without external shading device, though resulting in different optimal glazing-to wall-ratios. The absolute quantity of the primary energy indicator as calculated in this study is off course dependent on system choices specific for this situation. The HVAC system provides fresh air at 16°C throughout the year and thus consumes a fixed share primary energy of 327 MJ/m2a for basic heating and cooling. This could be lowered to about 150 MJ/m2a if a heat exchanger between supply air and return air was used. Influence of occupant behavior The influence of occupant behavior in the office cells is assessed by calculating the primary energy indicator for the 144 user profiles for the selected set of 10 building designs (table 3). Table 3. Selected set of building designs from basic optimization. Nr. Shading device Uopaque Glazing-to-wall-ratio Glazing south [W/m2K] [%] 1 No shading 0.15 71 Type 6 2 No shading 0.60 71 Type 6 3 No shading 0.40 71 Type 7 4 No shading 0.50 71 Type 8 5 External louvers 0.15 21 Type 2 6 External louvers 0.20 21 Type 3 7 External louvers 0.30 31 Type 1 8 External louvers 0.15 56 Type 5 9 External louvers 0.20 56 Type 2 10 External louvers 0.15 56 Type 4
Glazing north Type 6 Type 1 Type 8 Type 8 Type 1 Type 1 Type 6 Type 1 Type 4 Type 4
PE-ind [MJ/m2a] 547 533 521 508 493 481 468 455 444 437
In figure 4, the simulation results for the set of table 3 with boundary conditions from table 1 is compared with the results of these designs with varying stochastic behavioral profiles. Overall, it can be concluded that the assumptions proposed by the respective standards yield significantly higher energy consumptions then the more realistic behavioral models.
Figure 4. Average primary energy indicator and standard deviation for 144 behavioral profiles of selected set of building designs.
Furthermore, the sensitivity of the energy consumption to different types of occupant behavior undermines the clear hierarchy in building designs resulting from the basic optimization. Standard deviations on the primary energy indicator of 2% to 6% are found. These increase to 3% to 10% if a heat exchanger was added to the HVAC system. It must be kept in mind that this results from applying stochastic behavioral models to the office cells only, which take up about 50% of the building’s floor area. Implementing detailed behavioral models has a very limited effect on the building’s energy need for heating: the average result of the 144 behavioral profiles differs only by maximum 4% from the result of the calculation with deterministic boundary conditions, while the standard deviation is about 3%. Figure 5 shows that this is not the case for the cooling and lighting needs. Standard deviations up to 30% for cooling energy and 20% for lighting energy due to varying occupant behavior are calculated.
a) b) Figure 5. Average primary energy indicator and standard deviation for 144 behavioral profiles of selected set of building designs for a) lighting and b) cooling. DISCUSSION In this research, the façade of a typical cellular office building was optimized for the moderate Belgian climate. Heating, cooling and lighting energy use were taken into account, assuming fixed system efficiencies. This resulted in a clear hierarchy of building designs, of which a representative set of 10 was selected. 144 profiles, based on empirical models of occupancy, lighting and blind control and heat gains by appliances, were defined and implemented for the set of building designs. Standard deviations up to 10% on the primary energy indicator were found, which implies a significant sensitivity that has to be taken into account when comparing simulated energy performances of building designs. The concept of dividing people into passive and active categories ([15]) based on observational data, seems promising, because this allows calculating several distributions of user types over the building, accounting for the inherent uncertainty in user behavior. This approach should however be compared with data sets to test its representativity. The behavioral model used in this study is not complete. The use of windows and the local control of thermal set points are not included. Furthermore, it is limited to the office cells only.
ACKNOWLEDGEMENT This research was funded by the Institute for the Promotion of Innovation through Science and Technology in Flanders (IWT-Vlaanderen). This support is gratefully acknowledged. REFERENCES 1. 2. 3. 4. 5. 6. 7. 8.
9. 10. 11.
12. 13. 14. 15. 16. 17. 18. 19.
20. 21. 22. 23.
Al-Homoud, M. 1997. Optimum thermal design of office buildings. International Journal of Energy Research. Vol. 21, pp 941-957. Gratia, E and De Herde, A. 2003. Design of low energy offices. Energy and Buildings. Vol. 35, pp 473-491. Bodart, M and De Herde, A. 2002. Global energy savings in offices by the use of daylighting. Energy and Buildings. Vol. 34, pp 421-429. Hoes P, Hensen, JLM, Loomans, MGLC et al. 2009. User behavior in whole building simulation. Energy and Buildings. Vol. 41, pp 295-302. BBRI. 2001. Kantoor2000: Study of Energy Use and Indoor Climate in Office Buildings. ISO. 2007. ISO/FDIS 13790-2007: Energy performance of buildings – Calculation of energy use for space heating and cooling. CEN. 2004. NBN EN 13779:2004: Ventilation for non-residential buildings- Performance requirements for ventilation and room-conditioning systems. CEN. 2007. NBN EN 15251:2007: Indoor environmental input parameters for design and assessment of energy performance of buildings addressing indoor air quality, thermal environment, lighting and acoustics. CEN. 2002. NBN EN 12464-1:2002: Light and lighting – Lighting of work places – Part 1. Klein, SA et al. 1996. Trnsys manual, a transient simulation program. Solar Engineering Laboratory, University of Wisconsin-Madison, Madison. Van Dijk, D and Oversloot, H. 2003. WIS, the European tool to calculate thermal and solar properties of windows and window components. Proceedings of IBPSA 8, Eindhoven, Netherlands, pp 259-266. Reinhart CF. 2006. Tutorial on the use of Daysim simulations for sustainable design. Tregenza, PR and Waters, IM. 1983. Daylight coefficients. Lighting Res. Technol. Vol. 15, pp 65-71. Perez, R, Seals, R, Michalsky, J. 1993. All-weather model for sky luminance distribution – preliminary configuration and validation. Solar Energy. Vol. 50, pp 235-245. Reinhart, C. 2004. Lightswitch-2002: a model for manual and automated control of electric lighting and blinds. Solar Energy. Vol. 77, pp 243-260. Wang, D, Federspiel, CC, Rubinstein, F. 2005. Modeling occupancy in single person offices. Energy and Buildings. Vol. 37, pp 121-126. Page, J, Robinson, D, Morel, N, Scartezzini, J-L. 2008. A generalized stochastic model for the simulation of occupant presence. Energy and Buildings. Vol. 40, pp 83-98. Tabak, V, de Vries, B, Dijkstra, J, Jessurun, J. 2006. Interaction in activity location scheduling. Proceedings of the 11th International Conference on Travel Behavior Research, Kyoto, Japan. Newsham, G, Mahdavi, A, Beausoleil-Morrison, I. 1995. Lightswitch: a stochastic model for predicting office lighting energy consumption. Proceedings of the Third European Conference on Energy Efficient Lighting, Newcaste-upon-Thyne, UK, pp 60-66. Lindelöf, D, Morel, N. 2006. A field investigation of the intermediate light switching by users. Energy and Buildings. Vol. 38, pp 790-801. Mahdavi, A, Pröglhöf, C. 2009. Toward empirically-based models of people’s presence and actions in buildings. Proceedings of Building Simulation 09, Glasgow, Scotland, pp 537-544. Reinhart, CF, Voss, K. 2003. Monitoring control of electric lighting and blinds. Lighting Res. Technol. Vol. 35, pp 243-260. Haldi, F, Robinson, D. 2010. Adaptive actions on shading devices in response to local visual stimuli. Article to be published in International Journal of Building Performance Simulation.