International Journal of
Intelligent Systems and Applications in Engineering ISSN:2147-67992147-6799
Advanced Technology and Science
www.atscience.org/IJISAE
Original Research Paper
Improvement of Facility Layout by Using Data Mining Algorithms and an Application Melda KOKOÇ*1, Adnan AKTEPE2 ,Süleyman ERSÖZ3 , Ahmet Kürşad TÜRKER4 Accepted 3rd September 2016 Abstract: The facility layout problems are always important in the production or service industry system. For many years, it has been a common research field in active research. It seen that various methods were used in literature review for improving facility layout. We used association analysis which is one of the techniques of data mining in this study. The primary aim of this study is to improving the emergency department's efficiency, increasing patient satisfaction and employee satisfaction, decreasing travelled distance in emergency department. In this study, data acquired from information system of an emergency service was examined by means of data mining techniques (association rules such as GRI and Apriori) and relations between departments were found out. Association rules were analyzed via data mining techniques applied and then departments having more flow density with each other were determined. In consideration of this information an alternative facility layout planning was planned in regard to analysis results of departments’ closeness situations, advices of emergency service doctor and observations made. Keywords: GRI Algorithm, Apriori Algorithm, Facility Layout, Data Mining, Efficiency
1. Introduction Increasing of digital data in today has created new problems. Some of them are developing methods or systems in order to process huge and complicated data or new types of data, needing a method, protocol or platform to process distributed data, improving models due to data using and information security. Data mining includes the all of studies that analyse and apply induction processes that help to extract meaningful and useful information from the unstructured data [1]. In our day, amount of information on earth is continuously increasing because of storing data in digital platforms. The number of database is also increasing faster. As a result of cheapness of high capacity process ability, data storage has got easy and data has become cheap. Implementing only the best plan and operational policy is not enough to manage production and service systems efficiently. It also needs better facility layout planning. Data mining algorithms have been used in various Facility Layout Problem in literature review. Some of data mining studies which was done for service systems are; (Paolo Giudici; 2002) has used Markov Chain Monte Carlo Bayesian Model to acquire relations with customers’ behaviors [2]. In (Gül Gökay Emel; 2005)’s study, SuperQuery software and market share matrix of Boston Group have been used to acquire information which support strategic decision making of companies [3]. (Pinar ______________________________________________________________________________________________________________________________________________________________
1,2,3,4
Department of Industrial Engineering, Faculty of Engineering, Kirikkale University, Kirikkale, Turkey * Corresponding Author: Email:
[email protected] Note: This paper has been presented at the 3rd International Conference on Advanced Technology & Sciences (ICAT'16) held in Konya (Turkey), September 01-03, 2016.
This journal is © Advanced Technology & Science 2013
Yildirim et al; 2008) has pointed that he studies to obtain valuable information by means of using relational data mining on radiology database[4]. The aim of (Ali Serhan Koyuncugil et al;2008)’s study is prepare a substructure for using data mining in health and bring health professionals in new perspective about making decision process via presenting some examples[5]. In (Mehpare Timor et al; 2008) ’s study, data which was obtained from big community shop center has been analyzed by association rules and the variables effecting customers’ shopping behaviors has been determined by decision trees. SPSS Clementine has been used for data analysis [6]. Achieving integration of data mining and decision support is one of the most important results of (Derya Ay et al; 2008)’s study. In this study, data mining process is completed with regard to CRISPM-DM and then rules obtained from data mining support decision makers via Multi-Dimensional Scaling Analysis to decide how market must be located [7]. (Ali Sait Albayrak et al; 2009) has used decision tree analysis to determine the most important variables which discriminate industry and service companies with regard to choosing financial indicators [8]. (Çağatan Taskin et al; 2010)’s study approaches clustering of a retail companies ’customers in terms of shopping data via Kohonen Web [9]. The aim of (Civan Özseyhan et al; 2012) is to develop a recommendation engine for the web site working as a support system for the site members [10]. (Gürdoğan Doğrul et al; 2015) has analyzed traffic accident data by association rules in data mining [11]. Because our work is interested in the facility layout planning for the hospital, facility layout planning studies for the service system were also examined. Some of data mining studies which were done for service systems are; (Alwalid N. Elshafei; 1977) has set Quadratic assignment model to minimize patients’ effort IJISAE, 2016, 4(Special Issue), 92–100 | 92
between departments and total distance and edit departments’ layout [12]. He has developed heuristic model to solve this model. (Christian Stummer et al; 2004) has used mathematical models and two-phase solution method to determine size of hospital layout and units. While effective solution is searched by multi-purpose tabu search in first phase, clustering is applied to enable exploring of solution space in second phase [13]. In (ICheng Yeh ; 2006) ’s study, hospital building with 28 facilities was employed to demonstrate that this model is rather efficient to solve the architectural layout problem, and it is amenable to fast computation for large layout problems [14]. In (Behnam Malakooti et al; 2007)’s study, emergency department was edited as cellular form to improve efficiency of resources in regard to medical procedure in department [15]. (Lou Y. Liand; 2008) applied TS to Yeh’s hospital layout study and compared results with ANN method. The best solution was obtained for hospital layout [16]. In (Mohamed A. Ahmed et al; 2009)’s study, simulation has been used to analysis distribution of personnel and control over patient’s flow. In conclusion, patient’s waiting time has decreased %40 and labor assignment has increased %28 [17]. (Qiang Su et al; 2010) has used simulation techniques to queue and complexity in Patient Record System. Then, layout has been redesigned for new record process [18]. Aim of (M. Motaghi et al; 2011)’s study is increases the efficiency of the hospitals through patients’ improvement, changing the location of individuals, patients and facilities [19]. (Mohammed Assem et al; 2012) has used Graph Theory to determine layout of operating rooms and obtained nice solution by spiral technique. It has been decided that the layout which has the highest score among alternatives is the best layout [20]. (Ines Arnolds et al; 2012) developed mathematical model to assign units of hospital to rooms. Then, this model was compared with discrete-event simulation model to compare different layout scenarios [21]. (Min-Yuan Cheng et al; 2012) applied Particle Bee Algorithm to Yeh’s hospital layout study. Particle Bee Algorithm, Particle Swarm Algorithm, Bee Algorithm and Yeh’s study were compared. Particle Bee Algorithm and Yeh’s method showed better results but in some issues PBA had better opportunities [22]. (Hsin-Yun Lee; 2012) has aimed to minimize passengers’ total walking time in train stations and increase station’s service quality. Then, Ant Colony Algorithm was used. Total walking time was obtained by simulation method. Nearly optimal solution was acquired by Ant Colony Algorithm [23]. (İbrahim Çil; 2012) has edited supermarket layout planning by using association rules and multi-criteria search technique [24]. In (Tuncay Ozcan et al; 2013)’s study, mathematical method based on association rules has been developed to determine product categories and warehouse planning. Because developed model is NP-hard, heuristic model based on genetic algorithm has been developed to solve this model. Genetic Algorithm has been compared with Tabu Search and Simple Heuristic method to evaluate their performances. Finally, GA has showed the best performance [25]. In (Ibrahim H. Osman et al; 2015)’s study, FALP (Fixed Activity Layout Planning) and VALP (Variable Activity Layout Planning) were used to solve DOTLP (Dynamic Operating Theater Layout Problem) and mixed integer linear programming was offered. Alternatives layout planning was created [26]. (Teng-Kuan Wang; et al; 2015) has analyzed emergency department analysis and design to minimize waiting time and maximize service quality by using Value Stream Mapping and Cellular Production Method. Optimal personnel assignment has been done [27]. In
(Qing-Lian Lin; 2015)’s study, logistical and comprehensive relations between operating theaters were analyzed and relation chart was created. Taking account of exogenous factors, technological constraints and hospital’s potential, layout plans were obtained. These plans were evaluated by Fuzzy Constraint and the best of them was chosen [28]. (Abdelahad Charibi et al; 2016) has studied on design of operating rooms. In his study, design of these rooms have been reorganized to minimize movement cost between units, decrease operating costs and optimize facility planning by means of Particle Swarm Algorithm [29]. Before starting our study, emergency service was observed and the interview was conducted with emergency service doctor. The problems identified as a result of this analysis; Patients coming emergency service on foot and by ambulance enter emergency service from same entrances. While patients coming emergency service on foot go to the green departments, they pass through the red departments. Departments having more flow density with each other are far from each other. Emergency service doctor advised that department of radiology should be located near red and yellow area, a new emergency entrance should be opened for patients coming emergency service on foot and the newly opened entrance should be close to the green area. In the second section, the methods used in this study are described, data mining techniques were done to analyse the data were stated. In the Application section, how measurements were made and what calculations were performed were mentioned. FDC Algorithm (developed algorithm), new facility layout generated were explained. In the fourth section, results obtained were shown and improvement acquired was expressed numerically.
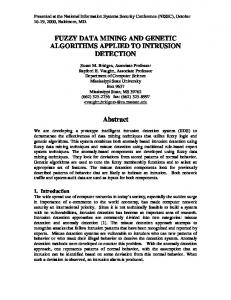
2. Methodology 2.1 Knowledge Discovery Process Knowledge Discovery Process covers the entire process of the discovery of useful information from the data. Data mining correspond to one step of the KDP. Data mining is the use of special algorithms for transferring the patterns from the data. KDP has developed as intersection of research areas such as machine learning, pattern recognition, databases, statistics, artificial intelligence, expert systems, data visualization, such as high-performance computing and it continues its development. Stage of The Knowledge Discovery Process is shown in Figure1. Firstly, data pass through data selection process then target data is obtained at the end of this process. In Pre-processing stage which is second stage, abnormal data is corrected and incomplete or bad data is removed. In data conversion process, pre-process data are categorized and sizes of the data are reduced. Then selected data mining techniques are applied on converted data. After evaluation step, information is obtained [30].
IJISAE, 2016, 4(Special Issue), 92–100 |
Figure 1. The Knowledge Discovery Process (adapted from [31])
2.2 Data Mining Stage in Knowledge Discovery Process Data mining is a process which is exploring patterns and relations in data by way of using various analyses tools and using these patterns and relations for valid estimates and also uncovering previously undiscovered information based on the wide range of data held in data warehouses and using this information to decide and to carry out the action plan [32]. Issues arise when databases used as inputs to data mining aren’t dynamic, full, wide, clear and compatible with the subject. Some of these issues; noise and missing values, missing data, uncertainty, size, updates, irrelevant data [10]. Some Applications of Data Mining; • Scientific and engineering data, • Health data, • Business data, • Shopping data, • Banking and financial data, • Education sector data, • Internet (Web) data, • Document data. Data mining techniques can be divided into two main categories as unsupervised and supervised. Unsupervised methods are used in order to understand, discover, recognize the data mostly and they aim to provide ideas for methods which are to be applied next time. Supervised methods are used to retrieval information and make inferences from data. [33]. Another type of classification for the data mining techniques is to analysing these techniques under two main titles including predictive and descriptive [34]. Predictive Methods aims to developing a model by acting data which is known results and estimating results value for data sets which aren’t known results by benefiting from this founded model. Descriptive model helps to identify patterns in available data that can be used as guide for decision-making [34]. Descriptive Methods: • Classification Decision Tree, Bayesian Classifier, Neural Networks, Decision Support Vectors, Nearest Neighbour Classification, Other Methods. • Regression Predictive Methods: • Clustering, • Association Analysis, • Sequential Analysis, • Other Methods. Short descriptions of some of these methods are described below; In artificial neural networks, purpose function is distributed over network of interconnected simple processor units [35]. Learning This journal is © Advanced Technology & Science 2013
algorithms which is used in artificial neural networks, calculate connection weights between units. Classification is the analysing of the properties of a new object and assigning this new object to a previously specified group [36]. The decision tree is used to extraction rules for the classification of the data set. After the decision trees have been created, the rules can be written down from the root to the leaf [37]. Regression models are developed to predict one or more variables in terms of other variables. Clustering is a technique for grouping similar records into data. Regardless of the method used, the clustering analysis process works the same way. Each record is compared to the existing clusters. The record is assigned to the closest cluster and this record changes the value that identifies the cluster which it is assigned. Until the optimum solution is found records are reassigned and cluster centres are set again [38]. Many programs have been developed to perform data mining techniques. Some of these programs are commercial (SPSS Clementine, SPSS, SAS, KXENI MATLAB) and others are open source (Rapid Miner, WEKA, R, C4.5, Orange, KNIME). 2.3 Association Analysis in Data Mining While association rules are found in big databases, the following two steps are followed [39]: 1- Frequently repeated items are found. Each of these items is repeated at least as often as the predetermined minimum number of support. 2- Strong association rules are generated from frequently repeated items. These rules must meet minimum support and minimum confidence rates. The minimum support rate and the minimum confidence rate are determined by the user and association rules exceeding these rates are taken into account. For example, if customers who buy a product A, buy also product B at the same time, this situation indicated by the Association Rule in following statement [40]: A => B [support rate = %4, confidence rate = %64] Support and confidence expressions are interesting measures of the rule. They indicate the usefulness and correctness of the discovered rule, respectively. For the association rule, support rate of 4% indicates that products A and B are sold together at 4% of all the analysed purchases. Confidence rate of %64 shows that 64% of customers who buy product A also buy product B at the same shopping [40]. Association analysis can be done using Apriori, GRI, AIS, SETM, CARMA, Sequence algorithms [32]. 2.3.1 Apriori Algorithm The Apriori model extracts rules which have the highest information content from a data set. Support-generality and confidence-accuracy values are calculated when information content is found. In the general literature, support value indicates the likelihood of coexistence of products and confidence value indicates how many of the records containing the first product IJISAE, 2016, 4(Special Issue), 92–100 | 94
contains the second product. However, the Support value obtained in the SPSS Clementine program specifies the percentage of antecedent type in total data set. The confidence value obtained in the SPSS Clementine program specifies how many of the records containing the antecedent type contains consequent-type records. The rule support value also specifies the percentage of exist of two types together. In other words, the concept of support in the literature is used as a rule support in SPSS Clementine. The Apriori algorithm is described below with an example. The minimum support rate is determined to be 30% and the confidence rate to be 60%. The algorithm was applied for the data in the Table 1. Table 1. Shopping Information
In Table 1, information including the shopping numbers and the products purchased at each shopping is given. The steps followed in Apriori algorithm are listed below [30]: 1. The first step of the algorithm is to find the number of supports for each product. The algorithm scans all purchases to find the number of support for each product. Results obtained are shown in column of number of support in Table 2. As seen in Table 2, 4 pieces from product 𝐼1 , 4 pieces from product 𝐼2 , 1 piece from product 𝐼3 , 3 pieces from product 𝐼4 and 3 pieces from product 𝐼5 and 2 pieces from product 𝐼6 were sold. Table 2. Number of Support of Product and Support Rate of Products
2. Disabling items which have lower support rate than the minimum support rate. 𝐼3 and 𝐼6 are disabled because support rate of products (17%) are less than minimum support value (30%). 3. Creation of binary combinations of products and finding support rates in order to determine which products are repeated frequently as binary. Table 3. Number of Support and Support Rate of Product Pairs
Product pairs (𝐼1 and 𝐼5 , 𝐼2 and 𝐼5 , 𝐼4 and 𝐼2 ) which support rate is 17% are disabled because their support rates are less than minimum support value (30%). 5. Creation of triple combinations of products and finding support rates in order to determine which products are repeated frequently as triple. Table 4. Number of Support and Support Rate of Triple Combination of Products
6. After products which are repeated frequently are determined, association rules are created. If customer 𝐼1 takes, this customer 𝐼2 and 𝐼4 also takes. [Support Rate= %33, Confidence Rate = %50] If customer 𝐼2 takes, this customer 𝐼1 and 𝐼4 also takes. [Support Rate= %33, Confidence Rate = %50] If customer 𝐼4 takes, this customer 𝐼1 and 𝐼2 also takes. [Support Rate= %33, Confidence Rate = %67] If customer 𝐼1 and 𝐼2 takes, this customer 𝐼4 also takes. [Support Rate= %33, Confidence Rate = %50] If customer 𝐼1 and 𝐼4 takes, this customer 𝐼2 also takes. [Support Rate= %33, Confidence Rate = %100] According to above results, providing a minimum support rate of 30% and a confidence rate of 60%, only two apriori rules was achieved. If customer 𝐼4 takes, this customer 𝐼1 and 𝐼2 also takes. [Support Rate= %33, Confidence Rate = %67] If customer 𝐼1 and 𝐼4 takes, this customer 𝐼2 also takes. [Support Rate= %33, Confidence Rate = %100] 2.3.2 GRI Algorithm GRI algorithm is an algorithm developed by Smyth and Goodman (1992) for use in measuring information content of a rule or hypothesis. The GRI Algorithm has a quantitative measure and bounds. Rules which are obtained by GRI Algorithm are divided into 2 classes. These classes are interesting and uninteresting. By means of GRI Algorithm uninterested rules are eliminated. Due to this eliminating process the rules which are high quality and lower quantity are obtained [10]. The GRI Algorithm is calculated by the J-scale as follows [15]; p( x / y ) 1 p( x / y ) 1 p( x / y)* log j ( X ;Y y) p( x / y) * log p ( x ) 1 p ( x)
p(x): Probability of occurrence of the left (antecedent) side of the rule p(y): Probability of occurrence of the right (consequent) side of the rule 2.4 Facility Layout Planning
4. Disabling items which have lower support rate than the minimum support rate.
Optimal facility layout planning plays an important role in the efficient operation of production and service facilities. The purpose of the plant layout is to develop a production or service system that meets the expected capacity and quality requirements economically. In other words, facility planning is to IJISAE, 2016, 4(Special Issue), 92–100 |
improve the layout of the system in order to optimize the performance of the system within certain criteria [41]. The Facility Layout Problem deals with the arrangement of the physical sections of facility for the efficient operation of a facility. FLP has been the subject to many researches due to the interdisciplinary importance. Bad layout brings about increasing of In-process inventory, overloading of material handling system, increasing of lead time, extension of material queues [34].
3. Application Patient flow information between hospital emergency departments constitutes the input for Spss Clementine.
Figure 4. Apriori Algorithm Results for Flow Data of Present Facility Layout
3.2 GRI Algorithm Implementation in Application for Present Facility Layout The result of GRI Algorithm implemented for present facility layout is shown in Figure 5. Relation between Ambulance Entrance and Green District has the highest confidence ratio which is %72,13. Relation between Red District and Radyoloji has the lowest confidence ratio which is %28,57. Figure 2. Present Facility Layout Plan [42]
When Apriori and GRI algorithm were applied, minimum support ratio and minimum confidence ratio program were determined as 10% and 25% respectively in SPSS Clementine. In Clementine software firstly, data is loaded with the "Excel.File" button into the "Sources" toolbox. Then the types of data and the properties of the data are determined by the "Type" button. At the same time, With this button it is possible to determine the variables which to be analyzed and determine the variables which to take place in the analysis results.. The "GRI" and "Apriori" buttons were used to determine the association rules. The Apriori Algorithm and the GRI Algorithm were applied for the present layout with the model shown in figure 3.
Figure 3. SPSS Clementine Model for Present Facility Layout
3.1 Apriori Algorithm Implementation in Application for Present Facility Layout
Figure 5. GRI Algorithm Results for Flow Data of Present Facility Layout
To assign a coefficient to the relations, considering Apriori Algorithm and GRI Algorithm Results Table 5, Table 6, Table 8 and Table 9 is obtained by applying below steps; Results of Apriori and GRI Algorithm are generated. Minimum and maximum confidence rates are determined in the confidence rates. Interquartile range is calculated by dividing into four interval of between maximum confidence and minimum confidence. Intervals are created by adding Interquartile range to starting from a minimum confidence rate. Coefficients are appointed to these intervals respectively 1, 3, 5, 7, 9. The aim of using odd number is needed to the even number for the implementation of the rule number 1.2.2 in algorithm. Namely, even numbers mustn’t be appointed to intervals.
The result of Apriori algorithm implemented for present facility layout is shown in Figure 4. Relation between Ambulance Entrance and Green District has the highest confidence ratio which is %72,131. Relation between Red District and Radyoloji has the lowest confidence ratio which is %28,571. IJISAE, 2016, 4(Special Issue), 92–100 |
This journal is © Advanced Technology & Science 2013
Table 7. Coefficients for Relations of Present Facility Layout’s Departments
Table 5. Interval and Coefficient According to Apriori Algorithm Results for Present Facility Layout
Interval (%) 00,000-28,571 28,572-39,461 39,462-50,351 50,352-61,241 61,242-72,131
Coefficient 1 3 5 7 9
Coefficient(Appriori) Coefficient(GRI)
Table 6. Interval and Coefficient According to GRI Algorithm Results for Present Layout
Interval (%) 00,000-28,57 28,58-39,46 39,47-50,35 50,36-61,24 61,25-72,13
Coefficient 1 3 5 7 9
3.3 FDC Algorithm 1.
According to Intervals which are generated by Apriori Algorithm’s and GRI Algorithm, coefficients are appointed. 1.1 If relations between departments are one-way, coefficient is appointed taking account of interval. 1.2 If relations between departments are mutual (either consequent is the antecedent of another relationship or antecedent is the consequent of another relationship in results of Spss Clementine); 1.2.1 If confidence rates of mutual relations are in the same interval, coefficient is appointed as the next coefficient. 1.2.2 If confidence rates of mutual relations are in the consecutive interval, coefficient is appointed as the next even number of higher coefficient of these two relations. 1.2.3 If confidence rates of mutual relations aren’t in the same or consecutive interval, coefficient is appointed as higher coefficient of these two relations. 2. FDC is calculated as below Equation 1 and the aim is maximization of FDC. n
n
A.E.-P.E. P.E.-RAD. RAD-P.E.O. A.E-RES. RES.-RED RED-RAD. A.E.-GREEN GREEN-RAD P.E.-M.S. A.E.-RED RED-RES. A.E.-YELLOW YELLOW-RAD. YELLOW-P.R. P.E.-P.R. A.E.-M.S. M.S.-GREEN P.E.-P.E.O GREEN-P.R. A.E.-RED. RES.-RAD. M.S.-P.R.
7 1 1 1 1 4 9 1 1 7 1 9 1 1 1 7 7 1 6 1 1 5
7 1 1 1 1 4 9 1 1 7 1 1 1 1 1 1 1 1 1 1 1 6
As shown in Table 7, according to Apriori algorithm the associations with the highest coefficients are the relationships between Ambulance Entrance and Green District and Ambulance Entrance and Yellow District. According to the GRI algorithm, the relationship with the highest coefficient is the relationship between Ambulance Entrance and Green District.
m
FDC f ij d ij cij
(1)
i 1 j 1 k 1
Figure 6. Alternative Facility Layout Plan [42]
-
f ij
: The number of flow between i and j departments
- d ij : Rectilinear distance between i and j departments - cij : Relation Coefficients between i and j departments obtained via developed algorithm.
In order to compare the alternative layout and the present layout, coefficients should be assigned to relations between departments in alternative layout. For this reason, the procedure applied to find the coefficient interval for the present layout was used for alternative layout plan. The Apriori Algorithm and the GRI Algorithm were applied for the alternative layout with the model shown in figure 7.
Considering results of Apriori Algorithm and GRI Algorithm, coefficients are appointed to relations of presents facility layout’s departments using FDC Algorithm in Table 7.
IJISAE, 2016, 4(Special Issue), 92–100 |
Figure 7. SPSS Clementine Model for Alternative Layout
When Apriori and GRI algorithm were applied, minimum support ratio and minimum confidence ratio program were determined also as 10% and 25% respectively in SPSS Clementine for alternative layout. 3.4 Apriori Algorithm Implementation in Application for Present Facility Layout The result of the Apriori algorithm applied to the alternative plant layout is shown in Figure 8. Relation between Walking Entrance (the newly opened entrance) and Green District has the highest confidence ratio which is %73,81. Relation between Pediatric Emergency Department and Minor Surgery has the lowest confidence ratio which is %25.
Figure 9. GRI Algorithm Results for Flow Data of Alternative Facility Layout
Applying steps which are explained under FDC Algorithm title, coefficients has assigned to relations. In this assignment process, Apriori Algorithm and GRI Algorithm results in Table 8 and Table 9 has taken into account. Table 8. Interval and Coefficient According to Apriori Algorithm Results for Alternative Facility Layout
Interval (%) 00,000-25,00 25,01-37,20 37,21-49,41 49,42-61,61 61,62-73,81
Coefficient 1 3 5 7 9
Table 9. Interval and Coefficient According to GRI Algorithm Results for Alternative Facility Layout
Interval (%) 00,000-25,00 25,01-37,20 37,21-49,41 49,42-61,61 61,62-73,81
Coefficient 1 3 5 7 9
Considering results of Apriori Algorithm and GRI Algorithm, coefficients are appointed to relations of alternative facility layout’s departments using FDC Algorithm in Table 9. Figure 8. Apriori Algorithm Results for Flow Data of Alternative Facility Layout
3.5 GRI Algorithm Implementation in Application for Present Facility Layout The result of GRI Algorithm implemented for present facility layout is shown in Figure 9. Relation between Walking Entrance(the newly opened entrance) and Green District has the highest confidence ratio which is %73,81. Relation between Pediatric Emergency Department and Minor Surgery has the lowest confidence ratio which is %25.
IJISAE, 2016, 4(Special Issue), 92–100 |
This journal is © Advanced Technology & Science 2013
Table 10. Coefficients for Relations of Alternative Facility Layout’s Departments
Coefficient(Appriori) Coefficient(GRI) A.E.-P.E. P.E.-RAD. RAD-P.E.O. A.E-RES. RES.-RED RED-RAD. A.E.-GREEN GREEN-RAD P.E.-M.S. A.E.-RED RED-RES. A.E.-YELLOW YELLOW-RAD. YELLOW-P.R. P.E.-P.R. A.E.-M.S. M.S.-GREEN P.E.-P.E.O GREEN-P.R. A.E.-RED. RES.-RAD. M.S.-P.R. W.E.-GREEN W.E.-P.E. W.E.-M.S.
1 1 1 1 1 5 1 1 1 7 1 9 1 1 1 5 7 1 5 1 1 7 9 5 1
1 1 1 1 1 3 3 1 1 7 1 9 1 1 1 1 1 1 1 1 1 7 9 5 1
According to the Apriori algorithm and the GRI algorithm, as shown in Table 10, relation which has the highest coefficient is the relation between Walking Entrance and Green District.
4. Conclusion Taking account of intervals and confidence rates, FDC Algorithm is applied to identify the most relevant relations and assign coefficient to relations. FDC was tried to reduce by only decreasing distance. Alternative facility layout was generated by way of minimizing FDC and considering emergency service doctor’s advices. Considering emergency service doctor’s advice a new emergency entrance opened for patients coming emergency service on foot and patients coming emergency service on foot don’t not pass red area to head for green district. The newly opened entrance is close to the green area. Departments which are most relevant to each other such as Green-W.E (walking entrance / emergency entrance for coming on foot), A.E (ambulance entrance)-M.S (minor surgery), Green- P.R (plaster room) were located nearby to each other. According to Apriori Algorithm FDC decreased from 477083, 3 to 200268, 6 So, improvement acquired is %58. According to Apriori Algorithm FDC decreased from 366045, 4 to 172292, 2. So, improvement acquired is %53.
Acknowledgements The authors wish to thanks Kirikkale University, Kirikkale, TURKEY and department of industrial engineering.
References [1] M. F. Unlersen and K. Sabanci (2016). The Classification of Diseased Trees by Using kNN and MLP Classification Models According to the Satellite Imagery. International Journal of Intelligent Systems and Applications in Engineering. Vol.4. Issue. 2. Pages. 25–28. [2] Paolo Giudici and Gianluca Passerone (2002). Data Mining of Association Structures to Model Consumer Behavior. Computational Statistics & Data Analysis. Vol. 38. Pages. 533–541. [3] Gül Gökay Emel, Çağatan Taşkın and Arif Tok (2005). Pazarlama Stratejilerinin Oluşturulmasında Bir Kara Destek Aracı: Birliktelik Kuralı Madenciliği (A Decision Support Tool in the Formation of Marketing Strategies: Association Rule Mining). Dokuz Eylül Üniversitesi Sosyal Bilimler Dergisi. Vol.7. Issue. 3. [4] Pınar Yildirim, Mahmut Uludağ and Abdülkadir Görür (2008). Hastane Bilgi Sistemlerinde Veri Madenciliği (Data Mining in Hospital Information Systems). Akademik Bilişim.Pages.429-434. [5] Ali Serhan Koyuncugil and Nermin Özgülbaş (2008). Data Mining: Using and Applications in Medicine and Healthcare. Bilişim Teknolojileri Dergisi. Vol.2. Issue. 2. [6] Mehpare Timor, Umman Tuğba Şimşek (2008). Customer Behaviour Modeling by Using Market Basket Analysis in Data Mining. Yönetim: İstanbul Üniversitesi İşletme Fakültesi İşletme İktisadı Enstitüsü Dergisi. Vol. 59. Pages. 3-10. [7] Derya Ay, İbrahim Çil (2008). The Use Of Association Rules In Store Layout Planning At Migros Türk A.Ş. Journal of Industrial Engineering. Vol. 21 Issue. 2. Pages. 14-29. [8] Ali Sait Albayrak, Sebnem Koltan Yilmaz (2009). Data Mining: Decision Tree Algorithms and an Application On ISE Data. Suleyman Demirel University the Journal of Faculty of Economics and Administrative Sciences. Vol.14. Issue.1.Pages31-52. [9] Çağatan Taşkin, Gül Gökay Emel (2010). Data Clustering Approaches in Data Mining And an Application With Kohonen Networks in Retailing Sector. Suleyman Demirel University the Journal of Faculty of Economics and Administrative Sciences. Vol.15. Issue.3. Pages.395-409. [10] Civan Özseyhan, Bertan Badur and Osman N. Darcan (2012). An Association Rule-Based Recommendation Engine for an Online Dating Site. Communications of the IBIMA.Vol.2012. [11] Gürdoğan Doğrul, Diyar Akay, Mustafa Kurt (2015). Analysis Of Traffic Accidents By Rules Of Association. Gazi Journal of Engineering Sciences. Vol.1.Issue.2.Pages. 265-284. [12] Alwalid N. Elshafei (1977). Hospital Layout as a Quadratic Assignment Problem. Operational Research Quarterly. Vol. 28. Pages. 167-179. [13] Christian Stummer, Karl Doerner, Axel Focke and Kurt Heidenberger (2004). Determining Location and Size of Medical Departments in a Hospital Network: A Multiobjective Decision Support Approach. Health Care Management Science. Vol. 7. Pages. 63–71. IJISAE, 2016, 4(Special Issue), 92–100 |
[14] I-Cheng Yeh (2006). Architectural Layout Optimization Using Annealed Neural Network. Automation in Construction. Vol. 15. Pages. 531 – 539. [15] Behnam Malakooti , Nima R. Malakooti , Ziyong Yang (2007). Integrated Group Technology, Cell Formation, Process Planning, And Production Planning With Application to The Emergency Room. International Journal of Production Research. Vol. 42. Issue. 9. Pages. 1769-1786. [16] Lou Y. Liang, Wen C. Chao (2008). The Strategies Of Tabu Search Technique For Facility Layout Optimization. Automation in Construction. Vol.17. Issue. 6. Pages 657–669. [17] Mohamed A. Ahmed , Talal M. Alkhamis (2009). Simulation Optimization For an Emergency Department Healthcare Unit in Kuwait. European Journal of Operational Research.Vol. 198. Pages. 936– 942. [18] Qiang Su, Xiaoyun Yao, Ping Su, Jinghua Shi, Yan Zhu and Lei Xue (2010). Hospital Registration Process Reengineering Using Simulation Method, Journal of Healthcare Engineering. Vol. 1. Issue. 1. Pages. 67–82. [19] M. Motaghi, A . Hamzenejad, L. Riyahi, M. Soheili Kashani (2011). Optimization of Hospital Layout through the Application of Heuristic Techniques (Diamond Algorithm) in Shafa Hospital. Int. J. Manag. Bus. Res. Vol. 1. Issue. 3. Pages. 133-138. [20] Mohammed Assem , Bassem K. Ouda , Manal Abdel Wahed (2012). Improving Operating Theatre Design Using Facilities Layout Planning. Biomedical Engineering Conference. Pages.109-113. [21] Ines Arnolds, Stefan Nickel, Sara Shashaani, Christian Wernz (2012). Using Simulation In Hospital Layout Planning. Proceedings of the 2012 Winter Simulation Conference. [22] Min-Yuan Cheng, Li-Chuan Lien (2012). A Hybrid AIBased Particle Bee Algorithm For Facility Layout Optimization. Engineering with Computers. Vol. 28. Pages. 57–69. [23] Hsin-Yun Lee (2012), Integrating Simulation and Ant Colony Optimization to Improve the Service Facility Layout in a Station. Journal Of Computing In Civil Engineering. Vol. 26. Issue. 2. Pages. 259-269. [24] Ibrahim Cil (2012). A Data Mining Software Design And Application For Association Rule Technique. Expert Systems with Applications. Vol. 39. Pages. 8611–8625. [25] Tuncay Ozcan and Sakir Esnaf (2013). A Discrete Constrained Optimization Using Genetic Algorithms for A Bookstore Layout. International Journal of Computational Intelligence Systems. Vol.6. Issue. 2. Pages. 261-278. [26] Ibrahim H. Osman,Omar Elbeqqali,Abdelahad Chraibi, Said Kharraja (2015). Optimization of Dynamic Operating Theatre Facility Layout. 6th IESM Conference. [27] Teng-Kuan Wang, Taho Yang and Chih-Yao Yang (2015). Lean Principles And Simulation Optimization For Emergency Department Layout Design. Industrial
IJISAE, 2016, 4(Special Issue), 92–100 |
[28]
[29]
[30] [31]
[32] [33]
[34]
[35] [36]
[37] [38]
[39]
[40]
[41]
[42]
Management & Data Systems. Vol. 115. Issue. 4. Pages. 678-699. Qing-Lian Lin, Hu-Chen Liu, Duo-Jin Wang, Long Liu (2013). Integrating Systematic Layout Planning With Fuzzy Constraint Theory To Design And Optimize The Facility Layout For Operating Theatre in Hospitals. Journal of Intelligent Manufacturing. Vol. 26. Issue. 1. Pages. 87-95. Abdelahad Chraibi, Said Kharraja, Ibrahim H. Osman And Omar Elbeqqali (2016). A Particle Swarm Algorithm for Solving the Multi-objective Operating Theater Layout Problem. IFAC-Papers Online. Vol. 49. Issue.12. Pages.1169–1174. J. Han and M. Kamber (2001). Data Mining Concepts and Techniques. Morgan Kaufmann Publishers. Bernstein, F. Provost, S. Hill (2005). Toward Intelligent Assistance for a Data Mining Process: An OntologyBased Approach for Cost-Sensitive Classification. IEEE Transactions on Knowledge and Data Engineering. Vol. 17. Issue. 4. Celementine (2002), Users Guide, 45. T. Hastie, R. Tibshirani, J. Friedman (2001). The Elements of Statistical Learning; Data Mining, Inference And Prediction. Springer Series in Statistics. 533. USA. Ning Zhong, Lizhu Zhou (1999). Methodologies for Knowledge Discovery and Data Mining. Third PacificAsia Conference, PAKDD'99. China, C. Bishop (1996). Neural Networks for Pattern Recognition, Oxford Univ Press. K. Sabanci and M. Akkaya (2016). Classification of Different Wheat Varieties by Using Data Mining Algorithms. International Journal of Intelligent Systems and Applications in Engineering. Vol.4. Issue. 2. Pages. 40-44. T. Mitchell (1997). Machine Learning. McGraw-Hill. E.K. Aydoğan, C.Gencer, S. Akbulut (2008). Churn Analysis And Customer Segmentation Of A Cosmetics Brand Using Data Mining Techniques. Journal of Engineering and Natural Sciences. Vol.26. Issue. 1. P. Smyth and M. Goodman (1992). An information theoretic approach to rule induction from databases. IEEE Transactions on Knowledge and Data Engineering.Vol.4. M. J. Zaki (1999). Parallel and Distributed Association Mining: A Survey. IEEE Concurrency. Vol. 7. Issue. 5. Pages. 14-25. L.R. Foulds, H. W. Hamacher, J. M. Wilson (1998). Integer Programming Approaches to Facilities Layout Models with Forbidden Areas. Annals of Operations Research. Vol. 81. 405-417. M. Kokoç, A.Aktepe, S.Ersöz, A.K. Türker (2016). A Model Proposal for Improving the Efficiency of Facility Layout in Emergency Service in Faculty of Medicine 3th International Conference on Advanced Technology & Sciences Proceedings.Pages.416-420.
This journal is © Advanced Technology & Science 2013