networks, like VGGNet [21], GoogLeNet [30] and ResNet. [31]. As it calculates the loss with cross entropy, it can promote strong CNN models. Intuitively, features ...
IMPROVING CONVOLUTIONAL NEURAL NETWORKS VIA COMPACTING FEATURES Liguo Zhou1,2, Rong Zhu1,2, Yimin Luo2,3, Siwen Liu1,2 and Zhongyuan Wang1,2 1
National Engineering Research Center for Multimedia Software, Computer School, Wuhan University, Wuhan, China 2 Collaborative Innovation Center for Geospatial Information Technology, Wuhan, China 3 Remote Sensing Information Engineering School, Wuhan University, Wuhan, China ABSTRACT
Convolutional neural networks (CNNs) have shown great advantages in computer vision fields, and loss functions are of great significance to their gradient descent algorithms. Softmax loss, a combination of cross-entropy loss and Softmax function, is the most commonly used one for CNNs. Hence, it can continuously increase the discernibility of sample features in classification tasks. Intuitively, to promote the discrimination of CNNs, the learned features are desirable when the inter-class separability and intra-class compactness are maximized simultaneously. Since Softmax loss hardly motivates this inter-class separability and intra-class compactness simultaneously and explicitly, we propose a new method to achieve this simultaneous maximization. This method minimizes the distance between features of homogeneous samples along with Softmax loss and thus improves CNNs’ performance on vision-related tasks. Experiments on both visual classification and face verification datasets validate the effectiveness and advantages of our method. Index Terms— Convolutional neural networks (CNNs), Softmax loss, joint supervision, visual classification, face verification 1. INTRODUCTION Currently, Deep Learning [1] becomes a promising research direction in computer vision field [2]-[6], as this technique is very powerful for learning data’s representation [7]. Compared to traditional shallow models of computational structures, Deep Learning models can automatically learn more abstract features [8], [9], and convolutional neural networks (CNNs) are a typical type of Deep Learning model [10], [11], and have been widely applied to both visual classification tasks [12]-[14] and face verification tasks [15], [16]. For a CNN model, loss function is of great significance to its establishment, because this function guides its gradient descent. In terms of visual classification and face verification, there are two typical loss functions: Softmax loss (crossentropy loss joint Softmax function) and Euclidean loss (mean squared error).
978-1-5386-4658-8/18/$31.00 ©2018 IEEE
Softmax loss originates from logistic regression [19] and is the most commonly used loss function for CNN-based networks, like VGGNet [21], GoogLeNet [30] and ResNet [31]. As it calculates the loss with cross entropy, it can promote strong CNN models. Intuitively, features are desirable when their intra-class compactness and inter-class separability are simultaneously maximized. Unfortunately, Softmax loss hardly motivates the compactness and separability of samples explicitly. Therefore, optimizations for better intra-class compactness is needed, and [20] proposed the Large-Margin Softmax loss (L-Softmax loss) for the sake of it. Despite its excellent theoretical improvement on the original Softmax loss, experimentally, this method does not outperform Softmax loss in terms of classification accuracy. Based on Euclidean loss, contrastive loss [17] is applied to Siamese networks which aim at learning a similarity measure from pairs of samples labeled as matching or non-matching, and triplet loss [18] is a variant of contrastive loss which aims at learning a margin between different classes by inputting a pair of homogeneous samples along with a non-homogeneous one. Despite the excellent discriminative capability of these two loss functions and their corresponding architectures, both of them are subjected to complex sample organization. Considering the drawbacks of above previous loss function, we propose a new method to improve CNNs’ performance. In this paper, we design a double-channel co-weighted network for homogeneous sample pairs only. This network achieves samples’ simultaneous maximization of their interclass separability and intra-class compactness by simultaneously minimizing Softmax loss and Euclidean loss between the features of homogeneous samples. As it optimizes Softmax loss and sample organization to a large extent, compared to other methods, it can not only achieve a higher classification accuracy but also avoid complex sample organization. Experiments on both visual classification datasets and a face verification dataset validate the effectiveness and advantages of our method, and the implementation of this paper is available at: https://github.com/zhouliguo/SCNet.
2946
2. THE PROPOSED METHOD
ICASSP 2018
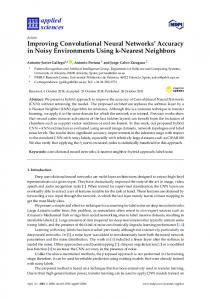
Figure 1. Dislocation matching process for the proposed method. Here, we design a double-channel co-weighted network for homogeneous sample pairs, which can simplify the process of sample organization to a large extent and establishes the mutual relationship between homogeneous samples. For this network, there are three components should be carefully illustrated: input (sample organization), architecture and loss function, we hence introduce it in above order next. 2.1. Sample Organization For contrastive loss and triplet loss, homogeneous samples and non-homogeneous samples should be carefully organized. Accordingly, the inputting quantity of sample is tremendous. Intuitively, there should be a mutual relationship between all samples in the dataset during CNNs’ training. For a dataset with N classes and M samples for each class, the inputting group number of contrastive loss SC is calculated as (1).
𝑆𝐶 =
𝑀(𝑀−1)𝑁 2
+
𝑀2 𝑁(𝑁−1) 2
(1)
Based on this dataset, the inputting group number of triplet loss ST is calculated as (2).
𝑆𝑇 =
𝑀2 (𝑀−1)𝑁(𝑁−1) 2
(2)
To relieve the surge of the inputting number of sample pairs, the contrastive tends to use a random pairing approach, triplet proposes both online and offline approaches of optimizing [18]. However, the former loses a lot of useful information and the latter complexes the sample organization. Despite the problems of pair selection, contrastive loss enlightens us to stimulate the similarity between samples from the same class, thus boosting Softmax loss. Hence, a new method of sample organization is developed to facilitate loss function for compacting features. As shown in Fig.1, a sample organization for our method is proposed to give CNNs feedbacks for the similarity between samples from the same class. Here, a dislocation processing is arranged for the image samples with the same label before pair matching. In that way, all image samples can efficiently find their partner of training, and the Euclidean loss can be obtained. Moreover, what is the main difference between ours and that of contrastive loss? Contrastive loss takes care of all samples from both same classes and different classes, but ours only deals with the pairs from same classes.
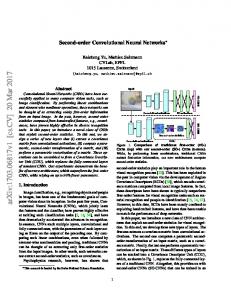
Figure 2. The architecture of our network for classification. (Two CNNs in dashed box share weight.) Therefore, back to the dataset with N classes and M samples for each one, our inputting group number S is calculated as (3). 𝑆 = 𝑀𝑁 (3) In contrast to the sample organizations of previous network, ours enjoys the simplest process and the least inputting which is equal to the number of total samples. 2.2. Architecture For samples from the same class, Euclidean distance can be used for measuring their similarity. Moreover, for samples from different classes, Softmax loss is needed to separate them out. Hence, a jointly supervised network architecture is proposed. How to develop an effective loss function to represent the above discriminative power? Particularly, for a pair of samples Ai and Ai+1 whose labels are both A, the process of their loss calculation is illustrated as Fig. 2. We design a double-channel co-weighted convolution neural network. It inputs two images belonging to the same class, and the upperlevel feature vectors of the two images are obtained after convolution and pooling layers. Based on the obtained vectors, their Euclidean distance loss are calculated, and one of the vectors will be mapped to the evidence vector for calculating Softmax loss. Finally, the loss function is the weighted sum of this Euclidean distance loss and Softmax loss. 2.3. Loss Function Softmax loss is a typical loss function for CNNs and can be illustrated as follows: The loss of the i-th input sample xi which belongs to label yi can be obtained by (4), and the
2947
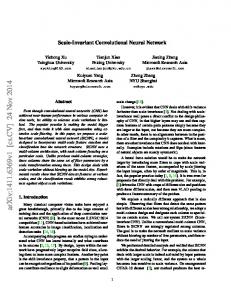
(a) Softmax Accuracy: 99.35%
(b) Ours (β=0.01) Accuracy: 99.55%
(c) Ours (β=0.1) Accuracy: 99.57%
(d) Ours (β=1) Accuracy: 99.66%
Figure 3. CNN-learned features visualization (Softmax Loss vs. our method when β is 0.01,0.1 and 1 in MNIST dataset. Specifically, we set the feature dimension as two and then plot them by class. Note that, the accuracy is the result of the network in Table I.) Softmax loss of the whole N samples can be obtained by averaging the loss of all input samples as (5). In (4), j represents number of the class, and Wyi is the i-th column of weight matrix. 𝑇
𝐿𝑖 = −𝑙𝑜𝑔(
𝑊 𝑥 𝑒 𝑦𝑖 𝑖 𝑇
𝑊 𝑥 ∑𝑗 𝑒 𝑗 𝑖
)
(4)
network, the loss function consists of two parts: the Euclidean loss between two homogeneous samples and the Softmax loss. Our loss function is formulated as (6). The β in it is a positive number for balancing two loss factors, and LE is calculated as (7). 𝐿 = 𝐿𝑆 + 𝛽𝐿𝐸 (6) 1
1
𝐿𝑆 = 𝑁 ∑𝑖 𝐿𝑖
(5)
2 𝐿𝐸 = 2𝑁 ∑𝑁 𝑖=1 ||𝑥𝑖 − 𝑥𝑖 ′||
(7)
Different loss functions are applied to various tasks and thus determine the architecture of CNNs. For the proposed
Supervised by both the Euclidean loss and Softmax loss, the intra-class compactness and inter-class separability of samples can be explicitly motivated.
TABLE I
3. EXPERIMENTS AND ANALYSIS
THE CNN ARCHITECTURE OF TESTS ON THERE DATASETS MNIST Layer
Conv ╳ 2
num_output kernel_size
Max pool1
Conv ╳ 2
32 5
╳
Max pool2
64 5 2
stride
1
pad
2
Layer
Conv ╳ 5
num_output
64
╳
2 5
2
╳
Conv ╳ 2
Max pool3
128 5 2
1
╳
2 5
2
╳
500
5 2
1
2
FC
╳
3.1. Visual Classification
2
2
In this part of experiments, we test our method on three wellknown datasets: MNIST [22], CIFAR-10 and CIFAR-100 [23].
2
CIFAR-10
kernel_size
3
╳
stride
1
pad
2
Max pool1
Conv ╳ 4
Max pool2
96 3 2
╳
2 3
2
╳
Conv ╳ 4
Max pool3
128 3 2
1
╳
2 3
2
╳
3 2
1
2
This section displays a comprehensive experiment report to our method. To verify the effectiveness of our method, we test it on two computer vision applications: visual classification and face verification.
╳
FC
TABLE II
256
THE CLASSIFICATION ACCURACY OF OUR METHOD
2
2
CIFAR-100 Layer
Conv ╳ 5
num_output
96
kernel_size
3
╳
stride
1
pad
2
Max pool1
Conv ╳ 4
Max pool2
192 3 2
╳
2
2 3
╳
1 2
3 2
Conv ╳ 4
Max pool3
384 ╳
2
2 3
╳
1
MNIST
CIFAR-10
CIFAR-100
Softmax
99.35%
90.51%
63.51%
L-Softmax (m=4)
99.39%
91.39%
65.96%
ML-DNN [26]
99.58%
91.88%
68.53%
Highway Network [27]
99.55%
92.40%
67.76%
Ours (β=0.01)
99.55%
92.18%
71.46%
Ours (β=0.1)
99.57%
92.40%
71.92%
Ours (β=1)
99.66%
92.27%
71.74%
2
3 2
FC 512
╳
2
2
2
2948
TABLE III
To further evaluate the learned features, we conduct a test on the LFW [29] database which collects 13233 face images from 5749 persons in unconstrained environments. We test 6000 face pairs and report the experimental results in Table III. Overall, based on the same outside data, the method visibly outperforms others and achieves the best results at 99.05%.
VERIFICATION PERFORMANCE ON LFW Method
Outside Data
Accuracy
Softmax
CASIA-WebFace [28]
96.53%
L-Softmax (m=4) [20]
CASIA-WebFace
98.71%
FaceNet [18]
CASIA-WebFace
98.70%
Ours (β=0.01)
CASIA-WebFace
97.25%
Ours (β=0.1)
CASIA-WebFace
99.05%
Ours (β=1)
CASIA-WebFace
98.45%
4. CONCLUSION
The MNIST is a handwritten digit database which has 60,000 training examples and 10,000 test examples in total. For its simple request for preprocessing and formatting, it has been widely used in experiments of pattern recognition and learning techniques. Moreover, the CIFAR-10 dataset consists of 60000 32 x 32 color images in 10 classes, with 6000 images per class. There are 50000 training examples and 10000 test examples. CIFAR-100 is quite similar with CIFAR-10, it has 100 classes containing 600 images for each class. There are 500 training images and 100 testing images per class. These 100 classes in the CIFAR-100 are grouped into 20 classes. For experiments on MNIST dataset, we set a batch size of 60. Meanwhile, we start with a learning rate of 0.01, and it is multiplied by 0.8 at the 5K and 8K iterations and terminates training at 10K iterations. Moreover, for experiments on the other two datasets, we set a batch size of 100. Meanwhile, we start with a learning rate of 0.01, and it is multiplied by 0.1 at the 50K and 80K iterations, and finally terminate training at 100K iterations. We implement the CNN model using the Caffe [24] library with the proposed loss function, and details of the CNN model architecture are given in Table I. There is a PReLU [25] layer behind every convolutional layer and fully connected layer. The classification results are compared in Table II. Our method shows an overwhelming advantage over others with the highest accuracy at 99.66% after 10,000 iterations based on MNIST dataset. For CIFAR-10 and CIFAR-100, similarly, ours enjoys the highest accuracy at 92.40% and 71.92% respectively. According to (6), the parameter β dominates the intra-class variations, and it is essential to CNN model. Hence, we make a further analysis on this parameter, different β lead to different deep feature distributions. As concluded in Table II, the results of MNIST and CIFAR come to the best when β is set to 1 and 0.1 respectively. In terms of the feature distributions for MNIST test dataset, as illustrated in Fig.3, our method achieves the best performance on simultaneous maximization of intra-class compactness and inter-class separability from a two-dimensional perspective after 10000 iterations. 3.2. Face Verification
Considering that Softmax loss hardly motivates the intraclass compactness and the inter-class separability of samples’ feature simultaneously. In this paper, we propose a new method to achieve this simultaneous maximization, and experiments on both visual classification datasets and a face verification dataset validate the effectiveness of our method. 5. ACKNOWLEDGMENTS The research was supported by National Natural Science Foundation of China (61671332, U1736206, 41771452, 41771454), Hubei Province Technological Innovation Major Project(2017AAA123) and the National Key Research and Development Program of China (2016YFE0202300). 6. REFERENCES [1] G.E. Hinton and R.R. Salakhutdinov, “Reducing the Dimensionality of Data with Neural Networks,” Science, vol. 313, no. 5786, pp. 504-507, July 2006. [2] H. Cecotti and A. Graser, “Convolutional Neural Networks for P300 Detection with Application to Brain-Computer Interfaces,” IEEE Transactions on Pattern Analysis and Machine Intelligence, vol. 33, no. 3, pp. 433-445, Mar 2011. [3] H. Zhou, G. Huang, Z. Lin, H. Wang and Y.C. Soh, “Stacked Extreme Learning Machines,” IEEE Transactions on Cybernetics, vol. 45, no. 9, pp. 2013-2025, 2015. [4] S. Ji, W. Xu, M. Yang and K. Yu, “3D Convolutional Neural Networks for Human Action Recognition,” IEEE Transactions on Pattern Analysis and Machine Intelligence, vol.35, no. 1, pp. 221-231, 2013. [5] L. Xu, C. Jiang, Y. Ren and H. Chen, “Microblog Dimensionality Reduction—A Deep Learning Approach,” IEEE Transactions on Knowledge and Data Engineering, vol. 28, no. 7, pp. 1779-1789, 2016. [6] J. Fan, W. Xu, Y. Wu and Y. Gong, “Human Tracking Using Convolutional Neural Networks,” IEEE Transactions on Neural Networks, vol. 21, no. 10, pp. 1610-1623, 2016. [7] L. Zhang, L. Zhang and B. Du, “Deep Learning for Remote Sensing Data: A Technical Tutorial on the State of the Art,” IEEE Geoscience and Remote Sensing Magazine, vol.4, no. 2, pp. 22-40, 2016. [8] H. Zhou, G. Huang, Z. Lin, H. Wang and Y.C. Soh, “Stacked Extreme Learning Machines,” IEEE Transactions on Cybernetics, vol. 45, no. 9, pp. 2013-2025, 2015. [9] F. Huang and Y. Lecun, “Large-scale Learning with SVM and Convolutional for Generic Object Categorization,” in Proc. CVPR, New York, NY, USA, 2006, pp. 284-291.
2949
[10]Y. LeCun, L. Bottou, Y. Bengio and P. Haffner, “Gradientbased learning applied to document recognition,” Proceedings of the IEEE, vol. 86, no. 11, pp. 2278-2324, Nov. 1998. [11]J. Schmidhuber, “Deep Learning in Neural Networks: An Overview,” Neural Networks, vol. 61, pp. 85-117, Jan. 2015. [12]B. Du, et al. “Stacked Convolutional Denoising AutoEncoders for Feature Representation,” IEEE Transactions on Cybernetics, vol. 47, no. 4, pp. 1017-1027, 2017. [13]K. He, X. Zhang, S. Ren and J. Sun, “Deep Residual Learning for Image Recognition,” in Proc. CVPR, Boston, USA, 2015, pp. 770-778. [14]K. He, X. Zhang, S. Ren and J. Sun, “Delving deep into rectifiers: Surpassing human-level performance on imagenet classification,” in Proc. CVPR, Boston, USA, 2015, pp. 1026-1034. [15]Y. Taigman, M. Yang, M. Ranzato, L. Wolf, “Lars. Deepface: Closing the gap to human-level performance in face verification,” in Proc. CVPR, Columbus, USA, 2014, pp. 1701-1708. [16]Y. Sun, Y. Chen, X. Wang, X. Tang, “Deep learning face representation by Joint Identification Verification,” in Proc. NIPS, Montreal, Canada, 2014, pp. 1988-1996. [17]S. Chopra, R. Hadsell and Y. LeCun, “Learning a Similarity Metric Discriminatively with Application to Face Verification,” in Proc. CVPR, San Diego, CA, USA, 2005, pp. 539-546. [18]F. Schroff, D. Kalenichenko and J. Philbin, “FaceNet: A Unified Embedding for Face Recognition and Clustering,” in Proc. CVPR, Boston, USA, 2015, pp. 815-823. [19]C.K. I. Williams and D.G. Barber, “Bayesian classification with Gaussian processes,” IEEE Transactions on Pattern Analysis and Machine Intelligence, vol. 20, no. 12, pp. 1342-1351, 1998. [20]W. Liu, Y. Wen, Z. Yu and M. Yang, “Large-Margin Softmax Loss for Convolutional Neural Networks,” in Proc. ICML, York City, NY, USA , 2016, pp. 507-516. [21]K. Simonyan and A. Zisserman, “Very deep convolutional networks for large-scale image recognition,” in Proc. ICLR., Santiago, USA, 2015 [22]Y. Lecun and C. Cortes, “The MNIST Database of Handwritten Digits,” http: //yann.lecun.com/exdb/mnist/index.html. 2006. [23]A. Krizhevsky. 2009. Learning Multiple Layers of Features from Tiny Images. [24]Y. Jia, et al. “Caffe: Convolutional architecture for fast feature embedding,” in Proc. the ACM International Conference on Multimedia, Orlando, USA, 2014, pp. 675678. [25]K. He, X. Zhang, S. Ren, and J. Sun. “Delving deep into rectifiers: Surpassing human-level performance on imagenet classification,” IEEE International Conference on Computer Vision (ICCV)., pp. 1026-1034, Santiago, USA, 2015. [26]C. Xu, C. Lu, X. Liang, et al. “Multi-Loss Regularized Deep Neural Network,” IEEE Transaction on Circuits & Systems for Video Technology, vol.26, no.12, pp. 2273-2283, 2016. [27]R.K. Srivastava, K. Greff, J. Schmidhuber, “Training Very Deep Networks,” Computer Science, 2015. [28]D. Yi, Z. Lei, et al. “Learning Face Representation from Scratch,” Computer Science, 2014
[29]G.B. Huang, M. Ramesh, T. Berg and E.L. Miller, “Labeled faces in the wild: A database for studying face recognition in unconstrained environments,” University of Massachusetts, Amherst. (USA) Technical Report, 2007, 07-49. [30]C. Szegedy, et al. “Going deeper with convolutions,” in Proc. CVPR, pp. 1-9, Boston, Massachusetts, USA, 2015. [31]K. He, X. Zhang, S. Ren, and J. Sun, “Deep residual learning for image recognition,” in Proc. CVPR, pp. 770-778, Boston, Massachusetts, USA, 2015.
2950