526
IEEE TRANSACTIONS ON PATTERN ANALYSIS AND MACHINE INTELLIGENCE, VOL. 19, NO. 5, MAY 1997
Improving Gil-Werman Algorithm for Running Min and Max Filters David Z. Gevorkian, Jaakko T. Astola, and Samvel M. Atourian Abstract—The current best bound on the number of comparison operations needed to compute the running maximum or minimum over a p-element sliding data window is approximately three comparisons per output sample [1], [2], [3], [4]. This bound is probabilistic for the algorithms in [2], [3], [4] and is derived for their complexities on the average for independent, identically distributed (i.i.d.) input signals (uniformly i.i.d., in the case of the algorithm in [2]). The worst-case complexities of these algorithms are O(p). The worst-case complexity
C1 = 3 - 4/p comparisons per output sample for 1D signals is achieved in the Gil-Werman algorithm [1]. In this correspondence we propose a modification of the Gil-Werman algorithm with the same worst-case complexity but with a lower average complexity. A theoretical analysis shows that using the proposed modification the complexities of sliding Max or Min 1D and 2D filters over i.i.d. signals are reduced to C1 = 2.5 2
2
- 3.5/p + 1/p and C2 = 5 - 7/p + 2/p comparisons per output sample on the average, respectively. Simulations confirm the theoretical results. Moreover, experiments show that even for highly correlated data, namely, for real images the behavior of the algorithm remains the same as for i.i.d. signals. Index Terms—Running min and max, morphological filters, algorithms, computational complexity.
———————— ✦ ————————
1 INTRODUCTION RUNNING Min and Max filters are useful in many signal and image processing applications. For example, the optimal L-filter (or linear combination of order statistics) for uniformly distributed noise is formed as the arithmetical mean of the running Min and Max filters [5]. Other examples are edge detection [6] in pattern analysis and adaptive signal processing [7] etc. The running Min and Max are the basic operations in the implementation of more complicated systems such as morphological (see [8], [9]) and general rank order based filters (see [10]). In such systems, the basic operation is repeated many times so that even small improvement in implementation of running Min and Max filters leads to significant computational savings. While numerous articles have been devoted to the implementation of general rank order based filters, few works consider their extreme case, the computation of running Min and Max for which implementations can be significantly simplified. In Pitas [2], two algorithms for computation of running Min and Max were proposed. The first of those uses a divide-and-conquer technique requiring for 1D signals C1 = O(log p) comparisons per output sample and O(p) memory locations, where p is the filter’s window length. (Note that the time complexity of 2D Max or Min filtering C2 is twice of the complexity C1 of 1D filtering.) The second ————————————————
• The authors are with the Signal Processing Laboratory, Tampere Univer-
method in [2], the so-called MAXLINE algorithm, uses O(p) memory locations and approximately three (C1 < 3) comparisons on the average per output sample for 1D uniformly distributed i.i.d. input signals. Recently, the MAXLIST algorithm was proposed in [3], [4] which also requires C1 < 3 comparisons on the average per output sample for i.i.d. input signals (not only uniformly distributed). It should be pointed that the complexity C1 = O(1) < 3 for both mentioned algorithms is the complexity on the average, whereas the complexity in the worst case is O(p). Moreover, during the filtering these algorithms require different number of comparisons (up to p + 1) for different locations of the filter’s sliding window. The complexity C1 = O(1) = 3 - 4/p in the worst case is achieved in Gil-Werman algorithm [1]. This complexity is “deterministic,” meaning that it remains the same for every kind of input signals. In this correspondence we propose a modification of the GilWerman algorithm which achieves the complexity on the average 2 C1 = 2.5 - 3.5/p + 1/p for i.i.d. signals. This result is obtained through both theoretical analysis and simulations. Although we do not find theoretical expression for the complexity of the proposed modification for correlated inputs, the experiments show that for real images, which can be considered as highly correlated 2D signals the complexity of the algorithm remains the same as for 2D i.i.d. signals. Thus approximately 16.6 percent of computational savings is achieved in the proposed modification compared to GilWerman algorithm.
2 THE GIL-WERMAN ALGORITHM In this section, for completeness reasons we present the GilWerman algorithm [1] for computation of 1D and 2D running Max and Min filters. In [1], 2D filters with a window of square shape with side p are considered, where, for convenience only, p is assumed to be odd, p = 2q + 1. Cases of even p can be considered similarly. Let A be an n ¥ n matrix, where n > p. Then, for all i, j satisfying q < i £ n - q and q < j £ n - q let Ai,j be the p ¥ p square submatrix of A centered in A[i, j]. An n ¥ n matrix B is called a Min or Max filter transform of A if B[i, j] equals, respectively, the min or max of the elements of Ai,j. (The boundary elements are treated as a special case or ignored.) Gil and Werman [1] present an algorithm for computing the filter transform for any semi-group operation (associative, binary), for example min, max or +, which takes only constant (3 - 4/p) number of comparisons on the average per output sample. Let ‡ be any semigroup operation. In order to calculate the p ¥ p filter, it suffices to compute row-by-row a 1D p filter and, on the resulting filtered image, a column-by-column 1D p filter. In order to compute 1D p filter B for a (2p - 1) ¥ 1 image a = a1 , a2 , K , a2 p - 1 , the following values are computed: Ri = ai ‡ ai + 1 ‡ K ‡ ap - 1 = ai ‡ Ri + 1 , 0 < i £ p - 1
(1)
S j = a p ‡ ap + 1 ‡ K ‡ ap + j = S j - 1 ‡ ap + j , 0 £ j £ p - 1
(2)
Then, the output B[k] of the 1D filter is Ru ‡ Sv , where u = (2k p + 1)/2 = k - q and v = (2k - p - 1)/2 = k - q + 1 (the cases where the index u or v is out of bounds are treated vacously). Thus, computation of p values requires O(p) = 3p - 4 comparison operations
sity of Technology, P. O. Box 553, FIN-33101, Tampere, Finland.
(p - 2 operations for computation of Ri and 2 ¥ (p - 1) operations
E-mail: {gevdav, jta, sam}@cs.tut.fi.
for computation of Sj and B[k]) or C1 = O(1) = 3 - 4/p on the average per output sample. Since in the 2D case the algorithm is re-
Manuscript received June 17, 1996; revised Jan. 27, 1997. Recommended for acceptance by S. Peleg. For information on obtaining reprints of this article, please send e-mail to:
[email protected], and reference IEEECS Log Number 104689.
peated twice, the complexity of 2D p ¥ p filter becomes C2 = 2C1 = 6 - 8/p.
0162-8828/97/$10.00 © 1997 IEEE
IEEE TRANSACTIONS ON PATTERN ANALYSIS AND MACHINE INTELLIGENCE, VOL. 19, NO. 5, MAY 1997
527
3 THE MODIFIED ALGORITHM
S0b g = x5
For descriptive simplicity we consider here the case of Max filter. The results are naturally adopted to the Min filter calculation. However, they are not extended to the case of any semigroup operation. Let xl¢, l = 1, 2, K , L be the input (1D) signal and let xl = xl¢- q , l = 1, 2, K , L + p - 1 be the input signal with appended
S1b
0
d c
h i
points, where x1¢ - r and xL¢ + r , r = 1, K , q q = p - 1 / 2 are arbitrarily defined (for example, x1¢ - r = x1¢ and xL¢ + r = xL¢ ). For convenience, we assume that p is a divisor of L and L1 = L/p. In order to compute all the outputs yl = max xl , xl + 1 , K , xl + p - 1 , l = 1, 2, K , L
{
}
2
5
6
7
0 3
5
6
7
8
0 4
5
6
7
8
k a = ab g
or atb
k
g
=
e
k k ab g , K , ab g
2 p -1
1
j = ex
kp + 1 , x kp + 2 ,
K , xb k + 2 g p - 1
g
k
k
g
k
2
7
8
1 3
8
9
9
m r = maxmx , x , x r b g S = maxmx , x , x , x r Sb g = maxmx , K , x r y = max{Rb g , Sb g } y = max{Rb g , Sb g } y = max{Rb g , Sb g } y = max{Rb g , Sb g }
(3)
}
(4)
k
}
Now one can notice that there is an overlap between Rib
(5) k
g
and
at the kth iteration using an information
obtained at the (k - 1)st iteration when calculating Sbj
g . The idea
k -1
2
10
11
12
1 3
10
11
12
1 4
10
6
1 1
1 0
7
1 2
1 1
8
1 3
1 2
9
1 4
1 3
13
14
1
k -1
algorithm (in order to reduce the computational complexity) consists of exploiting this overlap to save comparison operations
1 Sb g
y10 = S4b g
Spb - 1 g k = 1, K , L1 - 1 . The idea of the modification of Gil-Werman
g
g
1
y kp + m = max Rmb g , Smb -g 1 , 0 < m £ p - 1, yb k + 1g p = Smb g .
k
0 3
S1b g = max x10 , x11
are formed and then outputs ykp+1, ykp+2, ..., y(k+1)p are found according to the rules:
when calculating Rib
0 4
1
}
k
4
S0b g = x10
}
{
k
0 2
1
max xb k + 1g p , xb k + 1g p + 1 , K , xb k + 1g p + j , 0 £ j £ p - 1
{
0 3
m r = maxmx , x , x r b g R = maxmx , x r
= max apb g , K , apb +gj = k
3
1 Rb g
}
{
0 1
R4b g = x9
{
k
0 2
1
j
max xkp + i , xkp + i + 1 , K , xb k + 1g p - 1 , 0 < i £ p - 1 Sbj
2
R1b g = max x6 , x7 , x8 , x9
= max aib g , K , apb -g1 =
{
0 0
9
At the first iteration (k = 1) the set of inputs x6, x7, ..., x14 is considered and the following values are computed:
tion (k = 0, 1, ..., L1 - 1) the values k
0 1
0
= xkp + t , t = 1, 2, K , 2 p - 1 . In other words, at the kth itera-
Rib
1
y5 = S4b
j
values of Ri and Sj for different sequences a = a1 , K , a2 p - 1 . At the kth iteration (k = 0, 1, ..., L1 - 1) a set of p outputs ykp+1, ykp+2, ..., y(k+1)p is computed using (1), (2), where
= max x5 , x6
0 Sb g
one has to apply L1 times the algorithm of (1), (2) computing the
e
g
m r = maxmx , x , x r b g S = maxmx , x , x , x r Sb g = maxmx , x , x , x , x r y = max{Rb g , Sb g } y = max{Rb g , Sb g } y = max{Rb g , Sb g } y = max{Rb g , Sb g } 0
Now if, for instance, S4b g = x9 , then none of the values of 0
Rib g , i = 1, K , 4 , needs to be computed since we already know 1
that they are all equal to x9. We also do not need to compute any of
the values Rib g , i = 1, K , 4 in the case when S4b g = x8 . In the case 1
0
is best demonstrated in the following example.
where S4b g = x7 , we have to compute only the value of R3b g but do
EXAMPLE 1. Consider the case p = 5. The inputs x1, x2, ..., x9 are
not need to compute the values of R2b g and R1b g . Only in the case
considered, and the following values are computed at the 0th iteration (k = 0): R1b g = max x1 , x2 , x3 , x4
m r b g R = maxmx , x , x r Rb g = maxmx , x r 0
0 2
2
3
0 3
3
4
R4b g = x 4 0
0
1
1
0 S4b g = x5 , 1g b R , i = 1, K , 4 .
where
1
we have to compute all the values of
i
Formally, if for a given k, k =1, ..., L1 - 1, Spb - 1 g = max xkp , K , xkp + j * , K , xb k + 1g p - 1 = xkp + j * k -1
4
{
}
(6)
for some j*, (1 £ j* £ p - 1), then Rib
k
g
=
m
r
max xkp + i , K , xkp + j * , K , xb k + 1g p - 1 = xkp + j * "i Π1, K , j *
{
}
(7)
528
IEEE TRANSACTIONS ON PATTERN ANALYSIS AND MACHINE INTELLIGENCE, VOL. 19, NO. 5, MAY 1997
This is because xkp + j * Π5 ib
k
g
à 6pb - 1
g
k -1
the largest element in 6pb - 1 g . Here 5 ib k -1
for i Π{1, ..., j*} and xkp + j * is k
g
and 6pb - 1 g are the sets over k -1
which Rib g and Spb - 1 g are maxima, respectively (see (6) and (7)). k -1
k
Note that no additional operations are needed to find the index j* in (6) since it can be found in the process of computing the values Sbj
g,
k -1
j = 0, 1, K , p - 1 . To do this we introduce a place-
marker g. When computing Sbj
g,
k -1
we set g = 0 at the beginning
and then for every j = 1, ..., p - 1, we set g = j if Sbj
g
k -1
= max Sbj - 1 g , xkp + j = xkp + j , and we do not change the value k -1
{
}
of g otherwise (i.e., if Sbj Sbj
g , j = 0, 1, K ,
k -1
g
k -1
= Sbj - 1 g ). After all the values k -1
p - 1 have been computed, we have g = j*.
Now one can see that the Gil-Werman algorithm can be modified so that at the kth iteration, k = 0, ..., L1 - 1, the following values are computed (in the beginning of the algorithm we set g = 0): k k
Rib
g
k
g
the input signal xk, k = 0, ..., L + p - 1 is drawn independently from a probability distribution that has no discrete point masses. In that case, each of the p samples can be the maximum with the probability 1/p, i.e., j* is uniformly distributed over the set {0, 1, ..., p 1} and the probability that j* will take the value j is equal to Pr(j* = j) = 1/p for j Π{0, ..., p - 1} and Pr(j* = j) = 0 otherwise. Combining this with (11) we obtain the following distribution for the number of comparisons required to obtain p outputs of the 1D Max or Min filter applied to an i.i.d. signal: 1 bpg (12) Pr C1 = 3 p - j - 4 = , for j = 0, 1, K , p - 3 p
FH
= max xkp + i , Rib+ 1g k
{
}
= Spb - 1 g , k -1
i = p - 2 , p - 3, K , g + 1
(8)
0 x(k+1)p+j for every k = 0, ..., L1 - 1, j = 1, 2, ..., p - 1 and given p. Likely, the only real such a case is a strictly decreasing input signal. In all other cases there are computational savings compared to Gil-Werman algorithm. Note that the worst case complexity of MAXLINE [2] or MAXLIST [3], [4] algorithms is p - 1 comparisons per output sample. To verify the obtained results, we investigated the complexity of the proposed algorithm through simulations. Simulations con1 ducted in the MATLAB environment. As the model of 1D i.i.d. 1. MATLAB is trademark of MathWorks, Inc.
IEEE TRANSACTIONS ON PATTERN ANALYSIS AND MACHINE INTELLIGENCE, VOL. 19, NO. 5, MAY 1997
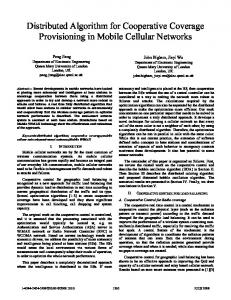
signals we used uniformly distributed and Gaussian random sequences of various lengths (10,000 up to 100,000) which were generated using MATLAB’s rand() and randn() functions. These sequences were filtered for range of window sizes (2, 3, ..., 100) with the proposed algorithm, with Gil-Werman algorithm and also, for verification of the results, using MATLAB’s standard max() function. Each experiment was repeated up to 10 times. In every case, for both uniformly distributed and white Gaussian noise distributed input signals as well as for different lengths of input signals, the results were very similar. Fig. 1 demonstrates the average number of comparisons per output sample versus window length for the Gil-Werman algorithm and for the proposed algorithm when the input signal is the white Gaussian sequence of the length L = 100,000. The function given by (15) is also plotted for comparison. From this plot we see excellent agreement between theory and simulation. The dot line corresponding to the analytical result of (15) and the solid line corresponding to the simulation results are, practically, indistinguishable.
529
scribed by (16). Thus, although we do not find theoretical expression for the complexity of the proposed algorithm for correlated inputs, the simulations show that for real images the complexity of the algorithm remains the same as for 2D i.i.d. signals.
Fig. 3. Average number of comparisons per output sample E(C2) vs. window length for image “Car.”
5 CONCLUSION It was shown that the complexity of running Min and Max computations can be reduced from the current best bound of C1 = 2 3 - 4/p comparisons per output sample to C1 = 2.5 - 3.5/p + 1/p for 1D i.i.d. signals. Simulations proved this bound to be very exact. Experiments also showed that even for correlated input data such as images the complexity of the proposed algorithm remains the same as for i.i.d. data.
ACKNOWLEDGMENTS Fig. 1. Average number of comparisons per output sample vs. window length for 1D i.i.d signals.
The authors wish to express their gratitude to the anonymous reviewers for their comments.
REFERENCES [1]
Fig. 2. Average number of comparisons per output sample E(C2) vs. window length for image “Lena.”
In the second series of experiments, we investigated the behavior of the proposed algorithm on real images, which can be considered as highly correlated 2D signals. Several images were tried. In every case, results were very similar to each other. As an example we present in Fig. 2 and Fig. 3 the results of the experiment on images “Lena” and “Car,” respectively. Plots on these figures show the complexity of Gil-Werman algorithm, the complexity of the proposed algorithm, and the function given by (16). From these plots we can notice that the complexity of the proposed algorithm obtained via simulation can be, practically, de-
J. Gil and M. Werman, “Computing 2-D Min, Median, and Max Filters,” IEEE Trans. Pattern Analysis and Machine Intelligence, vol. 15, no. 5, pp. 504-507, May 1993. [2] I. Pitas, “Fast Algorithms for Running Ordering and Max/Min Calculation,” IEEE Trans. Circuits and Systems, vol. 36, no. 6, pp. 795-804, June 1989. [3] S. Douglas, “An Efficient Algorithm for Running Max/Min Calculation,” Proc. IEEE Int’l Symp. Circuits and Systems, ISCAS’96, vol. 2, pp. 5-8, May 12-15, 1996, Atlanta, Ga. [4] S. Douglas, “Running Max/Min Calculation Using a Pruned Ordered List,” IEEE Trans. Signal Processing, vol. 44, no. 11, pp. 2,872-2,877, Nov. 1996. [5] A. Bovik, T.S. Huang, and D.C. Munson, Jr., “A Generalization of Median Filtering Using Linear Combinations of Order Statistics,” IEEE Trans. Acoustics, Speech and Signal Processing, vol. 31, no. 6, pp. 1,342-1,350, Dec. 1983. [6] M. Vemis, G. Economou, S. Fotopoulos, and A. Khodyrev, “The Use of Boolean Functions and Logical Operations for Edge Detection in Images,” Signal Processing, vol. 45, pp. 161-172, 1995. [7] S.C. Douglas, “A Family of Normalized LMS Algorithms,” IEEE Trans. Signal Proc. Lett., vol. 1, no. 3, pp. 49-51, Mar. 1994. [8] J. Serra, Image Analysis and Mathematical Morphology. New York: Academic Press, 1982. [9] M. Werman and S. Peleg, “Min Max Operators in Texture Analysis,” IEEE Trans. Pattern Analysis and Machine Intelligence, vol. 7, no. 11, pp. 730-733, Nov. 1985. [10] A.R. Butz, “Systolic Computation of the Running Min and Max,” Electronic Letters, vol. 29, no. 17, pp. 1,547-1,548, Aug. 19, 1993.