Improving Physiological Signal Classification Using Logarithmic Quantization and a Progressive Calibration Technique Nick Merrill1 , Thomas Maillart1 , Benjamin Johnson2 and John Chuang1 1 School
of Information, UC Berkeley, Berkeley, California, USA Carnegie Mellon University, Pittsburgh, Pennsylvania USA
[email protected], {maillart, chuang}@ischool.berkeley.edu,
[email protected] 2 Cylab,
Keywords:
bio-signal processing, signal quantization, logarithmic binning, calibration, mobile physiological computing
Abstract:
This paper exhibits two methods for decreasing the time associated with training a machine learning classifier on biometric signals. Using electroencephalography (EEG) data obtained from a consumer-grade headset with a single electrode, we show that these methods produce significant gains in the computational performance and calibration time of a simple brain-computer interface (BCI) without significantly decreasing accuracy. We discuss the relevance of reduced feature vector size to the design of physiological computing applications.
1
INTRODUCTION
Bio-signals vary widely between individuals, and their expression often changes within individuals over time. Typically, brain computer interfaces (BCI) serve as an excellent example of this phenomenon. Regular calibration and re-calibration are critical to achieving decent BCI accuracy (Dornhege, 2007; McFarland and Wolpaw, 2011). Supervised learning algorithms have assisted systems in adapting to users’ personal physiology after a calibration period. In BCI, this approach has yielded proof-of-concept systems ranging from braincontrolled keyboards and wheelchairs to prosthetic arms and hands (Blankertz et al., 2007; Millan et al., 2010; D. Mattia, 2011; Hill et al., 2014; Campbell et al., 2010). However, in order to move BCI into broader consumer markets, systems must work with more mobile sensing equipment and wearable computing platforms. Mobile device architectures limit computational complexity relative to lab-based systems, and ergonomic considerations limit the number and quality of sensors on the device. In this study, we simulate a simple brain-computer interface using signals acquired from a low-cost, mobile electroencephalograph (EEG) device with a single electrode. Using a BCI that takes mental gestures as input, we investigate how the processing of biosignals and the strategy for user calibration can impact the computational performance, reliability and calibration time of a physiological signal classifica-
tion system. First, we present a novel signal quantization technique in which we apply logarithmic binning to power spectrum data from an EEG electrode. We find that this technique can speed up the computational performance of a classification-based BCI by 450% without significant detriment to the system’s accuracy. Second, we combine this technique with a progressive user calibration strategy, in which candidate mental gestures are tested in an order designed to minimize calibration time. We calibrate 86.6% of users to a threshold of BCI literacy (75% accuracy) (Vidaurre and Blankertz, 2010) with under five minutes of training data, and 100% of users within half an hour. This paper is organized as follows. We introduce relevant background research in Section 2. We present the power spectrum quantization method in Section 3, and the data used for calibration in Section 4. We then evaluate the quantization method (Section 5), and we present a time-efficient calibration strategy for our BCI apparatus (Section 6). We conclude with limitations and future research directions.
2 2.1
RELATED WORK Calibrating EEG-based BCI
Generally, BCI systems aim to recognize a user’s mental gestures as one of a finite set of discrete symbols, a problem that can be framed as a pattern recog-
nition task (Lotte et al., 2007). The difficulty of this task stems primarily from the variable and nonstationary nature of neural signals: the symbols are expressed differently between individuals, and even vary within individuals based on mood, stress, and other factors (Vidaurre et al., 2011). In order to compensate for variability in BCI signals, recent work has leveraged adaptive classification algorithms to distinguish between mental gestures (Lotte et al., 2007; Vidaurre et al., 2011; Friedrich et al., 2013). Automated calibration procedures have turned BCI novices into competent users over the course of hours instead of days or weeks, and without manual calibration (Vidaurre et al., 2011). During calibration, users perform labeled (i.e. known) mental gestures in order to produce samples for the classifier.
2.2
Statistical Signal Processing in EEG-based BCI
To account for the nonstationarity of EEG signals and the need for regular calibration, recent work has leveraged machine learning algorithms capable of adapting to their inputs. Support vector machines (SVM) are a set of supervised machine learning methods that take labeled example data to create a model. This model can be used to predict the classes of unlabeled data. SVMs use a hyperplane (an n-dimensional construct in an n+1 dimensional space) to draw discriminatory boundaries between classes. Past work has used linear SVMs in BCI applications (Garrett et al., 2003; Grierson and Kiefer, 2011). SVMs select the hyperplane that maximizes distance from the nearest training points, which has been shown to increase the model’s generalizability (Burges, 1998). SVMs suffer from a property known as “the curse of dimensionality”: larger feature vectors require an exponential increase in the amount of data needed to describe classes (Jain et al., 2000). Traditionally, BCI applications rely on dense, high-dimensional feature vectors produced by multi-electrode scanning caps with high temporal resolution (Lotte et al., 2007), which threatens the responsiveness of BCI from a user experience standpoint and places high requirements on end-user hardware.
2.3
Brain-Computer Interface “in the Wild”
Recent years have seen the emergence of a consumer market for inexpensive, mobile EEG devices. Compared to medical-grade scanning devices, these headsets have significantly fewer electrodes and there-
fore much lower spatial resolution. Most of them employ dry contact electrodes, which produce noisier signals (De Vos and Debener, 2014). Nonetheless, researchers have demonstrated several mobileready BCI systems that use these devices to detect emotional states, event-related potentials (ERP), and demonstrate the feasibility of brainwave-based biometric authentication (Crowley et al., 2010; Grierson and Kiefer, 2011; Chuang et al., 2013; Johnson et al., 2014). However, the use of consumer EEGs for the direct, real-time control of software interfaces has proven more difficult, as the number of electrodes on these headsets limit the spatial resolution required to discriminate between mental gestures (Carrino et al., 2012; Larsen and Hokl, 2011). Even with improvements over successive generations of consumer-grade EEG devices, the signal from these devices will remain noisier than professional scanning devices, as users will be wearing and using them in everyday settings, with ambient electromagnetic signals interfering with endogenous bio-signals.
3
SIGNAL QUANTIZATION FOR RAPID CLASSIFICATION
Our objective is to maximize the accuracy of the classifier while minimizing its computational expense. One way to reduce the computational requirements of a classifier is to reduce the size of the feature vectors on which it is trained and tested. We propose a signal quantization method that allows us to directly adjust the size of feature vectors. Since vector size directly impacts the runtime of the classifier, this technique operationalizes the tradeoff between computational speed and accuracy. We average the power spectrum time series in the temporal dimension and compute a discrete probability density function (pdf) from the resulting power spectrum in which each component is the mean of its corresponding frequency components through time. This results in a discrete pdf with 1024 components for each trial, which can be quantized as described in the following section.
3.1
Logarithmic Binning
Since EEG activity is associated with frequencies from 1-40Hz, it is generally presumed that this range contains the majority of relevant signal. However, this frequency range can be polluted with non-neural signals (Ball et al., 2009), and we do not rule out the possibility that useful signal exists outside this frequency
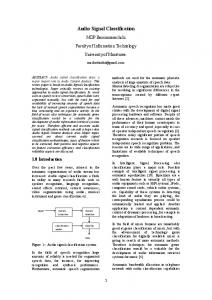
range as well. Muscular activity, for example, might be correlated with mental gestures in some cases. In order to exploit the entire frequency spectrum while preserving our bias toward known sources of useful signal, we select log-spaced data bins through the logarithm of the frequency range. Figure 1 shows an example of logarithmic binning with 65 bins. The original, 1024-point pdf is compressed more than 10 times, but its original structure is well-preserved. Data binning offers a simple way to quantize the information contained in the full signal. By taking the mean of several adjacent points in the pdf, we are left with a single bin that represents the local area of spectrum. For example, four contiguous frequencies (1Hz, 1.25Hz, 1.5Hz, 1.75Hz) of the values (4, 4, 5, 5) average into a single bin with the value 4.5. The number of bins can be adjusted to produce feature vectors of different sizes. This vector, which highlights the statistical properties of the power spectrum for each mental task, can be used as an input of variable size to the classifier.
lying C implementation boasts among the fastest train- and test-time performance among state-of-theart solutions (Fan et al., 2008). We use a hyperparameter of 100, found through a grid-search of a randomly-selected sample of our dataset. We use scikit-learn’s built-in cross-validation toolkit, which performs seven cross-validation steps utilizing different splits of data in each round. Out of the seven mental gestures in the dataset, we want to identify and select, for each individual subject, the two gestures (or classes) that we can most reliably differentiate from one another. This results in a personalized, binary classifier, where the SVM can discriminate between two mental gestures performed by the subject with the highest classification accuracy. The gesture pairs may vary from subject to subject. For example, one subject’s best-case pair may be song and sport while another’s may be color and finger. Subjects can then select one of two options by performing one of the mental gestures in their gesture pair.
5
4
log10(pdf)
0 −5 −10 −15 −20 −1.0
−0.5
0.0
1.5 0.5 1.0 log10(Frequency)
2.0
2.5
Figure 1: In double logarithmic scale, the original 1024 bins (blue dots) of the probability density function (pdf) obtained from averaging the n power spectra of one recording, and the resulting quantized pdf with a resolution of 65 log-bins (red). The quantized pdf preserves very well the structure of the original, 1024-point pdf.
3.2
Binary BCI Classifier
To test the performance of the quantization method, we build a binary BCI using a support vector machine (SVM) classifier, which we train individually on each subject’s recordings while varying the bin size. We use LinearSVC (Fan et al., 2008), a wrapper for LibLinear exposed in Python through the scikitlearn library (Pedregosa et al., 2011). We chose LinearSVC because BCI classification problems are generally presumed to be linear (Garrett et al., 2003; Lotte et al., 2007), and because LibLinear’s under-
DATA
We obtained an anonymized dataset of EEG recordings from 15 subjects, all students at UC Berkeley, performing seven mental gestures in a sitting position over two sessions (Chuang et al., 2013). The signals were recorded using a consumer-grade EEG headset, the Neurosky MindSet, with a dry contact EEG sensor over the Fp1 position. The power spectrum time series data were recorded using the Neuroview Software. Participants performed each of the seven mental gestures ten times. Each of the ten trials lasted ten seconds. The seven mental gestures were: (i) breathing with eyes closed; (ii) motor imagery of right index finger movement; (iii) motor imagery of subject’s choice of repetitive sports motion; (iv) mentally sing a song or recite a passage; (v) listen for an audio tone with eyes closed; (vi) visual counting of rectangles of a chosen color on a computer screen; and (vii) any mental thought of subject’s choice (Chuang et al., 2013). The power spectrum time series data consists of one power spectrum every 0.5 seconds. Therefore, for a 10 second recording, we have a sequence of 20 power spectra. Each power spectrum contains frequency components from 0 Hz to 256 Hz at 0.25Hz intervals, so 1024 values are reported for each power spectrum. The dataset was further cleaned by removing all readings marked as having suboptimal signal quality by the Neuroview Software. The Neuroview Software
delivers a signal quality value that is greater than zero when signal quality is suboptimal. Factors causing this value to be greater than zero include lack of contact between the electrode and skin, excessive nonEEG noise (e.g., EKG, EMG, EOG, electrostatic), and excessive motion. At this point, each of the seven mental gesture is represented by ten trials, each trial consisting of a time series of 20 power spectra. 1024 frequency readings comprise each power spectrum.
5
increase in variance in the data, possibly due to variability in memory read and write times, which exacerbates SVM training time at larger vector sizes (as more reads and writes are being performed). Combining these two results, Figure 4 confirms the tradeoff between classifier accuracy and classifier training time. It also points to the existence of a threshold resolution at around 50 bins that provides a 450% speed improvement over a non-quantized baseline of 1024 bins without a significant detriment to classifier accuracy.
EFFECT OF QUANTIZATION ON CLASSIFIER SPEED AND ACCURACY
We hypothesize that both SVM training time and accuracy increase with number of bins, i.e., the higher the signal resolution, the higher the accuracy but the longer the training time. In order to make an optimal binary BCI for each subject, we must find the two gestures that the SVM distinguishes most reliably. For each subject, we generate every pair of two mental gestures and crossvalidate our SVM on the recordings for this pair. Given seven candidate gestures, we have a total of 21 possible gesture pairs. For every pair processed, we record mean classification accuracy across all rounds of cross-validation. We record the best-performing gesture pair for each subject, which yields the optimal pair for the binary BCI. We perform this process multiple times, varying the signal resolution by varying the number of bins from 1 to 1024. As an additional performance audit, we measure the time needed to fit an SVM to the data for two randomly selected gesture pairs across all subjects. We repeat this process ten thousand times at different resolutions, collecting the minimum time observed in each series of attempts. Figure 2 shows the mean best-case accuracy of the classifier versus the number of bins. We can see that the accuracy level remains above 90% even as we reduce the number of bins to 50. Although classifier accuracy is positively correlated with signal resolution (slope = 0.0013, R-squared = 0.773, p