www.nature.com/scientificreports
OPEN
received: 04 March 2015 accepted: 19 May 2015 Published: 22 June 2015
Improving prediction of secondary structure, local backbone angles, and solvent accessible surface area of proteins by iterative deep learning Rhys Heffernan1, Kuldip Paliwal1, James Lyons1, Abdollah Dehzangi1,2, Alok Sharma2,3, Jihua Wang4, Abdul Sattar2,5, Yuedong Yang6 & Yaoqi Zhou4,6 Direct prediction of protein structure from sequence is a challenging problem. An effective approach is to break it up into independent sub-problems. These sub-problems such as prediction of protein secondary structure can then be solved independently. In a previous study, we found that an iterative use of predicted secondary structure and backbone torsion angles can further improve secondary structure and torsion angle prediction. In this study, we expand the iterative features to include solvent accessible surface area and backbone angles and dihedrals based on Cα atoms. By using a deep learning neural network in three iterations, we achieved 82% accuracy for secondary structure prediction, 0.76 for the correlation coefficient between predicted and actual solvent accessible surface area, 19° and 30° for mean absolute errors of backbone ϕ and ψ angles, respectively, and 8° and 32° for mean absolute errors of Cα-based θ and τ angles, respectively, for an independent test dataset of 1199 proteins. The accuracy of the method is slightly lower for 72 CASP 11 targets but much higher than those of model structures from current state-of-the-art techniques. This suggests the potentially beneficial use of these predicted properties for model assessment and ranking.
Three-dimensional structures for most proteins are determined by their one-dimensional sequences of amino acid residues. How to predict three-dimensional structures from one-dimensional sequences has been an unsolved problem for the last half century1. This problem is challenging because it demands an efficient technique to search in astronomically large conformational space and a highly accurate energy function to rank and guide the conformational search, both of which are not yet available2. As a result, it is necessary to divide the structure prediction problem into many smaller problems with the hope that solving smaller problems will ultimately lead to the solution of the big problem. One of those smaller or sub-problems is the prediction of one-dimensional structural properties of proteins from their sequences. The most commonly predicted one-dimensional structural property of a protein is secondary structure. Secondary structure describes each amino residue in a number of discrete states3 for which three state description (helix, sheet and coil) is the most common. In recent years, there 1
Signal Processing Laboratory, School of Engineering, Griffith University, Brisbane, Australia. 2Institute for Integrated and Intelligent Systems, Griffith University, Brisbane, Australia. 3School of Engineering and Physics, University of the South Pacific, Private Mail Bag, Laucala Campus, Suva, Fiji. 4Shandong Provincial Key Laboratory of Functional Macromolecular Biophysics, Dezhou University, Dezhou, Shandong, China. 5National ICT Australia (NICTA), Brisbane, Australia. 6Institute for Glycomics and School of Information and Communication Technique, Griffith University, Parklands Dr. Southport, QLD 4222, Australia. Correspondence and requests for materials should be addressed to Y.Y. (email:
[email protected]) or Y.Z. (email:
[email protected]) Scientific Reports | 5:11476 | DOI: 10.1038/srep11476
1
www.nature.com/scientificreports/ has been a slow but steady improvement of secondary structure prediction to above 81% when homologous sequences are not utilised for training (ab initio prediction)4,5. The steady improvement is due to a combination of improved machine-learning algorithms, improved features and larger training datasets. Other methods have also been developed to go beyond 81% by including homologous sequences in training6–9. Secondary structure directly predicted from sequence was shown more accurate than secondary structure of the models predicted by protein structure prediction techniques for template-free modelling targets in critical assessment of structure prediction (CASP 9)4. Secondary structure, however, is a coarse-grained description of local backbone structure because ideal helical and strand conformations do not exist in protein structures and the boundary between coil states and helical/strand states is not well defined10. This leads to development of backbone torsion angle prediction (φ and ψ ) in discontinuous11,12 and in real, continuous values13–15. More recently, a method for predicting angles based on Cα atoms (the angle between Cα i−1− Cα i− Cα i+1 (θ ) and a dihedral angle rotated about the Cα i− Cα i+1 bond (τ)) was also developed16. These local structure descriptors are complementary with each other because torsion angles (φ and ψ ), Cα − atom based angles (θ and τ), and secondary structure involve amino acid residues at different sequence separation: neighbouring residues for φ and ψ , 3–4 residues for θ and τ, and 4 for 310 helix, 5 for α -helix, and an undefined number of residues for sheet residues. Another important one-dimensional structure property is solvent Accessible Surface Area (ASA). ASA measures the level of exposure of an amino acid residue to solvent (water) in a protein. This is an important structural property as active sites of proteins are often located on their surfaces. Multistate prediction of earlier methods17–19 have been replaced by continuous real value prediction14,20–23. One interesting observation is that predicted secondary structure is often utilized to predict other one-dimensional structural properties but rarely the other way around. Several studies, however, indicated that other predicted structural properties can be utilized to improve secondary structure prediction such as predicted torsion angles4,13 and predicted solvent accessible surface area24. In particular, we have shown that the accuracy of secondary structure and torsion angle prediction can be substantially improved by iteratively adding improved prediction of torsion angles and secondary structure4. Artificial neural networks have been widely employed in predicting structural properties of proteins due to the availability of large datasets25. Deep neural networks26, referring to artificial neural networks with more than two hidden layers, have been explored in prediction of local and nonlocal structural properties of proteins27–30. For example, Qi et al.29 developed a unified multi-task, local-structure predictor of proteins using deep neural networks as a classifier. They trained a single neural network using sequential and evolutionary features to predict a number of protein properties including protein secondary structure and solvent accessibility. Spencer et al.30 developed an iterative deep neural network for protein secondary structure prediction. The method utilized one deep neural network to predict secondary structure by using physicochemical and evolutionary information in their first step and another deep neural network to predict their final secondary structure prediction based on predicted secondary structures in addition to the same input used in the first step. These methods achieved secondary structure prediction with accuracy that is slightly higher than 80%. The goal of this paper is to develop an iterative method that predicts four different sets of structural properties: secondary structure, torsion angles, Cα − atom based angles and dihedral angles, and solvent accessible surface area. That is, both local and nonlocal structural information were utilized in iterations. At each iteration, a deep-learning neural network is employed to predict a structural property based on structural properties predicted in the previous iteration. We showed that all structural properties can be improved during the iteration process. The resulting method provides state-of-the-art, all-in-one accurate prediction of local structure and solvent accessible surface area. The method (named SPIDER2) is available as an on-line server at http://sparks-lab.org.
Methods
This section describes the dataset employed and parametric details of the algorithm used as follows:
Datasets. We employed the same training and independent test datasets developed for the prediction of Cα based angles (θ ) and dihedral angles (τ)16. Briefly, a non-redundant (25% cutoff), high resolution ( 30% sequence identities between each other and to the training and test sets (TR4590 and TS1199), we obtained a set of 72 proteins (CASP11) out of original 99 proteins. This set contains 17382 amino acid residues. A list of 72 proteins is provided in the Supplementary material. Deep neural-network learning. Here, we employed the same deep learning neural network as we
have employed for prediction of Cα -based θ and τ angles prediction by SPIDER16. Briefly, the deep artificial Neural Network (ANN) consists of three hidden layers, each with 150 nodes. Input data was normalized to the range of 0 to 1. Weights for each layer were initialized in a greedy layer-wise manner, Scientific Reports | 5:11476 | DOI: 10.1038/srep11476
2
www.nature.com/scientificreports/
Figure 1. The general architecture of the parallel multi-step iterative algorithm. Black arrows indicate that position-specific scoring matrix (PSSM) and physical chemical properties (PP) are presented as input in every neural network predictor. There is no connection between each network.
using stacked sparse auto-encoders which map the layer’s inputs back to themselves32 and refined using standard backward propagation. The learning rate for auto encoder stage was 0.05 and the number of epochs in auto encoder stage was 10. The learning rates for backward propagation were 1, 0.5, 0.2, and 0.05, respectively, with 30 epochs at each learning rate. In this study, we used the deep neural network MATLAB toolbox, implemented by Palm33. Linear activation function was used for the hidden layers of auto encoder training whereas sigmoid activation function was employed at the stage of back propagation. All these hyper parameters were obtained by a few initial studies of a single fold (90% for training and 10% for test), randomly selected from the training TR4590 dataset.
Parallel multi-step iterative algorithm. Figure 1 shows the parallel, multi-step iterative algorithm
for predicting secondary structure (SS), angles (backbone torsion angles, Cα -based angles) and ASA at the same time. In the first iteration, only seven representative physical chemical properties of amino acid residues34 and Position Specific Scoring Matrix (PSSM) from PSIBLAST35 were employed to predict SS, angles, and ASA, separately. The seven physicochemical properties (PP) of the amino acids employed are steric parameter (graph shape index), hydrophobicity, volume, polarizability, isoelectric point, helix probability, and sheet probability properties of the amino acids. PSSM was obtained by three iterations of searching against 90% non-redundant (NR90, ftp://toolkit.genzentrum.lmu.de/pub/HH-suite/databases/ nr90.tar.gz) protein data bank with a cut off value (so called E-value) set to 0.001. PSSM represents the substitution probability of a given amino acid based on its position in the protein sequence with all 20 amino acids. In the second iteration, PSSM/PP plus predicted SS, angles, and ASA from the first iteration were employed to predict SS, angles, and ASA, separately. Additional iterations can be followed by using SS, angles, and ASA from the previous iteration in addition to PSSM and PP. We found three iterations are sufficient for achieving the best predictive power. Thus, each iteration has three separate predictors. Each predictor utilizes one stacked auto-encoder deep neural network as described above.
Input. We employed a window size of 17 amino acids (8 amino acids at each side of the target amino acid). For the residues on terminal ends of a protein sequence, we simply repeat the residue type of the first (or last) residue to fill the window. This led to a total of 459 input features (17 × (20 PSSM + 7PP)) for a given amino acid residue in the first iteration. This window size was optimized by 10-fold cross validation. The dependence on window size is small. For example, the accuracy of secondary structure prediction for the first iteration is 80.4–80.5% for the window size of 13, 15, 17, 19, and 21. Output. For output nodes, the SS predictor has three output nodes representing helix, strand, and
coil, respectively; the ASA predictor has only one output node, and the angle predictor has eight output nodes representing sin(θ ), cos(θ ), sin(τ), cos(τ), sin(φ ), cos(φ ), sin(ψ ), and cos(ψ ), respectively. Sine and cosine were employed to remove the effect of angle periodicity. Predicted sine and cosine values are converted back to angles by using the equation α = tan−1[sin(α)/cos(α)]. In the second iteration, the number of inputs for each predictor is 663 (= 17 × (20 PSSM + 7 PP + 3 SS + 1 ASA + 8 Angles)). Only Scientific Reports | 5:11476 | DOI: 10.1038/srep11476
3
www.nature.com/scientificreports/
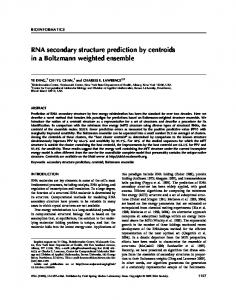
Figure 2. The accuracy of secondary structure (Q3), ASA (correlation coefficient), φ (Mean absolute error, MAE), ψ (MAE), θ (MAE) and τ (MAE) at four different iterations. Open and filled bars denote results from 10 fold cross validation and independent test, respectively.
sin(θ ), cos(θ ), sin(τ), cos(τ), sin(φ ), cos(φ ), sin(ψ ), and cos(ψ ) are utilised in the input for angles. The same number of inputs was employed for additional iterations.
Ten-fold cross validation and independent test. The method was first examined using ten-fold cross validation where TR4590 was randomly divided into 10 folds. Nine folds were used in turn for training and the remaining one for test until all 10 folds were tested. In addition, we tested our method for the independent test sets TS1199 and CASP11 by using TR4590 as the training set. Performance measure. For secondary structure, we use the fraction of correctly predicted secondary
structure elements for accuracy measurement (Q3)3. The accuracy of predicted angles was measured by a Mean Absolute Error (MAE), the average absolute difference between predicted and experimentally determined angles. The periodicity of an angle was taken care of by utilizing the smaller value of the absolute difference d i ( = A iPred − A iExpt ) and 360 − di for average. For ASA, we report both MAE and the Pearson correlation coefficient between predicted and actual ASA.
Results
The overall accuracy for all six structural properties (secondary structure, ASA, φ , ψ , θ , and τ) as a function of iterations is shown in Fig. 2. The improvement is clear at the second iteration and converged at the third iteration, regardless if it is 10 fold cross validation or independent test. Thus, we stopped the iteration at the third iteration. Three iterations led to about 1% improvement in Q3. In Table 1, we monitored the accuracy of each amino acid residue for secondary structure prediction. We found that for 17 of 20 amino acids, the accuracy improves in all three iterations. This confirms the robustness of improvement by iterations. In addition to improvement in secondary structure prediction, there is a 2% improvement in ASA correlation coefficient, 1°, 2°, 0.5° and 2° improvement in φ ,ψ , θ , and τ, respectively. Improvement in Scientific Reports | 5:11476 | DOI: 10.1038/srep11476
4
www.nature.com/scientificreports/ Secondary Structure Iteration Amino acids
Abundance
Frequency
1
2
3
4
A
21477
8.27
82.3
83.4
83.8
83.6
C
3557
1.37
74.4
75.3
76.3
76.6
D
15271
5.88
80.8
81.9
82.4
82.1
E
17413
6.71
81.5
83.0
83.5
83.3
F
10457
4.03
78.3
79.3
79.9
80.2
G
18723
7.21
80.6
81.8
82.1
82.0
H
5942
2.29
77.3
78.1
78.1
78.8
I
14577
5.61
82.2
83.4
84.0
83.8
K
15216
5.86
79.7
81.2
81.7
81.4
L
23835
9.18
81.7
83.3
83.6
83.4
M
5615
2.16
80.2
81.5
81.8
82.1
N
11306
4.35
79.8
80.8
80.8
80.9
P
11860
4.57
81.1
82.6
83.2
82.8
Q
9927
3.82
79.7
81.7
81.0
81.3
R
13307
5.12
79.6
81.0
81.2
81.5
S
15363
5.92
77.3
78.6
79.0
78.7
T
14445
5.56
77.8
78.9
79.0
79.1
V
18270
7.04
82.0
83.4
83.6
83.5
W
3828
1.47
76.7
78.3
79.4
78.8
Y
9273
3.57
76.8
78.4
79.0
79.0
80.2
81.4
81.8
81.7
Overall
259662
100.0
Table 1. The accuracy of predicted secondary structure for each amino acid residues for TS1199 for 4 iterations.
angles is the most significant, representing 5%–6%, relative improvement. At the third iteration, Q3 for the secondary structure is 81.6% for 10 fold cross validation and 81.8% for the independent test. The correlation coefficient between predicted and measured ASA is 0.751 for 10 fold cross validation and 0.756 for independent test. This is the correlation coefficient for un-normalized ASA. For normalized ASA (rASA), the correlation coefficient is slightly lower (0.731 for the independent test set). The mean absolute error for rASA is 0.145. The mean absolute errors of the angles for 10 fold cross validation (or independent test) are 19.2° (19.2°) for φ , 30.1° (29.9°) for ψ , 8.15° (8.03°) for θ , 32.4° (32.2°) for τ . Similar accuracy between 10 fold cross validation and independent test indicates the robustness of the method being developed. It is of interest to know if this improvement in angle MAE also translates into improvement in large angle errors. Reducing large angle errors is essential for sampling in the correct conformational space when used as restraints. Because both φ and ψ have two peaks in their distributions, they can be divided into two states associated with the two peaks. Here we define [0° to 150°] and the rest angle range [(150° to 180°) and (− 180° to 0°)] for two states in φ , and [− 100° to 60°] and the rest angle range [(− 180° to − 100°) and (60° to 180°)] for two states in ψ . We found that for the independent test set, the two-state accuracy for φ only increases marginally from 96.4%, 96.5% to 96.6% from the first to the third iteration. The two-state accuracy for ψ increases by a significant 1% from 85.3% , 86.4% to 86.8%. This significant increase confirms the usefulness of iterative learning. By comparison, SPINE-X36 was trained for two-state prediction and achieved two state accuracy of 96.4% for φ and 85.6% for ψ . Once φ and ψ or θ and τ are known protein backbone structure can be constructed. Fragment structures of a length L are derived from predicted angles with a sliding window (1 to L, 2 to L + 1, 3 to L + 2, and etc.). For L = 15, a total of 229,681 fragments are constructed. For φ /ψ derived fragments, each fragment structure was built by standard bond lengths and angles and ω = 180°. For θ /τ derived fragments, each fragment structure was built by the standard Cα -Cα distance of 3.8 Å. The accuracy of a fragment structure can be measured by root-mean-squared distance (RMSD) from the corresponding native fragment. The accuracy of fragment structures either from φ and ψ (Fig. 3A) or from θ and τ (Fig. 3C) improves during iterations (from 3.37 to 3.09 Å for φ /ψ derived fragments and from 3.22 to 2.95 Å for θ /τ derived fragments. Perhaps, not surprisingly, the consistency between φ /ψ and θ /τ
Scientific Reports | 5:11476 | DOI: 10.1038/srep11476
5
www.nature.com/scientificreports/
Figure 3. The improvement of fragment structures of 15 residues for the TS1199 dataset : (A) RMSD between the native fragments and the fragments generated from predicted φ and ψ for three iterations I1, I2, and I3 and the result from SPINE X (in grey bar). (B) RMSD between the native fragments and the fragments generated from predicted θ and τ for three iterations I1, I2, and I3. (C) The consistency between fragments from predicted φ and ψ and fragments from predicted θ and τ for three iterations I1, I2, and I3.
Method
PSIPRED
SPINE-X
SCORPION
SS (Q3)
79.7%(80.8%a)
81.0%(80.6%a)
82.0%(82.4%a)
–
0.74
–
ASA (CC)
SPIDER
This Work 81.8%(83.3%a)
–
0.76
MAE: φ (°)
–
20.2
–
–
19.2
MAE: ψ (°)
–
33.7
–
–
29.9
MAE: θ (°)
–
–
–
8.6
8.0
MAE: τ (°)
–
–
–
33.6
32.2
Table 2. Accuracy comparison between our technique and several techniques for secondary structure, ASA and angle prediction for the independent test set (TS1199). a66 proteins of TS1199 that are not in the training set for SCORPION.
derived fragments has the largest improvement during iterations (from to 2.54 Å to 1.92 Å). Results for other sizes of fragments follow similar trend. This further confirms the power of iterative learning. Our method is further applied to the most recent CASP targets (CASP11, 2014). It achieves 80.8% in secondary structure, 0.74 for correlation coefficient between measured and predicted ASA, 19.7° MAE for φ , 30.3° for ψ , 8.2° for θ , 32.6° for τ . The prediction accuracy for most structural properties is reduced somewhat from the independent test set to CASP 11 set. This type of reduction for CASP sets was observed previously4. This is in part due to a smaller number of targets (72 proteins) and in part because CASP targets were a carefully selected set for challenging structure prediction techniques. Tables 2 and 3 compare our method with several techniques for secondary structure (PSIPRED3.337, SCORPION38, SPINE-X4), ASA (SPINE-X4), backbone torsion angles (SPINE-X4) and backbone Cα angles and dihedral angles (SPIDER16) for TS1199 and CASP11 test datasets. We noted that TS1199 is not necessarily independent test set for other methods. In fact we found that the majority of TS1199 (all but 66 proteins) are contained in the training set for SCORPION. The accuracy for secondary structure predicted by our method is more accurate than that predicted by PSIPRED and SPINE-X and is comparable to SCORPION for the full TS1199 dataset. However, for the 66 proteins not trained by SCORPION, it achieves an accuracy of 82.4%, compared to 83.3% by our method. For ASA prediction, our technique continues to make an improvement over SPINE-X despite its high accuracy. The best improvement over previous methods is angle prediction. For example, there is almost 4° degree improvement (> 10% in relative improvement) over SPINE-X in ψ prediction. It is important to know the statistical significance of the difference among different methods. The p-values for the pair t-test in secondary structure of this work to SCORPION, PSIPRED, and SPINE X are 0.036, 0.00006, and 0.00009, respectively. That is, the improvement from this work over previous methods is statistically significant (