In order to improve the reservoir description phase in extensively recognized oil fields, a meth- odology, combining geostatistics, multivariate data analysis, and ...
Mathematical Geology, Vot. 22, No. 8, 1990
Improving Reservoir Description by Using Geostatistical and Multivariate Data Analysis Techniques 1 Henrique Garcia Pereira, 2 Ant6nio Costa e Silva, 3 Amilcar Soares, z Luis Ribeiro, 3 and Justino de Carvalho 3
In order to improve the reservoir description phase in extensively recognized oil fields, a methodology, combining geostatistics, multivariate data analysis, and appropriate geological reasoning, was developed. This methodology involves several steps: (i) Splitting the variable set available on each welt into two subsets, with different intrinsic meaning--the "principal" and the "supplementary" variables. The former summarize oil-quality distribution, and supplementary variables are chosen to reproduce some geological/petrophysical characteristics of the reservoir. (ii) Application of Correspondence Analysis to the disjunctive table recoding all data in categorical form, using arbitrary class limits for quantitative variables. 6i0 Selection of "final" class limits by visualization of supplementary projections onto the factorial plane and by contiguity analysis of groups in the well-location map. Groups of wells are arranged in decreasing order of their average oil-quality distribution, given by an index, which is the projection onto factor I of correspondence analysis. Ov) Establishment of Reservoir Quali~ Zones (RQZ), being a zone defined as a set ~f embedded groups, displaying spatial contiguity. The oiLquaIity index of a given zone is greater than a certain limit, which is related to fluids saturation, spatial distribution of net oil column and petrophysical characteristics of the zone. (v) Estimation of boundaries for each zone through Transitive Kriging of indicator data. (vi) Oil-in-place volume calculation for each zone, combining the geometrical estimation approach with Universal Kriging. Steps (i)-Ov) are applied interactively, using a case study for illustration purposes. Some consequences of horizontal zonation on production planning are discussed, focusing on the improvement of the reservoir description phase, brought by the proposed methodology. KEY WORDS: oil, correspondenceanalysis, transitive kriging, universal kriging, horizontalres-
ervoir zonation.
INTRODUCTION
For production-planning purposes, a critical step of the modeling process of a reservoir is the knowledge of its internal architecture. Oversimplification of this IManuscript received 23 January 1989; accepted 13 February 1990. 2CVRM, Technical University of Lisbon, IST, Av. Rovisco Pals, 1096 Lisboa Codex, Portugal. 3Partex CPS0 Av. 5 de Oumbro, 160, 1000 Lisboa, Portugal. 879 0882-8121/90/1100-0879506.00/| © 1990 International Association for Mathematical Geology
880
Pereira et al.
feature usually entails expensive running of black-box simulation programs, based on history-matching procedures. The reservoir characterization parameters that feed such programs are currently initialized by some average values, which are subsequently modified using blind trial-and-error procedures. The point to be raised here is that a combination of multivariate statistical techniques, geostatistics, and appropriate geological reasoning can provide a reliable basis for improving the overall modeling process and the field-development strategy, via the refinement of the reservoir description phase. Reservoir description involves a critical assessment of all geological, petrophysical, and production data, in order to define meaningful hydraulic zones in the reservoir and assign quantitative geological parameters to inter-well areas, at the appropriate scale for the the fluid-flow simulation. Most reservoirs exhibit strong heterogeneities, linked to complex variations in the pore space pattern, whic h influence relevant properties like porosity, permeability and capillary pressures. The heterogeneneity problem is approached here by a tesselation of the reservoir into "pay zones," denoted in the sequel Reservoir Quality Zones (RQZ). Once established, the reservoir framework, which includes the overall deposition system, the number and distribution of layers (vertical zonation), and the recognition of different lithologies and facies, it is now possible to perform the Reservoir Quality Zonation, as the next step in the reservoir description process. The objective of this step is to determine, within each layer, the lateral variation on rock properties and fluids saturation, as well as the areal extent of such characteristics. This subdivision into RQZ can easily be set up by using multivariate statistical techniques, which must reflect the current understanding of correlations involving the available geological and petrophysical information. Obviously, the segmentation of statistical units into groups is not unique, depending on the selected attributes and on the assumptions and rationale behind the data analysis algorithm. Therefore, a careful criticism of the groups obtained by multivariate statistics must be performed by the geological/production team. This task relies strongly on the graphical representation of groups obtained in the previous step, and is guided interactively by the production planning objectives. In particular, correlation of RQZ predicted by data analysis with facies distribution seems to be a promising feature, aiming to provide new insights into such problems as reservoir continuity, recovery efficiency, and fluid-migration paths. Once decided, combining expert advice with results of multivariate statististical techniques, which samples belong to each "final" group, the boundaries from zone to zone must be estimated, in order to define the geometry of the RQZ. This problem is approached here by using the geostatistical technique known as "transitive kriging of indicator data," which accounts for the geometrical structure of the RQZ, via the transitive variogram.
Improving Reservoir Description
88t
Inside each one of the RQZ, the oil-in-place volume is calculated using the Universal Kriging method, applied to the variable net oil column (thickness • porosity • oil saturation). In fact, in a previous study regarding the same data set (Pereira et al., 1989), the conclusion was reached that Universal Kriging gives better results than alternative techniques (intrinsic random functions of order k, trend surface analysis, median polish of the drift, etc.), provided that a reliable structural analysis is performed. In the framework of the above-outlined methodology, application of reservoir quality analysis to the prediction of zonal continuity, prior to planning secondary and tertiary recovery projects, can be a useful tool for improvement of the reservoir description phase. Some practical consequences of this analysis on reservoir development strategy and on residual oil recovery are reported in the sequel, for a case study concerning an extensively recognized field, as preliminary results of a research project granted by the Hydrocarbons Division of the EEC ("Development of a Geomathematical Model Applied to Oil Reservoirs' ').
AVAILABLE DATA The Middle East oil field, which was selected to test the above-outlined methodology, produces from porous limestones of Lower Cretaceous age; and a great amount of information related to geological, petrophysical, and production data is available. The general morphology of the reservoir is an elongated, domed anticline, divided vertically into layers by four main stylolitic intervals, evaluated from core descriptions, neutron, and induction logs data. The layer selected for this case study is the main producing unit of the reservoir, with an average thickness of 30.4 ft. Early test and pressure data were used to find the original fluid levels. The elevation of 7950 ft was taken as a preliminary value for the oil-water contact. Based on lithology (namely, limestone, clay, and dolomite), fossil content, and log analysis, facies were established by the geological team. Variation of facies within the reservoir was originated in coastal-marine and open-marine shelf environments, linked to sedimentary cycles driven by eustatic sea level changes. Within the relevant layer, four different facies were determined (from top to bottom): F1--A rudist facies composed by interbedded, vuggy rudistic debris packstones and wackestones with extensive cementation associated with the stylolitic zone.
882
Pereira et al.
F2--A miliolitic pellet facies composed by fine grains and well-sorted grainstones and packstones in well-bedded units. F3--A rudist facies, similar to the first one, but with negligible cementation. F4--A miliolitic, algal-lump facies composed by interbedded coarse and fine sediments, with predominant grainstones in the upper part. Apart from facies and lithology, measurements of elevations, thicknesses, porosities, permeabilities, and water saturations are available at each well, for the relevant layer. The total number of wells, at the final stage of development of the field, is 181, including producers, injectors, and water-supply wells. From these, a set of 172 wells was used in this case study, distributed in space according to the well-location map of Fig. 1. Regarding the reservoir fluid data, a single suite of PVT data is recommended, and the oil formation volume factor (Bo) is 1.60 RB/STB at the initial reservoir conditions. RESERVOIR-QUALITY ZONATION In a great reservoir where the main layers are separated by stylolitic intervals acting as vertical barriers, such as the one previously described, the lateral heterogeneities can play an important role in oil recovery; and the importance of areal zonation, as a basis for the understanding of reservoir continuity, is fully acknowledged. Essentially, the objective of this horizontal zonation procedure is to highlight lateral variations on fluid saturation and rock properties, splitting the available set of wells into groups that display similar characteristics. Since vertical zonation was performed in a previous step, the problem addressed here consists on finding, within the selected layer, the areal extent of homogeneous zones, in order to improve the interwell scale of reservoir description, by taking into account lateral heterogeneities affecting fluid saturation and oil recovery. For the purpose of areal zonation or tesselation of the field, several multivariate statistical methods can be applied. In this paper, the factorial method proposed by J.-P Benz6cri, denoted Correspondence Analysis, was selected (Benz6cri, 1973; Teil, 1975; Greenacre, 1984). This method has been used in the oil industry in rather different contexts (Bertrand et al., 1981; BonhamCarter et al., 1986). Nonetheless, for the objective of the present research, it seems also to be appropriate, since it provides the projection of wells and variables onto the same factorial space and accounts, jointly, for qualitative and quantitative information, bridging the gap between purely descriptive approaches and numerical models. In this case, facies and lithology are categorical data, which call for correspondence analysis application. Another useful feature of the correspondence analysis technique, to be ap-
Improving Reservoir Description
883
210
2oo
O
[]
[] []
[] 0
[]
rn
[]
o
[]
[] O []
[]
[] []
[]
[] O
O
O []
O
[] O
[]
O OO
[]
O
O O O0 [] N [] []
[]
O O
B
[]
r~
E
[]
[]
OO
O
O O
O
O
Q [] OO
O
B
O
O
O O
o []
fil .1
O []
O ~:~ B O ~O O E] O O o
O
O O O
B
OO [] []
O
[]
O
m a []
[]
O O Ic~ O
[]
B
O O
O O O O O
O O O O r~ O
~
O O
[]
B
El
O
[]
O
O
O
o
o
[]
O
O
O
[] O
O
0 r~
[]
O
[]
121
8
OO
r~
O
O []
O
O
0
[]
[]
[] r~ []
[]
B
240
O
.~0
I
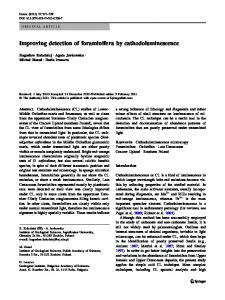
WELL LOCATIUN MAP Fig. 1. Well-location map of the field used in the case study.
3 Km
884
Pereira et al.
plied in the sequel, is that a subset of variables can be projected onto an existing display of a factorial plane, which has been previously obtained on the grounds of another set of variables. The subset producing the factorial axes is known as "principal," and the subset to be projected onto these axes is denoted "supplementary." This feature allows one to select a small subset of variables for the purpose of defining the meaningful well groups, being those groups checked a posteriori by the projection of supplementary variables. Even in the framework of correspondence analysis, a variety of procedures regarding the selection of principal vs. supplementary variables and their coding can be used. However, as it was shown by Zhou et al. (1983) in their classical paper, the best performance of correspondence analysis is achieved when the input matrix is a contingency table. In fact, the original development of the method was driven by the need of treating frequency of occurrences (Benzrcri, 1983, p. 99). However, in practical terms, correspondence analysis gives the same pattern of results when applied to the disjunctive matrix A = [A~A2] or to the contingency table C = [A IA2] (where A 1 and A 2 a r e disjunctive tables encoding variables 1 and 2, and ' denotes transpose), apart from a large change of scale, entailed by a functional relationship linking eigenvalues of the two analyses (Greenacre, 1984, p. 127-137). For this application, the disjunctive encoding was used, in order to control results by supplementary projections of geological/petrophysical variables. Nevertheless, all results are equivalent to those obtained using the appropriate contingency table. More specifically, the application of correspondence analysis to this case study was conducted according to the following methodology: 1. Using all available information coded in categorical form (elevation, water saturation, porosity, lithology, facies, water saturation of the flushed zone, hydrocarbon volume), an exploratory essay of correspondence analysis was applied to the disjunctive matrix relating wells to variables. As a result of this preliminary essay, the conclusion was reached that a small subset of variables could reproduce the global data pattern (in what concerns oil-quality distribution), defining meaningful well groups, to be checked by petrophysical/geological information. Hence, from the original set of variables, elevation and water saturation were selected as principal variables, hydrocarbon volume and water saturation of the flushed zone were disregarded, and the remaining attributes were taken as supplementary variables, viewed as the expression of the reservoir geological/petrophysical characteristics, and allowing to check a posteriori the well groups. 2. Using different class limits in the selected principal attributes, a series of two-way contingency tables was built. Each contingency table is a bidimensional histogram containing the absolute frequency of co-occurrences of wells which fall within the current class limits for both
Improving Reservoir Description
885
variables. The coding of the selected quantitative variables was performed accordingly. 3. For each one of the contingency tables, the correspondence analysis algorithm was applied to the equivalent disjunctive matrix, taking the other attributes (facies, lithology, porosity, permeability) as supplementary variables. 4. Results of correspondence analysis for each set of class limits of the principal variables were compared, on the standpoint of meaningful projections of the supplementary variables, viewed as an expression of the reservoir geological/petrophysical characteristics. 5. The "final" class limits, which define the groups of wells to be retained in the sequel as composing the reservoir quality zones, were chosen combining criterion 4. with expert advice of the geological/production team, based on contiguity of wells belonging to each group and on exploitation objectives. Applying interactively the above methodology, the final results (summarized in Fig. 2) were obtained. From the interpretation of Fig. 2, when the parabola-like curve is analyzed from left to right, a clear sequence of projections emerges, defining a decreasing order in the reservoir oil-quality distribution. The left upper side of Fig. 2 projects the 60 wells (labeled group 1) which correspond to the "best" reservoir oil quality. The right upper corner projects the 44 wells (labeled group 7), which cut the layer clearly under the oil-water contact. Intermediate groups (arranged in decreasing order of oil quality) are labeled 2-6 and project in the central and lower part of the graph. In particular, group 4 is the typical transition group, projecting in the opposite side of both oil and water, with respect to axis 2. This pattern is known in correspondence-analysis literature as the "horse-shoe effect" Greenacre, 1984, p. 226-232) or the "Guttman effect" (Benzdcri, 1980, p. 383), and reflects a nonlinear relationship linking the factorial axes. As expected from this particular pattern, all groups can be defined using only their factor-1 score, which can be viewed as an index of oil-quality distribution. As far as eigenvalues are concerned, results given in Fig. 2 are derived directly from this particular disjunctive encoding, being the inertia of the axes depressed by the "multiple" form of correspondence analysis applied here. For the equivalent 3 x 3 contingency table C = [A'IA2], the inertia explained by the two axes displayed in Fig. 2 (and giving rise to the same pattern of projections of principal variables) is exactly 100%. An eigenvalue of 0.7556 (73 %) is assigned to axis 1, and of 0.2812 (27%) to axis 2. The spatial two-dimensional arrangement of groups is displayed in Fig. 3, and their characterization, in terms of supplementary variables, is given in Table 1.
886
Pereira et al.
m
~.
o .a
w
0-o 0~ ÷° . ~
-
u
1
>~
T