that performance testing within reasonable effort can deliver results that are not ... described here has been implemented in an Excel tool for collector annual ...
IMPROVING THE ACCURACY IN PERFORMANCE PREDICTION FOR NEW COLLECTOR DESIGNS 1
1
1
2
Peter Kovács , Ulrik Pettersson , Martin Persson , Bengt Perers and Stephan Fischer 1
3
SP Technical Research Institute of Sweden, Brinellgatan 4, Box 857, 50115 Borås, Sweden. 2 Dalarna University Borlänge Sweden 3 Institute for Thermodynamics and Thermal Engineering (ITW), Research and Testing Centre for Thermal Solar Systems (TZS), University Stuttgart, Germany
1. Introduction The European standard for solar collector testing (EN 12975-2:2006) offers two different methods for characterizing the thermal performance of solar thermal collectors: The steady state method (SS) and the quasi dynamic method (QDT). The first one originates from the Ashrae 93-77 and ISO 9806 standards where the performance model parameters are determined under clear sky conditions (maximum 20 % diffuse fraction allowed, however EN 12975 states maximum 30 %) and at high irradiance levels (minimum 800 W/m 2, EN 12975 states 700 W/m2). The QDT method was developed and introduced in the EN standard in 2001, as the EN 12975 was first published. Compared to the SS method, the QDT method offers the following main advantages: It allows for accurate characterization of a wide range of collector types It allows for testing under a wide range of operating and ambient conditions which effectively reflect normal operation conditions It gives a more complete characterization of the collector through an extended parameter set as compared to steady state testing The fact that all model parameters are determined at the same time, from the same all day data base makes it possible to perform a direct model validation, especially when testing odd collector designs or when obtaining unexpected results In the QDT collector model (Perers 1993, Perers 1995, Perers 1997, Fischer 2004), see equation 1 below, the original steady state equation has been modified and extended with some correction terms. A single incidence angle modifier (IAM) for hemispherical irradiance has thereby been divided into incidence angle modifiers for direct ( K
b
( ) ) and diffuse ( K
d
) irradiance and the thermal capacitance term (c5) is integrated in the
equation. Furthermore, terms for the heat loss dependence on long wave irradiance (c4) and wind speed (c3) and wind speed dependence of the zero loss coefficients (c6) have been added. When introducing the IAM, the term
0
in the steady state equation has been replaced by F' ( )
en
, indicating
that it is the optical efficiency for direct irradiance only. However, as shown in the following, the
0
from a steady state test is biased by diffuse irradiance and therefore cannot be assumed equal to F' ( more relevant designation of these two parameters reflecting this fact, and
0 b, en (resulting
K
)
en
.A
from a steady state test)
from QDT), has been proposed in the current revision of the EN standard.
.
Q / A F' ( )
0 en (resulting
derived
( ) Gb F' ( )
K
en b en d 4 - c 3 u (t - t ) c 4 (E L - T ) - c 5 dt /dt m a a m
Gd - c 6 u G * - c1 (t
- t ) - c 2 (t - t ) 2 m a m a (Eq. 1)
These generalizations make it possible to test collectors under the most varying weather conditions and in fact, a certain variation in the weather during testing is desirable in order to have all relevant parameters properly identified. This feature is a great advantage in some European locations where steady state testing can be very
time consuming. On the contrary, applying the present version of QDT can be difficult in other locations for some collector designs, where the weather is very stable or where diffuse fractions are constantly very low (Alfonso el al 2008). There is thus a need for further development of the QDT in order to make it fully applicable also at such locations. The other very advantageous feature of QDT is its applicability to a wide range of collector designs, including ETC:s, concentrating, semi concentrating (Rönnelid, Perers, Karlsson 1996, 1997) and unglazed collectors (Perers 1987). A further extension of the QDT method for test of unglazed collectors operating under the dew point of the air (for heat pump applications) is also available, but not yet fully validated (Perers 2006, Perers 2010). An interesting future perspective of the QDT method is that it has the potential for radically shortening the required testing time e.g. by using night time measurements and frequent controlled step changes in the collector inlet temperature. As the market now grows, the collector types mentioned are becoming increasingly common and it is essential that performance testing within reasonable effort can deliver results that are not biased by unique features of a single collector type. Recent experiences from testing of these products however tell us that steady state testing in this respect is not powerful enough, which is shown in the following example. A method for increasing accuracy of the steady state method and the compatibility between the two performance test methods by calculating “missing” parameters from the ones determined in the steady state test is outlined. The method described here has been implemented in an Excel tool for collector annual energy output calculation which was recently introduced in the proposed new EN 12975-2 standard (Boverket 2009, Perers 2011). The following example focuses on an ETC collector of the Dewar type, i.e. with a cylindrical absorber, as this is the most obvious case where the accuracy of the steady state method can be improved. However, the correction method may also be possible to use in order to generalize the steady state method to different concentrating designs even though QDT presently is the most appropriate method for these collectors. 2. Method to increase accuracy of steady state testing When testing ETC:s with cylindrical absorbers according to the steady state method, the ability to utilize irradiance coming from non-normal incidence angles, a specific feature of this collector type, can result in a significant bias in the resulting model parameters. This is due to the following two effects: The impact of the incidence angle modifier for direct irradiance in the transverse direction K
b
(
T
)
) > F' ( ) ) and much more pronounced compared to e.g. flat plate en e collectors. Requirements in the EN (SS part) and ISO standards are that the IAM must not differ more than 2% from its value at normal incidence during performance testing. This makes the “acceptance angle” for determining F' ( ) by steady state measurements very small (often below is positive (i.e. F' (
en
±5 degrees). This should be further stressed in the EN 12975 standard as measurements at higher angles can lead to significant over estimation of the F' ( ) parameter. From a practical point of
en
view it means that a solar tracker should be used in testing unless very stable weather conditions are guaranteed at the test site. If the collector is mounted on a fixed structure the acceptance angle of ± 5 degrees corresponds to a time window of only ± 20 minutes around solar noon. The incidence angle modifier for diffuse irradiance is normally in the range of 1,0 < K
d
< 1,5 for
this kind of collector i.e. resulting in a higher efficiency for diffuse than for direct irradiance as compared to e.g. flat plate collectors where it is normally between 0,85 and 1,0 i.e. a less pronounced effect resulting in a lower efficiency for diffuse than for direct irradiance. Determination of F' ( ) that should represent direct irradiance at normal incidence will therefore be positively
en
biased even at relatively low diffuse fractions during an EN-SS test. As
K
d
is not identified
through the steady state test, this effect cannot be directly corrected for. If different diffuse fractions
occur when
F' (
)
en
and
F' (
) are measured this will probably also give a bias in the values e
of KθbL and KθbT. The impact of these two effects are shown in table 2 by calculating the zero loss coefficient 0 (which is effectively what is determined as F´(τα)en in the steady state measurement) from a “fixed”
F' (
)
en
for a set
of incidence angles and diffuse fractions, according to equation (2). Here, a zero loss coefficient for hemispherical irradiance is weighted together by the corresponding coefficients for direct and for diffuse irradiance. 0=
F´(τα)en*Kθb(θ=θi)* a + F´(τα)en*Kθd* (1-a) [--]
(Eq. 2)
Where Kθb(θi)= KθbL(θi,l)* KθbT(θi,T), a=fraction of direct irradiance, (1-a)= fraction of diffuse irradiance. 0= zero loss efficiency from stationary testing. θi is the average incidence angle during the SS - 0 test Now, if the IAM for diffuse irradiance Kθd can be determined, equation (2) can be used to calculate F´(τα)en from measured values of 0 and measured or default values of the IAM for direct irradiance Kθb(θi) and a.
F´(τα)en=
0 /[
Kθb(θ=θi)* a + Kθd* (1-a)]
(Eq. 3)
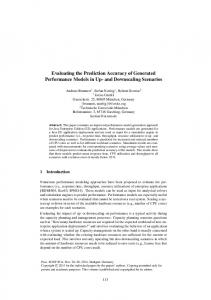
In the proposed method for adjusting steady state parameters to better accuracy, Kθd is first determined from the measured values of KθbL and KθbT, by integrating them over a hemisphere, assuming isotropic sky conditions (Perers 1995). Thereafter, F´(τα)en is calculated according to equation (3). 3. Results A typical evacuated tube collector with cylindrical absorber tested according to the steady state method is partly characterized by the IAM parameters according to table 1. Table 1. Incidence angle modifiers for direct hemispherical irradiance in the transverse and longitudinal directions for the example collector
Angle of incidence [º] KθbL KθbT
0
10
20
30
40
50
60
70
80
90
1.000 1.000
1.000 1.070
1.000 1.140
0.985 1.275
0.970 1.410
0.920 1.730
0.840 1.760
0.700 1.760
0.350 0.880
0.000 0.000
2.00 K(Long) K(Trans)
1.80 1.60
K L and K T
1.40 1.20 1.00 0.80 0.60 0.40 0.20 0.00 0
20
40 60 Angle of incidence
80
100
Figure 1. Incidence angle modifiers for direct hemispherical irradiance in the transverse and longitudinal directions for the example collector
Integrating the values of KθbL(θi,L) and KθbT(θi,T) over the hemisphere gives a calculated Kθd equal to 1,22.
Depending on the diffuse fraction and any incidence angle offset from normal incidence during steady state measurements of this particular ETC, the measured
0-value
will deviate from the true F´(τα)en value (0,65)
according to table 2. In other words, the conventional steady state test will only produce the true F´(τα)en in the case represented in the first row of table 2 (for parallel light=beam radiation, at normal incidence, no diffuse radiation at all). The annual energy gain in table 2 has been calculated using weather data from Meteonorm for Stockholm and an Excel tool developed within the Solar Keymark II and Qaist projects (Boverket 2009, Perers 2011). The following collector model parameters have been used: 0=
According to table 2 -2
a1=1.5 Wm K
-1
-2 -2
a2=0.01 Wm K
IAM (KθbL and KθbT )= According to table 1
Kθd=1,22 (calculated from KθbL and KθbT according to the method described above) Over estimation in annual energy gain due to different fractions of diffuse irradiance and non normal incidence angles during an EN-SS test is shown in table 2. It is calculated as the output as it would have been if testing had taken place at 0 % diffuse fraction and normal incidence angle (699 kWh/(m2*a)) relative to each specific case e.g. (709-699)/699 in the second row. Table 2. Bias in 0 and annual energy gain due to deviations from optimum test conditions. Values based on normal incidence and direct irradiance in the first row and on possible ranges of incidence angle of direct irradiance and diffuse fractions in the following rows.
Angle offset from normal incidence during 0 measurement (longitudinal/ transverse) [degrees] 0/0 0/0 0/0 0/0 0/5 0/10 0/15 0/5 0/10 0/15 0/5 0/10 0/15
Diffuse fraction
Steady state measured 0
True F´(τα)en
Annual energy gain at Tm=50°C
Over estimation in energy gain
[%] 0 5 15 30 5 5 5 15 15 15 30 30 30
[-] 0,65 0,657 0,672 0,693 0,679 0,700 0,722 0,691 0,710 0,730 0,709 0,725 0,741
[-] 0,65 0,65 0,65 0,65 0,65 0,65 0,65 0,65 0,65 0,65 0,65 0,65 0,65
[kWh/(m2*a)] 699 709 729 758 739 767 797 755 781 808 780 801 823
[%] 1,4 4,3 8,4 5.7 9,7 14,0 8,0 11,7 15,6 11,6 14,6 17,7
It shall be noted here that the proposed method for deriving Kθd, as a result of assuming isotropic sky conditions, tends to underestimate the value of Kθd. From QDT measurements on this type of collector, Kθd- values >1,4 have been determined. Applying steady state testing on a collector with an F´(τα)en- value= 0,65, a Kθd=1,4 and a diffuse fraction of 15 % would result in an 0=0,69 even with measurements carried out at normal incidence. For collectors of conventional design with Kθd- values < 1,0 the result will be the opposite i.e. an under estimation of 0 , however less pronounced as the IAM for diffuse irradiance (Kθd ) is closer to that for direct irradiance in this case. As a pragmatic approach to the issue of choosing incidence angles and diffuse fractions for a standardized correction procedure, it is suggested that normal incidence and a diffuse fraction of 15 % is applied in all calculations. This figure has no scientific basis but is merely an assumption or an estimate of average conditions prevailing during steady state testing. This is partly in accordance with the weighting procedure applied in EN
12975 where a reference steady state case has been defined for graphical presentation of QDT results. In that case 15% diffuse fraction and Θi equal to 15 degrees is used. 4. Conclusions It has been shown that the zero loss coefficient and thus the energy performance of ETC:s with cylindrical absorbers when determined according to the steady state method described in EN 12975-2 is over estimated due to the specific characteristics of this collector type. The proposed method will deliver a more accurate value of F ´(τα)en as well as a “new” parameter, Kθd when steady state testing is applied to an ETC collector with cylindrical absorber. Considering that the diffuse fraction of annual irradiance for many European locations is in the order of 35-45 % it is essential that this dependency can be accurately modeled. System simulations and annual performance predictions based on the steady state test can thus be carried out with significantly improved accuracy for this type of collector. In particular the modeling of collector characteristics and system performance can be improved at low irradiance levels and high diffuse fractions, more often occurring during the heating season i.e. autumn to spring, where heat produced is generally more valuable than in the summer season. The method tends to under estimate Kθd and could thus be further refined. If the method could be shown to give good agreement between measured (using QDT) and calculated (based on steady state measurements) values of Kθd it could open up for a wider application range also for steady state testing. The presented findings reveal a need for some further clarifications in the EN 12975 standard in order to avoid overestimation of collector performance for certain collector types.
5. Acknowledgements This work was partly financed by the European Commission through the IEE program and partly by the Swedish Energy Agency. Very much of the basic work for dynamic testing is made within the IEA Solar Heating and Cooling program especially Task III, Task VI, Task 14 and Task 26. We cannot mention all individual persons and organizations contributing here during the years in different ways. The sole responsibility for the content of this paper lies with the authors. It does not necessarily reflect the opinion of the European Union. Neither the EACI nor the European Commission are responsible for any use that may be made of the information contained therein. 6. References Alfonso J., Mexa N., Carvalho M, 2008 ”Comparison between Steady State and Quasi-Dynamic test Method according to EN 12975- application to flat plate collectors.” Eurosun 2008 Boverket, 2009 “Swedish annual energy gain v 2008-11-27.xls” The National Boarding of Housing, Building and Planning of Sweden. CEN, European committee for standardization, 2006 “EN 12975-2:2006, Thermal solar systems and components - Collectors - Part 2: Test methods” Fischer S et. al, 2004 “Collector test method under quasi dynamic conditions according to the European Standard EN 12975-2” Solar Energy. Vol 76 pp 117-123 Perers, B, 1987 “Performance testing of Unglazed Collectors. Wind and Long wave Radiation Influence” IEA Task III. Studsvik 1987 Perers, B, 1993 “Dynamic Method for Solar Collector Array Testing and Evaluation with standard Database and Simulation Programs.” Solar Energy Vol 50. No 6. pp 517-526 Perers, B, 1995 “Optical modeling of Solar Collectors and Booster Reflectors under Non Stationary Conditions.” PhD Thesis. Uppsala University. ISBN 91-554-3496-7. Perers, B, 1997 “An Improved Dynamic Solar Collector Test Method for determination of Nonlinear Optical and Thermal Characteristics with Multiple Regression.” Solar Energy 59 163-178. Perers B, 2006 “A Dynamic Collector Model for Simulation of the operation below the dew point in Heat Pump Systems.” Eurosun Conference Glasgow
Perers, B, 2010 “An improved dynamic solar collector model including condensation and asymmetric incidence angle modifiers.” Eurosun 2010. Perers, B et al, 2011 “A new tool for standardized collector performance calculations”. ISES 2011. Rönnelid M., Perers B., Karlsson B,1996 “Construction and Testing of a Large area CPC collector and Comparison with a Flat plate collector.” Solar energy 57. 177-184. Rönnelid M., Perers B., Karlsson B, 1997 “On the factorization of Incidence Angle Modifiers for CPC Collectors.” Solar Energy Vol. 99. No. 4-6. pp. 281-286.