Papers in Press. Published August 6, 2009 as doi:10.1373/clinchem.2009.123695 The latest version is at http://www.clinchem.org/cgi/doi/10.1373/clinchem.2009.123695 Clinical Chemistry 55:10 000 – 000 (2009)
Cancer Diagnostics
Increased Tissue Factor Expression is Associated with Reduced Survival in Non–Small Cell Lung Cancer and with Mutations of TP53 and PTEN Sandra Regina,1,2 Jean-Baptiste Valentin,1 Se´bastien Lachot,1 Etienne Lemarie´,2,3 Je´roˆme Rollin,1,2 and Yves Gruel1,2*
BACKGROUND: Tissue factor (TF), the main initiator of blood coagulation, is also a signaling protein that regulates cancer progression. TF synthesis was recently shown to be affected by tumor suppressor genes (TSG) in tumor cell lines. We therefore studied TF gene expression and the status of the genes tumor protein p53 (TP53), phosphatase and tensin homolog (PTEN), and serine/threonine kinase 11 (STK11) in non–small cell lung cancer (NSCLC). Heparanase (HPSE) gene expression was also measured because this endo--Dglucuronidase was recently shown to enhance TF gene expression.
CONCLUSIONS:
These results provide clear evidence that combined oncogene events affecting TSG dramatically increase TF gene expression in lung tumors. Moreover, this study suggests that TF gene expression could be used as a prognostic marker in NSCLC.
© 2009 American Association for Clinical Chemistry
TF mRNA levels were significantly higher in T3–T4 tumors (P ⫽ 0.04) and in stages III–IV of NSCLC (P ⫽ 0.03). Mutations of TP53, STK11, and PTEN were identified in 20 (37.7%), 21 (39%), and 20 (37.7%) of tumors, respectively. TF expression was higher in mutated TP53 (TP53Mut) (P ⫽ 0.02) and PTENMut (P ⫽ 0.03) samples. Moreover, TF mRNA increased from 2700 copies (no mutation) to 11 6415 when 3 TSG were mutated. Heparanase gene expression did not differ according to TF gene expression or TSG mutation. The median survival time was shorter in patients with tumor TF mRNA levels above median values (relative risk 2.2; P ⫽ 0.03, multivariate analysis) and when TP53 was mutated (relative risk 1.8; P ⫽ 0.02).
Lung cancer is the most common malignant disease worldwide and a major cause of cancer-related death, particularly among men, with 1 200 000 new cases diagnosed each year and only 10% of patients surviving the disease (1 ). Lung cancers are almost exclusively carcinomas that originate in the epithelia of the trachea, bronchi, or lungs. Several histological types have been identified and they are divided into 2 groups, small cell lung cancer (SCLC)4 (20%) and non-SCLC (NSCLC) (80%). Tissue factor (TF), a 47-kDa transmembrane protein, is the essential receptor for factor VII/VIIa and the physiological trigger of blood coagulation (2 ). TF synthesized by cancerous cells or by the tumor microenvironment probably contributes to the hypercoagulable state that occurs in patients with cancer. In addition, TF plays a direct role in tumor evolution by promoting tumor growth, angiogenesis, cell migration, and development of metastases (3 ). In NSCLC, we recently demonstrated that tumor TF gene expression varied between patients but was significantly higher in patients with advanced stages of cancer (4 ). Moreover, our study also showed a relationship between overexpression of tumor TF and the presence of a mutation of codon 12 of v-Ki-ras2 Kirsten rat sarcoma viral oncogene homolog (KRAS).5
1
4
METHODS: TF and heparanase mRNA expression was measured by real-time PCR in 53 NSCLC tumors. Exons 5– 8 of TP53 were sequenced from genomic DNA. Mutations of PTEN and STK11 were screened by multiplex ligation-dependent probe amplification. RESULTS:
Department of Hematology-Hemostasis, Trousseau Hospital and Franc¸ois Rabelais University, Tours, France; 2 INSERM, Tours; 3 Department of Pneumology, Bretonneau Hospital and Franc¸ois Rabelais University, Tours, France. * Address correspondence to this author at: Professor Yves Gruel, INSERM U 618, “Prote´ases et Vectorisation Pulmonaires,” Faculte´ de Me´decine, 10 bis Bd Tonnelle´, 37032 Tours Cedex, France. Fax ⫹33-2-47-36-60-46; e-mail
[email protected]. Received January 9, 2009; accepted July 9, 2009. Previously published online at DOI: 10.1373/clinchem.2009.123695
Nonstandard abbreviations: SCLC, small cell lung cancer; NSCLC, non-SCLC; TF, tissue factor; TSG, tumor suppressor genes; MLPA, multiplex ligation-dependent probe amplification; Mut, mutated; WT, wild type; mTOR, mammalian target of rapamycin. 5 Human genes: KRAS, v-KI-ras 2 Kirsten rat sarcoma viral oncogene homolog; TP53, tumor protein p53; PTEN, phosphatase and tensin homolog; STK11, serine/threonine kinase 11; HPSE, heparanase; EGR1, early growth response 1; EGFR, epidermal growth factor receptor (erythroblastic leukemia viral (v-erb-b) oncogene homolog, avian).
1
Copyright (C) 2009 by The American Association for Clinical Chemistry
The involvement of tumor suppressor genes (TSG) or oncogenes other than KRAS in TF gene expression has recently been reported with cell lines and animal models in colorectal cancer with tumor protein p53 (TP53) (also called p53) (5 ) and in glioma with phosphatase and tensin homolog (PTEN) (6 ) but has never been shown in samples from patients with cancer. Therefore in this study we investigated the presence of lesions in the TP53 and PTEN genes in lung tumors of patients with NSCLC and the possible association with increased TF gene expression. We also looked for mutations of serine/threonine kinase 11 (STK11) (also called LKB1), which have also been frequently detected in primary human lung adenocarcinoma (7 ), because it was recently shown that STK11 can regulate lung cancer differentiation and metastasis in combination with KRAS (8 ). TF gene expression can also be regulated in some cancers by heparanase, a mammalian endo--Dglucuronidase cleaving heparan sulfate chains in the extracellular matrix and on cell surfaces (9 ). In physiological conditions, the heparanase (HPSE) gene is preferentially expressed by cells of the immune system, platelets, and placenta cells. However, recent studies have also shown that heparanase protein is synthesized by tumor cells (10 ) with an expression possibly regulated by p53 (11 ) and EGR1 (early growth response 1) (12 ). On the other hand, heparanase can induce TF synthesis in endothelial cells and cancer cells (13 ) and can be involved in tumor angiogenesis and metastasis (14, 15 ). Therefore in the present study we looked for a relationship between TF and HPSE expression in NSCLC tumors and investigated whether TF and heparanase are regulated by TP53, PTEN, and STK11.
tumors (17 ). All patients gave informed consent for genetic studies as recommended by French legislation and in accordance with the current revision of the Helsinki declaration. RNA EXTRACTION AND REAL-TIME PCR FOR HEPARANASE AND TF
As previously described, we extracted total RNA from the 53 tumors by using the Perfect RNA Eukaryotic Mini Kit (Eppendorf) according to the manufacturer’s instructions (18 ). The number of heparanase transcripts within lung tumors was assessed by a real-time PCR method adapted from Uno et al. (19 ). The results were expressed as the number of heparanase mRNA copies for 108 copies of 18S RNA. TF tumor gene expression was analyzed by realtime PCR as previously described (4 ). Results obtained were compared with TF protein analyzed by use of a tissue microarray technique that allowed tumors to be designated as either “low TF” (⬍33% of positive cells) or “high TF” (⬎33% of positive cells), as previously described (4 ). TP53 GENE MUTATION ANALYSIS
We prepared genomic DNA from lung tumors by using a DNA purification kit (Qiagen) as previously described (18 ). Sequencing of exons 5– 8 of the TP53 gene was performed on DNA extracted from 53 tumor samples. Primers were chosen with the assistance of the Primer3 computer program, and their sequences are presented in Table 2. We used 50 ng of DNA for PCR amplification. PCR products were cycle-sequenced using the Big Dye Terminator V3.1 cycle sequencing kit (Applera) and an ABI PRISM 3130 Genetic Analyzer (Applied Biosystems).
Materials and Methods DNA ANALYSIS FOR PTEN AND STK11 MUTATIONS BY PATIENTS
We analyzed tumor samples from 53 white patients with NSCLC who had undergone complete surgical resection as initial treatment (i.e., without prior radiotherapy or chemotherapy) between January 2002 and February 2005 in our hospital (CHU Trousseau, Tours, France) (Table 1). Tumor samples were selected by a pathologist from fresh surgical samples, and 1 part was snap-frozen in liquid nitrogen and immediately stored at ⫺80 °C until DNA extraction. In addition, another part of the tumor biopsy sample was immediately stored in RNAlater (Ambion) until RNA extraction. Histological diagnosis and grade of differentiation were assigned according to the WHO criteria for lung tumors (16 ), and pathological staging was based on the revised TNM (tumor-node-metastasis) classification of malignant 2
Clinical Chemistry 55:10 (2009)
MULTIPLEX LIGATION-DEPENDENT PROBE AMPLIFICATION
STK11 and PTEN mutations were screened by use of multiplex ligation-dependent probe amplification (MLPA) using the SALSA-MLPA Kits P101 and P225, respectively (MRC-Holland). The principle of this analysis is based on sequence-specific probe hybridization to genomic DNA, followed by amplification of the hybridized probe, and semiquantitative analysis of the resulting PCR products. The relative peak height and band intensity for each target indicate their initial concentration. For both genes, 70 ng of genomic DNA was incubated at 98 °C for 5 min. After the preparation had cooled to 21 °C, 1 L probe mix and 1 L SALSA hybridization buffer were added, and the solution was denatured at 95 °C for 2 min and hybridized at 60 °C for at least 16 h. Hybridized probes were next ligated at 54 °C for 15 min with 21 L of ligation mixture, fol-
TF Expression and Oncogene Events in NSCLC
Table 1. Clinicopathological features of patients with NSCLC, status of codon12 of the KRAS gene (WT or mutated), and relationship with mutations of TP53, STK11, and PTEN tumor suppressor genes (Fisher exact test). TP53
STK11
PTEN
Patient features
All patients, n (%)
WT (n ⴝ 33)
Mutated (n ⴝ 20)
P
WT (n ⴝ 32)
Mutated (n ⴝ 21)
P
WT (n ⴝ 29)
Mutated (n ⴝ 20)
P
Median age (range), y
66 (44–83)
67 (45–80)
65 (44–83)
—
65 (44–79)
68 (45–83)
—
67 (45–83)
65 (44–79)
—
Sex Female
7 (13)
5
2
46 (87)
28
18
5 (10)
3
2
48 (90)
30
18
T1–T2
46 (87)
29
17
T3–T4
7 (13)
4
3
Male
0.62
5
2
27
19
3
2
29
19
27
19
5
2
0.52
5
1
24
19
2
2
27
18
23
18
6
2
0.37
Smoking status Nonsmokers Smokers
1
0.98
0.98
Tumor status 0.99
0.52
0.44
Node status N0
29 (55)
18
11
N⫹
24 (45)
15
9
M0
44 (83)
29
15
M⫹
9 (17)
4
5
I–II
28 (53)
18
10
III–IV
25 (47)
15
10
AK
32 (60)
22
10
CE
13 (24)
7
6
8 (16)
4
4
45 (85)
28
17
8 (15)
5
3
1
16
11
16
10
25
19
7
2
15
13
17
8
21
11
5
8
6
2
29
16
3
5
0.86
19
10
10
10
27
15
2
5
15
10
14
10
16
13
9
5
4
2
25
16
4
4
0.93
Metastasis status 0.27
0.24
0.1
Stage 0.78
0.28
0.93
Histological type
Others
0.51
0.9
0.77
Codon 12 KRAS WT Mutated
lowed by an inactivation step of 5 min at 95 °C. Finally, 7.5 L of ligation product was mixed with the SALSAPCR mixture and subjected to amplification for 30 cycles according to the manufacturer’s recommendations. Amplification products were diluted at 1 part to
0.98
0.15
0.77
9 parts in Hi-DI formamide (Applied Biosystems) containing 500-LIZ size standard (Applied Biosystems) and then separated by size on an ABI 3130 Genetic Analyzer (ABI). The data obtained were analyzed as previously described (20 ).
Table 2. Oligonucleotide primers used in sequencing analysis of TP53.
Forward primer, 5ⴕ33ⴕ
Reverse primer, 5ⴕ33ⴕ
PCR product, bp
Exon 5
CTCTTCCTACAGTACTCCCCTGC
CCAAGCTGCTCACCATCGCTA
214
Exon 6
GATTGCTCTTAGGTCTGGCCCCTC
GGCCACTGACAACCACCCTTACC
182
Exon 7
GCTTGCCACAGGTCTCCCCAAG
AGGGTGGCAAGTGGCTCCTGAC
192
Exon 8
TGGTAATCTACTGGGACGGA
GCTTAGTGCTCCCTGGGGGC
134
Clinical Chemistry 55:10 (2009)
3
Table 3. Relationship between tumor TF or heparanase gene expression and mutations of TP53, PTEN, and STK11 tumor suppressor genes in NSCLC tumors (Mann–Whitney U-test). Tissue factor
Gene
TP53
Status (n)
WT (33) Mutated (20)
STK11
WT (32) Mutated (21)
PTEN
WT (29) Mutated (20)
a
Median gene expression (range)
6225 (10–137720) 15655 (110–309660) 8800 (100–309660) 15810 (10–154800) 8530 (10–309660) 17370 (110–154800)
P
0.02a 0.43 0.03a
Median gene expression (range)
1848 (80–113000) 3311 (530–39750) 3700 (225–19500) 1990 (80–113000) 3310 (80–39750) 1690 (90–25541)
P
0.09 0.42 0.38
P ⬍ 0.05.
DNA extracted from NL20, a normal pulmonary cell line, was systematically tested as a negative control in each experiment. In addition, DNA samples from 3 NSCLC cell lines (Calu-1 mutated for PTEN, A549 and H23 mutated for STK11) were also tested as positive controls (21, 22 ). STATISTICAL ANALYSIS
A Mann–Whitney U-test was used to analyze the continuous variables, i.e., TF and heparanase gene expressions according to the status of TP53, PTEN, and STK11 (i.e., mutated or not) and the clinicopathological features. Spearman rank correlation coefficients were used in analysis of the coexpression of TF and heparanase genes in NSCLC tumors. The Fisher exact test was used in assessing the association between clinicopathological factors and TSG mutations. A P value ⱕ0.05 was considered to be statistically significant. The postoperative survival rate was analyzed by the Kaplan–Meier method, and the differences in survival rates were assessed by the log-rank test. Multivariate analysis of prognostic factors was performed using Cox regression. Variables included in the analysis were TF and heparanase gene expressions (i.e., above or below the median value), age, NSCLC stage, and TP53 status (i.e., mutated or not). Results TUMOR EXPRESSION OF TF AND HEPARANASE IN NSCLC AND RELATIONSHIP WITH TP53, PTEN, AND STK11 STATUS
The expression of TF and heparanase genes was evaluated by specific real-time PCR in lung tumors surgically removed from the 53 patients. TF gene expression was variable from one tumor to another with a median number of transcripts equal to 11540 per 108 copies of 18S RNA. TF protein expres4
Heparanase
Clinical Chemistry 55:10 (2009)
sion was also variable, as evidenced by tissue microarray analysis results, with 39 NSCLC tumors classified in the low-TF group and 14 samples identified as high TF. As expected, median TF mRNA levels were lower in samples from low-TF tumors than in samples from high-TF tumors (7670 vs 89 590 copies/108 18S RNA). Heparanase mRNA levels were lower in lung tumors (median ⫽ 2922 transcripts/108 copies of 18S RNA) and also were variable but without any correlation with TF gene expression (Spearman rank correlation, r ⫽ 0.216; P ⫽ 0.2). The status (i.e., mutated or not mutated) of the TP53, STK11, and PTEN genes was studied on genomic DNA extracted from NSCLC biopsy samples. Exons 5– 8 of TP53 were analyzed by genomic PCR and direct sequencing. We identified 17 mutations in 20 of 53 tumors (37.7%) located in exon 5 (n ⫽ 7), exon 6 (n ⫽ 5), or exon 7 (n ⫽ 8). All mutations found had been reported in the UMD TP53 mutation database (23 ), but 5 had never been associated with NSCLC (479T⬎A, 645T⬎A, 685T⬎A, 686G⬎C, and 706T⬎G). TF gene expression was significantly higher in mutated TP53 (TP53Mut) tumors than in TP53 wild type (TP53WT) tumors (median 15655 vs 6225 transcripts/ 108 copies of 18S RNA, P ⫽ 0.02). In contrast, heparanase mRNA levels appeared higher in TP53Mut tumors than in TP53WT tumors, but the difference was not statistically significant (median 3311 vs 1848 transcripts per 108 copies of 18S RNA; P ⫽ 0.09). The 2 other TSG, STK11 and PTEN, were analyzed using the MLPA method. For STK11, sequence alterations were detected in 21 samples (39%) and were mainly deletions (n ⫽ 15), most of them being localized in exon 1 (n ⫽ 14) and the others in exon 3 (n ⫽ 5) and in exon 8 (n ⫽ 2). However, no relationship was
TF Expression and Oncogene Events in NSCLC
P = 0.0 1
105 104 103 102 10 Median 2700 14 n* 0
C 106 Number of copies /108 copies of 18S RNA
B
TF Gene Expression 106
13 700
16 500
116 415
17
14
8
1
2
3
Number of copies /108 copies of 18S RNA
Number of copies /108 copies of 18S RNA
A
Heparanase Gene Expression
106
P = 0.2 1
105 104 103 102 10 Median
6460
4480
1780
14
17
14
8
0
1
2
3
n*
Number of mutated genes (TP53, PTEN, STK11)
Number of mutated genes (TP53, PTEN, STK11)
D
P = 0.001
TF Gene Expression
Number of mutated genes
105
n*
0
12
1
16
104 2
103
18
102 3
6
10 Median n*
2920
1500
11 045
87 765
309 550
12
16
16 135 18
6
1
0
1
2
3
4
4
1
Mutated genes (n*)
Median number of TF mRNA copies
TP53 (3)
2030
1500
PTEN (5)
13 710
STK11 (8)
11 045
STK11 + PTEN (2)
17 37 0
TP53 + STK11(4)
6305
STK11 + KRAS (5)
19 150
TP53 + PTEN (7)
16 500
TP53 + STK11 + KRAS (1)
78 000
PTEN + STK11 + KRAS (1)
97 530
TP53 + PTEN + STK11 (2)
106 405
TP53 + PTEN + KRAS (2)
74 485
All
309 550
Number of mutated genes (TP53, PTEN, STK11, KRAS)
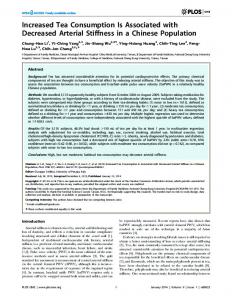
Fig. 1. TF (A,C) and heparanase (B) gene expression in NSCLC according to the number of mutations affecting TP53, PTEN, STK11 (A,B) and KRAS (C). (D), all combinations of mutations identified and the median number of TF mRNA copies measured in corresponding lung tumors; *n, number of lung tumors.
found between STK11 status and TF or heparanase gene expression (Table 3). PTEN status was studied in all tumors by MLPA but could not be defined in 4 samples, owing to insufficient DNA amplification. Lesions in PTEN were detected in 20 samples and deletions/mutations were the most frequently evidenced (n ⫽ 18/20). A single abnormality was found in 7 tumors, and several deletions/mutations were found in the other 13. The TF gene was overexpressed in mutated tumors (PTENMut) compared to PTENWT samples, and statistical analysis showed a significant relationship between TF expression and PTEN status (median 17370 vs 8530 transcripts/108 copies of 18S RNA P ⫽ 0.03) (Table 3). In contrast, no relationship between tumor heparanase mRNA levels and PTEN status was evidenced. Importantly, in lung tumors TF gene expression was also shown to increase progressively with the number of mutated genes. The median number of mRNA
transcripts (per 108 copies of 18S RNA) varied from 2700, for which no mutation was detected, to 13 700, 16 500, and 116 415 transcripts, for which 1, 2, and 3 TSG were mutated (P ⫽ 0.01) (Fig. 1A). In addition, codon 12 of KRAS was mutated in 8 tumors (Table 1), and this event in combination with other mutations also appeared to increase TF gene expression in cancerous tissues (Fig. 1C, D). No relationship was detected between heparanase mRNA levels and the number of oncogene mutations evidenced in lung tumors (Fig. 1B). COMPARATIVE ANALYSIS OF BIOLOGICAL DATA WITH CLINICOPATHOLOGICAL FEATURES AND SURVIVAL OF PATIENTS WITH NSCLC
As previously reported (4 ), TF gene expression was significantly higher in T3–T4 tumors (median 19 150 transcripts/108 copies of 18S RNA vs 8530 transcripts in T1–T2 tumors; P ⫽ 0.04) and in samples from paClinical Chemistry 55:10 (2009)
5
Survival probability
HPSE
1
TF
1
TF < Median
0.5
0.5
P = 0.29
TF > Median
P = 0.02 0 0
10
20
HPSE > Median
30
40
50
60
0
70
0
10
20
Months
1
PTEN
WT TP53
0.5 P = 0.05
40 50 60 Months
70
70
WT STK11
0.5 P = 0.87
Mut STK11
0
0 30
60
Mut PTEN
Mut TP53
20
50
STK11
P = 0.83
0 10
40
1
WT PTEN
0.5
0
30
Months
1
TP53
HPSE < Median
0
10
20
30 40 4 50 Months
60
70
0
10
20
30 40 50 Months
60
70
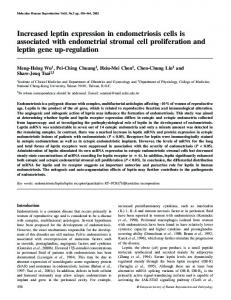
Fig. 2. Kaplan-Meier curves according to TF and HPSE gene expression in NSCLC tumors and to the status (WT or Mut) of TP53, PTEN, and STK11 TSG.
tients with stage III–IV (median 17 710 copies/108 copies of 18S RNA vs 9780 copies in stage I–II; P ⫽ 0.03), but no correlation with age was evidenced (P ⫽ 0.16, Mann–Whitney U-test). On the other hand, no relationship was evidenced between tumor heparanase mRNA levels and characteristics such as tumor size, stage of tumor, tumor differentiation, node involvement. and metastasis status (data not shown). In addition, none of the clinicopathological features analyzed was different in patients according to the status (i.e., mutated or not mutated) in cancerous tissues of the 3 TSG (Table 1). Survival curves were then analyzed according to median TF and heparanase mRNA levels measured in tumors and to TP53, STK11, and PTEN status (KaplanMeier analysis) (Fig. 2). The median time of follow-up was 35 months at the time of data analysis, and overexpression of the TF gene in lung tumors or the mutated status of TP53 was associated with a significantly shorter survival rate. Indeed, the median survival time was 26 months for patients with high tumor TF gene expression (above median) compared to 66 months for those in whom lower TF mRNA levels were measured in NSCLC tumors (hazard ratio 1.96, 95% CI 1.01–3.8; P ⫽ 0.02) (Fig. 2). In addition, the median survival time was 33 months for patients in whom TP53 was 6
Clinical Chemistry 55:10 (2009)
mutated in tumors, compared to 43 months for those without TP53 mutation (hazard ratio 1.5, 95% CI 1.02– 2.5; P ⫽ 0.05). In contrast, no significant difference in survival was found according to age, HPSE gene expression, or STK11 or PTEN gene status. Importantly, Cox regression analysis also demonstrated that high TF gene expression (above median) and TP53 mutation were independent risk factors for shortened survival time in patients with NSCLC (Table 4). Discussion TF, the well-known receptor for factor VIIa, is mainly involved in triggering the coagulation cascade, but it is also a signaling protein for the regulation of tumor cell movement, angiogenesis, and metastasis (24 ). TF is synthesized by a variety of cell types, including tumor cells, and is in part responsible for the prothrombotic state associated with many cancers. Several experimental models have provided evidence that genetic lesions affecting various oncogenes and TSG are associated with upregulation of TF, which in turn induces protumorigenic effects, independently of hemostasis activation (25 ). In the present study, we looked for changes in 3 TSG in patients with NSCLC, and we demonstrated
TF Expression and Oncogene Events in NSCLC
Table 4. Overall survival with univariate analysis (Kaplan Meier method) or multivariate analysis (Cox regression model). Univariate analysis
Multivariate analysis
Hazard ratio
95% CI
P
Relative risk
95% CI
P
Age
0.9
0.4–1.8
0.76
1.15
0.96–1.3
0.32
Stage
3.1
1.4–5.7
0.005
2.8
1.6–5.9
0.006
TF gene expression
1.96
1.01–3.8
0.02
2.2
1.1–4.2
0.03
Heparanase gene expression
1.6
0.32–1.34
0.29
1.1
0.7–1.7
0.75
TP53 status
1.5
1.02–2.5
0.05
1.8
1.2–4.5
0.02
that mutations in TP53 and PTEN genes are associated with significant increase in TF gene expression in lung tumors. TF is frequently upregulated in cancer cells, particularly in the later stages of disease progression (26 ), and we recently reported that TF gene expression was higher in advanced stages of NSCLC and when codon 12 of the KRAS gene was mutated (4 ). Both TF expression and TF procoagulant and proangiogenic activity have previously been shown to be regulated by mutations of the KRAS oncogene and TP53 tumor suppressor gene in human colorectal cell lines (5 ). In addition, these oncogenic events were associated with increased release of TF-bearing microvesicules, which contributes to the high risk of thrombosis associated with colorectal cancer (27 ). TP53 mutations are the most frequent gene abnormalities identified in 50% to 70% of NSCLC, with variations related in part to smoking profiles of affected patients (28 ). In this study, we sequenced exons 5– 8 of the TP53 gene, a mutational hot-spot region, and we identified mutations in 37.7% of lung tumors, results that are in agreement with previous reports (29 ). Importantly, a significant shortening of survival in patients with TP53 mutations was also evidenced compared to cases without mutation (relative risk 1.8; 95% CI 1.2– 4.5; P ⫽ 0.02, multivariate analysis), as previously shown (29, 30 ). Shorter survival time was also associated with high tumor TF expression (relative risk 2.2, 95% CI 1.1– 4.2; P ⫽ 0.03), and these results strongly support a pathogenic relationship between TP53 and TF in lung tumorigenesis in vivo. Apart from the role of KRAS, it has also been demonstrated that inactivation of PTEN in human glioma cells also resulted in upregulation of TF, particularly under hypoxic conditions that potentially have a critical role in lung cancer (6 ). The changes in PTEN identified in lung tumors in our study were mainly deletions/mutations present in 37.7% of patients. This frequency appears higher than previously reported (31 ), but we used the recently devel-
oped MLPA technique that is very sensitive to a variety of gene changes, including deletions and mutations (32, 33 ). On the other hand, PTEN protein production was previously found to be reduced in most lung cancers, although hypermethylation of the PTEN promoter was evidenced in 26% of tumors and loss of heterozygosity was rare, affecting ⬍20% of samples (34 ). Mechanisms other than epigenetic silencing and deletions are therefore probably involved in reducing PTEN protein production. PTEN inactivation is a crucial event in the progression of lung tumorigenesis initiated by KRAS (35 ), and our results also suggest that it may affect TF synthesis in NSCLC tumors. Other oncogenic events may also be involved in regulating TF gene expression, however, and we therefore looked for mutations in STK11, a recently identified TSG that is important in NSCLC (36 ). This enzyme has a major role in various cellular pathways (37 ), and inactivation of somatic mutations of STK11 has been reported in primary lung carcinomas and in cell lines (38 ). STK11 status was analyzed in our study by MLPA, as recently described (8 ), and gene changes were found in 39% of tumors, including all histologic subtypes of NSCLC. These results are in accordance with those of previous studies (7, 8 ), although STK11 modifications were not more frequent in lung tumors with KRAS mutations, as was previously found with cell lines (7 ), but the number of samples studied was possibly not sufficient to address this issue. Ji et al. recently developed a KRAS-driven model of mouse lung cancer (8 ), and they showed a strong cooperation between KRAS mutation and loss of p53 upon pulmonary tumorigenesis in the presence of homozygous inactivation of STK11. According to our results, somatic STK11 lesions did not affect TF gene expression in human lung tumors when present alone. However, an effect of mutated STK11 cannot be excluded, because a progressive increase in TF mRNA levels was found when STK11 was associated with mutations of TP53 or PTEN in cancerous tissues. Clinical Chemistry 55:10 (2009)
7
Importantly, this increase in TF gene expression associated with combined TSG mutations (P ⫽ 0.01, Fig. 1A) appeared to be amplified when codon 12 of KRAS was also mutated (P ⬍ 0.001, Fig. 1D). However, no effect on tumor TF gene expression of one particular combination could be evidenced (Fig. 1D) owing to the limited number of samples studied. This result supports the important concept that sequential changes in several oncogenes and TSG are often necessary for alteration of the cancer cell phenotype and progression of malignant tumors. We also studied the presence of heparanase protein, which was found to be comparable in lung tumors and in nonaffected lungs. In addition, heparanase mRNA levels did not correlate with TF gene expression. Heparanase is constitutively synthesized in various normal cells and tissues such as the placenta, keratinocytes, platelets and cells of the immune system, but the HPSE gene has also been shown to be upregulated in cancer as well in inflammation and wound healing (10 ). HPSE gene transcription can be regulated by promoter methylation, early growth response 1 (EGR1), and TP53 in human tumors, but these are unlikely to be involved in NSCLC because mRNA levels measured in lung tumors were not higher than those of noncancerous lungs. The first study that focused on heparanase in NSCLC was performed in 76 Japanese patients and showed that heparanase activity was significantly higher in lung tumors than in nonaffected tissues (39 ). More importantly, the disease-free survival was significantly reduced in patients with increased heparanase activity. Recently, another study also revealed that heparanase protein measured by immunohistochemistry was increased in 75% of patients with lung cancer and correlated with lymph node invasion and metastasis (40 ). Results from these 2 studies therefore support indications that molecular techniques have potential limitations in investigating the role of heparanase in cancer progression compared to methods measuring protein mRNA expression. Indeed, in our study mRNA levels were relatively low in lung tumors, and posttranslational events regulating heparanase processing and cellular localization and secretion are thus probably other key mechanisms that are involved in NSCLC and explain the increased protein that has been previously found. In this regard, Cohen et al. also showed that the cellular localization of heparanase in cancerous cells was critical in patients with lung tumors, a nuclear localization of the enzyme being associated with a more favorable outcome (40 ). As with many cancers, in NSCLC the survival of patients is related to tumor growth and metastasis, and TF overexpression has been shown to influence 8
Clinical Chemistry 55:10 (2009)
these processes in various human malignancies (26 ). Our results are the first to demonstrate a link between TF gene expression and the status of TP53 and PTEN TSG in NSCLC, and to establish a relationship between TF expression and the survival of affected patients. Such a relationship has been previously evidenced with cell lines and animal models in colorectal cancer (5 ) and glioma (6 ). Because TP53, together with PTEN and STK11, regulate the mammalian target of rapamycin (mTOR) pathway, we can hypothesize that upregulation of TF gene expression in NSCLC results from an impairment of this effect. The formation of TF/FVIIa complexes activates the mTOR pathway (41 ), which consists of PI3K and Akt, and in turn may influence proliferation, invasiveness, metastasis spread, and tumor angiogenesis in lung carcinogenesis (28 ). In addition, the mTOR pathway is also activated by the binding of epidermal growth factor to epidermal growth factor receptor in lung cancer cells (28 ), and mutations of epidermal growth factor receptor (erythroblastic leukemia viral (v-erb-b) oncogene homolog, avian) (EGFR) and PTEN genes have been recently identified as being responsible for TF upregulation in glioblastoma (42 ). TF may therefore contribute to lung tumor development, and the possibility of targeting this receptor in the treatment of NSCLC to enhance the efficacy of inhibitors of mTOR or epidermal growth factor receptor warrants further investigation.
Author Contributions: All authors confirmed they have contributed to the intellectual content of this paper and have met the following 3 requirements: (a) significant contributions to the conception and design, acquisition of data, or analysis and interpretation of data; (b) drafting or revising the article for intellectual content; and (c) final approval of the published article. Authors’ Disclosures of Potential Conflicts of Interest: Upon manuscript submission, all authors completed the Disclosures of Potential Conflict of Interest form. Potential conflicts of interest: Employment or Leadership: None declared. Consultant or Advisory Role: None declared. Stock Ownership: None declared. Honoraria: None declared. Research Funding: This study was supported by the Institut pour la Recherche sur la Thrombose et l’He´mostase. Expert Testimony: None declared. Role of Sponsor: The funding organizations played no role in the design of study, choice of enrolled patients, review and interpretation of data, or preparation or approval of manuscript. Acknowledgments: We thank Prof. S. Guyetant, Dr. C. Ble´chet (Department of Pathology), and Prof. P. Dumont (Department of thoracic surgery, Tours Hospital, France) for their help. We also thank Dr. B. Giraudeau for helping with the statistical analysis and D. Raine for editing the English.
TF Expression and Oncogene Events in NSCLC
References 1. Stewart BW, Kleihues P, eds. World cancer report 2003. Lyon: IARC press; 2003. 2. Monroe DM, Key NS. The tissue factor-factor VIIa complex: procoagulant activity, regulation, and multitasking. J Thromb Haemost 2007;5:1097– 105. 3. Rak J, Milsom C, Yu J. Tissue factor in cancer. Curr Opin Hematol 2008;15:522– 8. 4. Regina S, Rollin J, Blechet C, Iochmann S, Reverdiau P, Gruel Y. Tissue factor expression in nonsmall cell lung cancer: relationship with vascular endothelial growth factor expression, microvascular density, and K-ras mutation. J Thorac Oncol 2008;3:689 –97. 5. Yu JL, May L, Lhotak V, Shahrzad S, Shirasawa S, Weitz JI, et al. Oncogenic events regulate tissue factor expression in colorectal cancer cells: implications for tumor progression and angiogenesis. Blood 2005;105:1734 – 41. 6. Rong Y, Post DE, Pieper RO, Durden DL, Van Meir EG, Brat DJ. PTEN and hypoxia regulate tissue factor expression and plasma coagulation by glioblastoma. Cancer Res 2005;65:1406 –13. 7. Matsumoto S, Iwakawa R, Takahashi K, Kohno T, Nakanishi Y, Matsuno Y, et al. Prevalence and specificity of LKB1 genetic alterations in lung cancers. Oncogene 2007;26:5911– 8. 8. Ji H, Ramsey MR, Hayes DN, Fan C, McNamara K, Kozlowski P, et al. LKB1 modulates lung cancer differentiation and metastasis. Nature 2007;448: 807–10. 9. Vlodavsky I, Ilan N, Naggi A, Casu B. Heparanase: structure, biological functions, and inhibition by heparin-derived mimetics of heparan sulfate. Curr Pharm Des 2007;13:2057–73. 10. Ilan N, Elkin M, Vlodavsky I. Regulation, function and clinical significance of heparanase in cancer metastasis and angiogenesis. Int J Biochem Cell Biol 2006;38:2018 –39. 11. Baraz L, Haupt Y, Elkin M, Peretz T, Vlodavsky I. Tumor suppressor p53 regulates heparanase gene expression. Oncogene 2006;25:3939 – 47. 12. de Mestre AM, Rao S, Hornby JR, Soe-Htwe T, Khachigian LM, Hulett MD. Early growth response gene 1 (EGR1) regulates heparanase gene transcription in tumor cells. J Biol Chem 2005; 280:35136 – 47. 13. Nadir Y, Brenner B, Zetser A, Ilan N, Shafat I, Zcharia E, et al. Heparanase induces tissue factor expression in vascular endothelial and cancer cells. J Thromb Haemost 2006;4:2443–51. 14. Vlodavsky I, Michaeli RI, Bar-Ner M, Fridman R, Horowitz AT, Fuks Z, et al. Involvement of heparanase in tumor metastasis and angiogenesis. Isr J Med Sci 1988;24:464 –70. 15. Yang Y, Macleod V, Bendre M, Huang Y, Theus AM, Miao HQ, et al. Heparanase promotes the spontaneous metastasis of myeloma cells to
bone. Blood 2005;105:1303–9. 16. Beasley MB, Brambilla E, Travis WD. The 2004 World Health Organization classification of lung tumors. Semin Roentgenol 2005;40:90 –7. 17. Sobin LH. Lung and pleural tumours. In: Sobin LH, Wittekind C, eds. TNM classification of malignant tumours. New York: Wiley-Liss; 2002. p 97–108. 18. Rollin J, Iochmann S, Blechet C, Hube F, Regina S, Guyetant S, et al. Expression and methylation status of tissue factor pathway inhibitor-2 gene in non-small-cell lung cancer. Br J Cancer 2005;92: 775– 83. 19. Uno F, Fujiwara T, Takata Y, Ohtani S, Katsuda K, Takaoka M, et al. Antisense-mediated suppression of human heparanase gene expression inhibits pleural dissemination of human cancer cells. Cancer Res 2001;61:7855– 60. 20. Jeuken J, Cornelissen S, Boots-Sprenger S, Gijsen S, Wesseling P. Multiplex ligation-dependent probe amplification: a diagnostic tool for simultaneous identification of different genetic markers in glial tumors. J Mol Diagn 2006;8:433– 43. 21. Soria JC, Lee HY, Lee JI, Wang L, Issa JP, Kemp BL, et al. Lack of PTEN expression in non-small cell lung cancer could be related to promoter methylation. Clin Cancer Res 2002;8:1178 – 84. 22. Medina PP, Romero OA, Kohno T, Montuenga LM, Pio R, Yokota J, et al. Frequent BRG1/ SMARCA4-inactivating mutations in human lung cancer cell lines. Hum Mutat 2008;29:617–22. 23. Hamroun D, Kato S, Ishioka C, Claustres M, Beroud C, Soussi T. The UMD TP53 database and website: update and revisions. Hum Mutat 2006; 27:14 –20. 24. Belting M, Ahamed J, Ruf W. Signaling of the tissue factor coagulation pathway in angiogenesis and cancer. Arterioscler Thromb Vasc Biol 2005;25:1545–50. 25. Rak J, Klement P, Yu J. Genetic determinants of cancer coagulopathy, angiogenesis and disease progression. Vnitr Lek 2006;52(suppl 1):135– 8. 26. Milsom C, Yu J, May L, Magnus N, Rak J. Diverse roles of tissue factor-expressing cell subsets in tumor progression. Semin Thromb Hemost 2008; 34:170 – 81. 27. Hron G, Kollars M, Weber H, Sagaster V, Quehenberger P, Eichinger S, et al. Tissue factorpositive microparticles: cellular origin and association with coagulation activation in patients with colorectal cancer. Thromb Haemost 2007; 97:119 –23. 28. Herbst RS, Heymach JV, Lippman SM. Lung cancer. N Engl J Med 2008;359:1367– 80. 29. Soussi T, Beroud C. Assessing TP53 status in human tumours to evaluate clinical outcome. Nat Rev Cancer 2001;1:233– 40. 30. Ludovini V, Pistola L, Gregorc V, Floriani I, Rulli E,
31.
32.
33.
34.
35.
36.
37.
38.
39.
40.
41.
42.
Piattoni S, et al. Plasma DNA, microsatellite alterations, and p53 tumor mutations are associated with disease-free survival in radically resected non-small cell lung cancer patients: a study of the perugia multidisciplinary team for thoracic oncology. J Thorac Oncol 2008;3:365– 73. Forgacs E, Biesterveld EJ, Sekido Y, Fong K, Muneer S, Wistuba II, et al. Mutation analysis of the PTEN/MMAC1 gene in lung cancer. Oncogene 1998;17:1557– 65. Sellner LN, Taylor GR. MLPA and MAPH: new techniques for detection of gene deletions. Hum Mutat 2004;23:413–9. Eldering E, Spek CA, Aberson HL, Grummels A, Derks IA, de Vos AF, et al. Expression profiling via novel multiplex assay allows rapid assessment of gene regulation in defined signalling pathways. Nucleic Acids Res 2003;31:e153. Marsit CJ, Zheng S, Aldape K, Hinds PW, Nelson HH, Wiencke JK, et al. PTEN expression in nonsmall-cell lung cancer: evaluating its relation to tumor characteristics, allelic loss, and epigenetic alteration. Hum Pathol 2005;36:768 –76. Iwanaga K, Yang Y, Raso MG, Ma L, Hanna AE, Thilaganathan N, et al. Pten inactivation accelerates oncogenic K-ras-initiated tumorigenesis in a mouse model of lung cancer. Cancer Res 2008; 68:1119 –27. Shah U, Sharpless NE, Hayes DN. LKB1 and lung cancer: more than the usual suspects. Cancer Res 2008;68(10):3562–5. Alessi DR, Sakamoto K, Bayascas JR. LKB1dependent signaling pathways. Annu Rev Biochem 2006;75:137– 63. Sanchez-Cespedes M, Parrella P, Esteller M, Nomoto S, Trink B, Engles JM, et al. Inactivation of LKB1/STK11 is a common event in adenocarcinomas of the lung. Cancer Res 2002;62:3659 – 62. Takahashi H, Ebihara S, Okazaki T, Suzuki S, Asada M, Kubo H, et al. Clinical significance of heparanase activity in primary resected non-small cell lung cancer. Lung Cancer 2004;45:207–14. Cohen E, Doweck I, Naroditsky I, Ben-Izhak O, Kremer R, Best LA, et al. Heparanase is overexpressed in lung cancer and correlates inversely with patient survival. Cancer 2008;113:1004 –11. Jiang X, Zhu S, Panetti TS, Bromberg ME. Formation of tissue factor-factor VIIa-factor Xa complex induces activation of the mTOR pathway which regulates migration of human breast cancer cells. Thromb Haemost 2008;100:127–33. Rong Y, Belozerov VE, Tucker-Burden C, Chen G, Durden DL, Olson JJ, et al. Epidermal growth factor receptor and PTEN modulate tissue factor expression in glioblastoma through JunD/activator protein-1 transcriptional activity. Cancer Res 2009;69:2540 –9.
Clinical Chemistry 55:10 (2009)
9