Abstract. When searching databases of nucleotide or protein sequences, finding a local alignment of two sequences is one of the main tasks. Since the sizes of ...
Index-based Approach approach to Index-Based to similarity Similarity search Searchinin protein and and Nucleotide nucleotide databases Protein Databases David Hoksza and Tom´ aˇs Skopal David Hoksza and Tom´aˇs Skopal Department of software engineering, Faculty of Mathematics and Physics, Department of software engineering, Faculty of Mathematics and Physics, Charles University in Prague Charles University in Prague Malostransk´e n´ am. 25, 118 00, Prague 1, Czech Republic Malostransk´ e n´ am. 25,tomas.skopal}@mff.cuni.cz 118 00, Prague 1, Czech Republic {david.hoksza, {david.hoksza, tomas.skopal}@mff.cuni.cz
Abstract. When searching databases of nucleotide or protein sequences, finding a local alignment of two sequences is one of the main tasks. Since the sizes of available databases grow constantly, the efficiency of retrieval methods becomes the critical issue. The sequence retrieval relies on finding sequences in the database which align best with the query sequence. However, an optimal alignment can be found in quadratic time (by use of dynamic programming) while this is infeasible when dealing with large databases. The existing solutions use fast heuristic methods (like BLAST, FASTA) which produce only an uncontrolled approximation of the best alignment and even do not provide any information about the alignment approximation error. In this paper we propose an approach of exact and approximate indexing using several metric access methods (MAMs) in combination with the TriGen algorithm, in order to reduce the number of alignments (distance computations) needed. The experimental results have shown that a straightforward adoption of MAMs to sequence retrieval cannot outperform the specialized heuristic algorithms (at least at the moment). On the other side, the results show MAMs could provide a basis for specialized access methods capable of precision/efficiency trade-off control.
Keywords: bioinformatics, indexing, database, MAM, (P)M-tree, TriGen, BLAST
1
Introduction
When managing biological sequence information, it is important to realize that organisms linked by common descent use similar genes to secure their biological functions. Therefore, it makes sense to store known genetic sequences in a database and search for similarities among them. Because these databases grow quickly in time and due to expensive comparison of sequences, there is a strong need for efficient methods capable of handling such amounts of data. One way to handle the increasing number of sequences is indexing, which is unavoidable in today’s situation of exponentially growing databases to be searched (Figure 1). There have appeared indexing applications in this area already, however, they usually tried to split sequences into q-grams (substrings
J. Pokorn´ y, V. Sn´ aˇsel, K. Richta (Eds.): Dateso 2007, pp. 67–80, ISBN 80-7378-002-X.
68
David Hoksza, Tom´ aˇs Skopal
of length q) [14] and compute simple Hamming distance [21] on them. This is inappropriate in many cases because of neglecting the evolutionary nature of similarity in protein and nucleotide sequences. As an other disadvantage, some information is lost when cutting sequences into q-grams and computing distances just among these q-grams. Some efforts have also been undertaken in order to develop non-hamming distance which reflects better biological meaning of similarity [23], while such a distance has been used to index q-grams [11]. Anyway, today’s most used methods for sequence retrieval are based on BLAST - a heuristic approach supporting local alignment (described in Section 2.2).
1.1
Protein Databases
DNA molecules consist of a linear (unbranched) string of nucleotides (conventionally labeled A, C, G, T) which can be transcribed to RNA and later translated to proteins. A protein molecule is a linear chain of amino acids. There are 20 amino acids, each encoded by a triplet of nucleotides (called codon). The assignment between codons and amino acids is determined by an evolutionarily fixed code table – the genetic code. Every protein has some biological activity which is derived from its three-dimensional structure. Similar amino acid sequences tend to have similar three-dimensional structure and therefore similar function1 . When a protein sequence is determined (nowadays it is usually derived from an experimentally obtained sequence of the corresponding gene), its function is usually unknown. One should try to find similar proteins in the database of already known protein sequences (even in proteins of different species) to find out possible purpose of the newly sequenced protein or at least to get a clue of it. Therefore, it is appropriate to search through as large amount of data as possible to increase the probability of finding similar protein.
1.2
Nucleotide (DNA) Databases
Using nucleotide databases is not as common as using protein databases2 . They are searched only for similarities among sequences of one species (unlike protein databases) which follows from the aims why they are analyzed, i.e. – finding similarities in parts of nucleotide sequences which are not transcribed to mRNA (non-coding sequences) – checking whether someone else has already sequenced given segment of DNA – checking whether given segment was sequenced incorrectly 1
2
Moreover more extensive sequence similarity can be viewed as evidence of common ancestry, and therefore as a basis for reconstructing phylogenetic history of organisms and their genes. which is the reason why we have tested our method for protein sequences only, but it can be used for nucleotide sequences without any change at all.
Index-Based Approach to Similarity Search in Protein and Nucl. Databases
1.3
69
Existing Prominent Databases
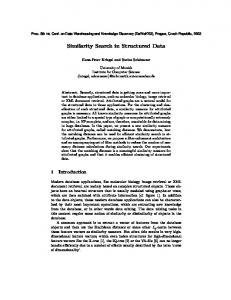
As comes out from previous, the role of databases in bioinformatics is of major importance. Nowadays, there exist three most prominent databases of sequences – American GenBank [8], European EMBL [2] (European Molecular Biology Laboratory Data) and Japanese DDBJ [1] (DNA Data Bank of Japan), which are not moderated (means that anybody well-founded can add a sequence into). Besides these databases, there exist several other (mostly protein) databases. In our experiments we used the Swiss-Prot [4] – a moderated database of proteins. The Swiss-Prot together with TrEMBL (TRanslated EMBL) and PIR (Protein Information Resource) constitute the UniProt database [22], which serves as a central repository of protein sequences and their functions. As we can see in Figure 1, the size of databases grows exponentially in time, so the needs for more efficient methods grow as well. Swiss-Prot growth Aminoacids (millions) Sequences (10 thousands)
80
65
90
GenBank growth
70 0
0
5
10
20
15
30
25
40
35
50
45
60
55
Base pairs of DNA (billions) Sequences (millions)
1982
1986
1990
1994
1998
2002
Year
2006
1986
1990
1994
1998
2002
2006
Year
Fig. 1. Nucleotide and protein databases growth
2
Similarity Search in Sequence Databases
When searching for similarity between two sequences, there are three methods: – analysis of the dot matrix – dynamic programming solution – heuristic methods using q-grams All these methods compute a kind of biological similarity between two sequences. The similarity of two sequences is defined by an optimal alignment of them. An alignment of two3 sequences is every such correspondence between letters in both (sub)sequences (one written under the other), which can be achieved by inserting gaps into either sequence. Naturally, among all possible alignments we are interested in an optimal one – which is the alignment with best realvalue score (interpreted as sequence similarity). A particular method of scoring 3
There can be also multiple sequences mutually aligned for some purposes, but this is out of scope of this paper.
70
David Hoksza, Tom´ aˇs Skopal
an alignment changes with method used (see next subsections), however, it is always a sum over the scores between aligned letters/gaps. Consequently, the similarity assessment (score of alignment) can be used in retrieval of sequences from a database similar to a query sequence. 2.1
Dot Matrix Method
A dot matrix (dotplot) analysis is a method for finding possible alignments of two sequences. In the dot matrix analysis we mark each of the axes with one amino acid sequence and then mark each position in the matrix where the two sequences match (have the same letters on given positions). Matching segments can then be seen as diagonal rows of dots going from left (see Figure 2).4 This algorithm can be improved by use of sliding windows of given length5 (see Figure 2a,b). The window is successively placed to every position, while the window on every position is checked for a diagonal occurrence. If the number of matching letters in both sequences is above a fixed threshold (possibly according to a scoring matrix, see below), then a dot is placed on the position of the upper left corner of the window. Subsequently, short diagonals in the resulting plot can be filtered out for better transparency(Figure 2c). Afterwards, the dot matrix is visually checked for diagonals long enough to be used as candidates for even longer alignment. Pairs of sequences showing sufficient similarity are then further inspected with some other techniques (e.g. tools using dynamic programming). ARIPETIQIZLASTPFPTEA A • • R • • I • • P • E T • • I • Q • I • Z L • • A • • S • • T P • F • • P • • • T • E A
ARIPETIQIZLASTPFPTEA A • • R • • I • • • P • • • E T • • I • Q • I • Z L • • A • • S • • • T • P • • F • • P • • T • • • E • • A
ARIPETIQIZLASTPFPTEA A • R • • I • • P • E T • I • Q • I • Z L • A • • • • S T • P F P • T • E • A
(a)
(b)
(c)
Fig. 2. Dot matrix
The dot matrix method is appropriate for visualisation and manual analysis of partial alignments of two sequences, but it does not give us the optimal alignment – especially if an alignment with gaps is our goal. To solve this problem, there exist algorithms based on dynamic programming which can compute optimal alignment with gaps in O(mn) (where m, n are sequence lengths) time. 4
5
This method can also be used to finding reverse matchings (diagonals go from right to left in that case). When comparing nucleotide sequences, longer windows are used.
Index-Based Approach to Similarity Search in Protein and Nucl. Databases
71
With minor changes one can use the same algorithm for finding both, global and local alignment. A global alignment of sequences is such an alignment where the whole sequences must be aligned, whereas a local alignment methods look for best alignment for any subsequences of the input sequences. First of all we need to define a distance to measure similarity between two sequences (possibly by use of an alignment). The simplest is the Hamming distance (HD) which is defined on two strings of equal lengths, and computes the number of positions for which the corresponding symbols are different. Because HD is a metric, it is often used when indexing sequences split to q-grams. The Hamming distance is not suitable because it is sensitive to shifts in sequences. Therefore, a better measure is the Levenshtein (or edit) distance given by the minimum number of operations needed to transform one sequence into the other, where an operation is an insertion, deletion, or replacement of a single letter. The Levenshtein distance can be further extended with operation weights. Every replacement, insertion or deletion can be penalized by a constant value. Such an extended edit distance is called weighted edit distance. However, when considering DNA or protein sequences, even weighted edit distance is not suitable. The reason is that probability of mutations from one amino acid into another (appearing in an alignment) is dependent on the two particular amino acids involved (the same holds for nucleotides but this is not so often used, since there are only four of them). To deal with this fact, a scoring matrix is used which is a 20 × 20 square matrix where on position [i, j] is the so-called weight of mutation of amino acid i into amino acid j (if we use identity matrix we get an ordinary edit distance). There are many different scoring matrices used for different purposes (e.g. PAM matrices [7], BLOSUM matrices[9], etc.). The scoring matrices used in bioinformatics contain scores interpreted as similarity of two amino acids/nucleotides, so instead of distance measures we speak about similarity measures (where the greater overall scores stand for greater overall similarity). Hence, as opposite to Hamming or edit distance, an optimal scored alignment is the one with highest overall score (see Figure 3).
Fig. 3. Global and local alignment (and their scores) of protein sequences NPHGIIMGLAE and HGLGL according to BLOSUM62 scoring matrix
Global Alignment Measures. As mentioned earlier, there exist algorithms for both, global and local alignment (see Figure 3). The first algorithm for global alignment was published in 1970 by Needleman and Wunsch [13]. It makes use of distance matrix where on one side of the matrix is the first sequence and on the other the second one. We define a cell si,j = [i,j] of the matrix as the optimal (maximal) score which belongs to prefixes of lengths i and j of the aligned sequences. The recursive formula for filling distance matrix’s cell is:
72
David Hoksza, Tom´ aˇs Skopal
si,j
si−1,j + σ = max si,j−1 + σ si,j + δ(ai , bj )
(1)
where a and b represent the sequences to be aligned, σ is a score for gaps and δ is scoring matrix. Since [i, j] contains the score of global alignment of the i-long prefix of a and j-long prefix of b, the cell [|a|, |b|] contains the alignment score for the whole sequences a, b. Local Alignment Measures. Since we are more interested in matching subsequences, the local alignment is applied more often in computing similarity between biological sequences6 . Local alignment of sequences a and b is finding a subsequence S(a) of sequence a and a subsequence S(b) of sequence b, such that global alignment of S(a) and S(b) provides the highest score. The algorithm for local alignment can be seen as a modification of Needleman-Wunsch and was published in 1981 by Smith and Waterman [20]. It modifies filling of the distance matrix by not allowing negative values. The optimal local alignment score is then the maximum value in the distance matrix, which means there is no way to increase the score with extending (or cutting) either of the two subsequences. The recursive formula is adjusted in the following way: 0 si−1,j + σ (2) si,j = max si,j−1 + σ si,j + δ(ai , bj ) Finally, there is usually another modification which enables differentiating between the opening and extending gap. Extending a gap is considerable less penalized than opening a gap (i.e. two single gaps in alignment are more penalized than a single two-letter gap). 2.2
Heuristic Approaches to Retrieval of Similar Sequences
The Smith-Watterman (SW) algorithm gives the optimal solution to local alignment but it is computationally expensive. Hence, there have been developed cheaper heuristics which approximate the optimal local alignment. The first wide-spread method of this type was the FASTA [15], which used short local alignments as seeds that were further extended on both sides. Nowadays, BLAST (Basic Local Alignment Tool) [3] algorithm is widely used, because in most cases it is faster then FASTA and gives better results (suffers from less false dismissals with respect to sequential retrieval using Smith-Watterman alignment). In short, the BLAST algorithm can be described as follows: 1. Remove low complexity regions from the query sequence (those with no meaningful alignment). 6
Global alignment could damage alignment of perfectly conserved domain.
Index-Based Approach to Similarity Search in Protein and Nucl. Databases
73
2. Generate all n-grams substrings of length n from query sequence. 3. Compute the similarity for every sequence of length n (on a given alphabet) and each n-gram from the previous step. 4. Filter out sequences with similarity lower than a cut-off score (called neighborhood word score threshold). 5. Remaining high-scoring sequences (organized in search tree) are then used to search all database sequences for exact match. 6. High-scoring sequences within a given distance (those on the same diagonal if we imagine sequences in dot matrix) are then connected together with gapped alignment and these are being extended as long as the score grows7 . Such alignments are called high scoring pairs (HSP). 7. All HSPs with scores below a given threshold are excluded. 8. The scores of non-filtered sequences are refined by the classic Smith-Watterman algorithm. Statistical Relevance. Because of the heuristic nature of BLAST, it is important to have a method saying how good the found hits are (however, there is no way to determine the retrieval error, say precision/recall in IR terminology). We are also interested in determining whether the retrieved alignments are some coincidence, or whether they really refer to a biological relation. The local alignments are statistically well understood, so we are able to say how relevant the retrieved sequences are. This statistic evidence fits primarily to ungapped local alignment, but it has been shown (mostly by computational experiments) that it applies to gapped alignments, too. We are interested whether the resulting score (either Smith-Watterman (SW) or any other) has any statistical significance (otherwise the score alone is just a number), hence, we have to take the score distribution into account, considering the entire sequence space and a particular scoring matrix. We can derive an expected number of sequences of lengths m and n with score at least S as E = Kmne−λS
(3)
where K and λ are characteristics of the SW score distribution. The E formula is called the E-value for the score S [10]. The E-value as defined above does not take into consideration dealing with more than two sequences, however, we should additionally take into account the fact that probability of finding a sequence with given score depends also on the number of sequences in the database or/and the query length. In order to prevent the effect that finding a short sequence with given E-value has the same probability as finding a longer sequence with the same E-value, we should multiply the E-value by the total number of residues (letters) in the database and obtain a new E-value (used by FASTA). Alternatively, instead of multiplying the E-value by database size, we could adjust the E-value by distinguishing different sequence lengths, since a query is more likely to be related to a long sequence than to a shorter one (used by BLAST). 7
This applies to BLAST2 - previous versions of BLAST did not connect sequences on diagonals (and therefore used higher value for cut-off score in step 4).
74
3
David Hoksza, Tom´ aˇs Skopal
Metric Sequence Indexing & Search
Since a particular method of sequence alignment can be viewed as a non-metric distance/similarity measure, we had an idea to turn it into a distance metric δ, which satisfies the metric properties (reflexivity, non-negativity, symmetry and triangle inequality). Such a metric could be then utilized by various metric access methods (MAMs) which have been designed to quickly search in databases modeled in metric spaces [24]. Their common characteristics reside in utilizing the triangle inequality to organize the database into metric regions, so that when a query is processed (the metric space is queried for objects falling into the query region), only the overlapping regions need to be searched. Basically, the MAMs are designed to support range query and k-nearest neighbors (kNN) query. A range query is defined by a center object and a query radius, so we ask for objects which are within a predefined distance from the query object. On the other hand, a kNN query asks for k nearest objects to the query object. Both range and kNN queries are represented by ball query regions (the radius of kNN ball is the distance to the k nearest neighbor), thus the searching by MAMs is reduced to a geometric problem (searching for database objects falling into the query regions/balls). 3.1
Creating the Metric
First, we have to decide which sequence similarity measure should be used. The simplest solution would be the Smith-Waterman (SW) score. However, the problem with SW is that it is similarity measure, not a distance (greater scores mean higher similarities). Another problem is that SW lacks statistical significance. Therefore, the use of E-value is much better, since it is a distance and it is also widely used in ranking the results retrieved by FASTA or BLAST. Due to this choice, we can also compare our approach to the other methods. If we want to use E-value for metric indexing, we need an equivalent metric. As defined, the original E-value satisfies just the non-negativity property, but it can be easily modified to satisfy also reflexivity and symmetry. To enforce reflexivity, the definition of E-value can be modified in a way that identical sequences have a zero E-value. This is not a problem because two identical sequences are also most similar in mathematical and biological meaning (no other sequence can be more similar). To satisfy the symmetry, we have to accomplish a more substantial change. As mentioned in Section 2.2, the BLAST’s modification of E-value takes into account the total number N of residues (letters) in database and the length n of inspected database sequence, as follows: E = Kmne−λS N/n
(4)
If we change the role of query and database sequence, we get different values. So we changed E-value to the following form: E = Kmne−λS N/max(m, n)
(5)
Index-Based Approach to Similarity Search in Protein and Nucl. Databases
75
where m is the length of query sequence. This is a minor change in statistical relevance if we realize that an average length of query is very similar to the average length of database sequences. As mentioned before, e.g. FASTA does not take sequence lengths into account at all. TriGen Algorithm. Up to now, we have turned the E-value into a semimetric (reflexive, non-negative, symmetric distance). The last step is to enforce the triangle inequality, which is the hardest part. For this purpose we can use the TriGen algorithm [17] designed for general-purpose modifications of unknown semi-metrics into metrics (or approximations of metrics). Moreover, using TriGen we can specify (by so-called T-error tolerance) to what extent the resulting modified distance may violate the triangle inequality. While distances modified into full metrics guarantee 100% precision of indexing by MAMs with respect to the precision of sequential search, a modification which is only an approximation of metric (more or less violating the triangle inequality) exhibits lower intrinsic dimensionality [5] (i.e. better indexability) at the expense of lower precision of indexing/retrieval. In principle, the TriGen algorithm applies a class of concave modifiers such that the input semi-metric (violating triangle inequality) becomes a metric (or semi-metric where the extent of triangle violation is reduced). 3.2
LAESA
The LAESA method [12] is a typical pivot-based MAM. In principle, m database objects are selected to act as so-called pivots. Then each of the n database objects to be inserted is mapped using this pivots into a vector of dimension m, where into i-th coordinate the distance of the inserted object to the i-th pivot is computed and stored. This way we obtain an n × m distance matrix which serves as a metric index. Whenever a query is to be processed, the query object is projected into the pivot space the same way as if it would be inserted. Then the distance matrix is sequentially searched and all the vectors which do not overlap the query region in the pivot space are filtered out. The remaining candidate objects (corresponding to the non-filtered vectors) are subsequently filtered in the original metric space. The LAESA method is very powerful in its pruning effectiveness, however, due to expensive selection of pivots and due to the sequential processing of distance matrix its usage in dynamic database environments is limited. 3.3
M-tree & PM-tree
A typical tree-based MAM designed for database environments is the M-tree [6]. The concept of M-tree is a kind of generalization of R-tree into metric spaces. Instead of R-tree’s MBRs, the M-tree recursively bounds the objects into balls specified by a center data object and a ball radius (unlike R-tree the M-tree cannot create a synthetic centroid, it must pick one of the indexed objects). The inner nodes of an M-tree index contain routing entries, consisting of a region ball
76
David Hoksza, Tom´ aˇs Skopal
and a pointer to the subtree (all objects in a subtree must fall into the parent region ball). The leaf nodes contain ground entries – the DB objects themselves. For an M-tree hierarchy see an example in Figure 4a. A range query in M-tree is processed by processing just the nodes the region ball of which overlaps the query ball. A kNN query processing is similar, however, the radius of query ball is unknown at the beginning, so it must be heuristically updated during query evaluation.
Fig. 4. (a) M-tree (b) PM-tree
As a combination of LAESA and M-tree, the PM-tree [16, 19] makes use of both, LAESA’s pivot-based indexing and M-tree’s hierarchical metric space partitioning. The main difference is that the routing entries contain also a set of m1 ≤ m rings (related to m1 of total pivots) which prune the region ball, thus, the total ”volume” of a PM-tree’s data region is always smaller than an equivalent M-tree region (see Figure 4b). The ground entries are extended by rings as well, but in this case the number of rings used is different (m2 ≤ m). By specifying m = m1 = m2 = 0 we get an ordinary M-tree. Slim-down Algorithm. A particular hierarchy of M-tree’s (or PM-tree’s) nested data regions can be far from optimal, which means the volumes of regions can be very large, and they can also overlap significantly. This leads to poor search efficiency, since the larger volumes/overlaps the greater probability that a data region and the query region will overlap. To prevent such poor hierarchies, the generalized Slim-Down algorithm [18] has been developed to optimize an already built (P)M-tree index. Although the ”slimming down” is an expensive operation, it can speed up the subsequent querying up to 10x.
4
Experimental Results
As dataset we used random subset of the Swiss-Prot database of size 3000 with total number of 1041027 amino acids. Another random 100 hundred sequences have been chosen as query sequences.All of the sequences were of maximal length 1000 which is doesn’t cause any problem when we realize that there are only 9191 longer sequences out of 252616 in whole Swiss-prot which makes 3% (average sequence length is 365 in whole Swiss-prot and 335 in the reduced variant). These longer sequences could then be treated in special way since they are just small
Index-Based Approach to Similarity Search in Protein and Nucl. Databases
77
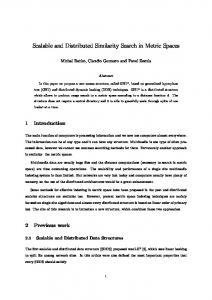
part of the whole. We don’t show time comparation in our tests because we do not have effecitive implementation of Smith-Waterman yet, being the crucial component of the running time. But our method could be easily compared to SSEARCH (part of FASTA package) when we realize that SSEARCH is equivalent to sequence scan. To be able to compare index based methods with BLAST we distinguish number of distance computations from computational costs. We defined computational costs here as number of comparing two letters. Therefore computational cost of tree based methods are averaged as number of distance computations multiplied by the average size of distance matrix for Smith-Watterman which is 321 ∗ 321 = 103041. For possibility of comparing index-based methods with sequentional scan, we show number of distance computations too. Computational costs of BLAST can be devided from description in section 2.2. Average number of neighbouring words for our dataset of query sequences is 54 and takes 81784 operations (matching letters) to get them 8 , which gives us 245352 computational operations. This means that there was built search tree with 54 items. Such a tree has aproximatly 6 levels. When searching for seeds for the high scoring pairs, there have to be done 6 comparations with every position of the database. Since every comparation of word with database costs 3 operations, the computation costs of BLAST in average are 6 ∗ 1041000 ∗ 3 = 1873800 operations. Number of operations done while finding neighbouring words and finding high scoring pairs is insignificant in comparation with this number so we do not take it into account. Therefore we state that in average case, computational costs of BLAST are 18738000 operations9 . Four indexing methods were tested - M-tree, PM-tree, slimmed PM-tree and LAESA, each of them using the same set of distance modificators 10 genereted by the TriGen algorithm. As can be seen in Figure 5a, when the zero error tolerance is used, weight of the modificator causes that number of distance computations is almost equivalent to sequence scan. When the weight is too big, it makes trinagle inequvality hold but for the price of increasing intrinsic dimension. However M-tree performes slightly better then sequence scan which means that when searching in the tree, not all of the nodes have been inspected (because of inner nodes, number of objects in the tree exceeds 3000). On the other side, PM-tree and slimmed PM-tree show worse result since there are aditional computations to pivots (mapping the query). The most similar to sequential scan is LAESA method, which uses constant number of distance computations independently on range of the query. The situation slightly changes when we allow small error (Figure 5b). This causes that number of distance computations decrease about six percent compared to zero error tolerance. Here, PM-tree and slimmed PM tree outperform M-tree and the difference is about 1%. On the other hand LAESA showed just 8 9 10
found out empirically We do not consider possible filtering of nonsignificant segments. fractional power modificators were used
78
David Hoksza, Tom´ aˇs Skopal E-value 5
80
M-tree PM-tree(32,16) SlimPM-tree(32,16)
Real error 40 50 60 30 20 10 0
50
50
M-tree PM-tree(32,16) SlimPM-tree(32,16) LAESA(64) BLAST
70
M-tree PM-tree(32,16) SlimPM-tree(32,16) LAESA(64) BLAST
Computational costs (millions) 100 150 200 250
Computational costs (milions) 100 150 200 250 300
300
350
90 100
Error tolerance - 0.002
Error tolerance 0
3
4
5
6
7
8 9
11 13
2
16
3
4
5
6
7
8
9
10
12
3000 2960 2920
M-tree PM-tree(32,16) SlimPM-tree(32,16) LAESA(64) Sequential Scan
6
7
8
9
10
12
E-value
(a)
14
0.08
0.10
0.08
0.10
M-tree PM-tree(32,16) SlimPM-tree(32,16)
600
2840 5
0.06
E-value 5
200
2800 4
0.04
TriGen error tolerance
2880
Distance Computations
Distance computations 3000 3005 3010 3015 3020 3025 3030
3
0.02
Error tolerance - 0.002
M-tree PM-tree(32,16) SlimPM-tree(32,16) LAESA(64) Sequential Scan
2
0.00
14
E-value
E-value
Error tolerance 0
Distance computations 1000 1400 1800 2200 2600 3000
2
2
3
4
5
6
7
8
9
E-value
(b)
10
12
14
0.00
0.02
0.04
0.06
TriGen error tolerance
(c)
Fig. 5. Relation between E-value and number of computations - range query (a,b) and realation between real error and distance computatins (c)
slight improvement. But in both cases BLAST method is evidently more effective since effctivity of the index is almost sequence scan even if small error is allowed. Why PM-tree and slimmed PM-tree behave better when allowing some error? Answer to this question can be seen on Figure 5c which shows on range query of E-value five the relation between declared TriGen error tolerance and real error experienced in test. Here we can see, that PM-tree real error growth more quickly than the error of M-tree and moreover, we can see that slope of those lines are almost inverse, which means that the distance computations gain of PM-tree is counterbalanced by the error. From these two graphs can also be seen that for real error 50%, there still have to be done approximately 1200 distance computations which is about 120000000 computational operations. That means that if BLAST would be such a bad hauristic that it would have just 50% successfulness, it still would be noticeable more effective.
5
Conclusions
In this paper, we have have tested suitability of metric access indexing methods for indexing protein sequences. It has been shown that these method are not applicable to sequence alignment problem without their modification. This is primarily because of quality of the data to be indexed and the distance function which is used to define similarity between them. This distance function is
Index-Based Approach to Similarity Search in Protein and Nucl. Databases
79
highly non-metric which demands strong modifications to it, to make it metric. This modification distorts distances in a way that strongly increases intrinsic dimension of the data and therefore the efficiency of search is almost the same as efficiency of sequential scan. But against sequentional scan it has that advantage that precission can be defined and thus traded off for efficiency. This learned facts can aim next resarch to several areas. To name a few: – Examining TriGen modificators and finding such modificators, which would minimize real error while distributing objects (i.e. sequences) in the space in a way which will be appropriate for indexing methods (i.e. descreasing intrinsic dimension). – Modifying the search structures. For example examining possiblities of cutting sequences to q-grams but being able to define arised error (caused by splitting and thus losing information included in the whole sequence) and (optimaly) minimalize it. – Modifying computing of Smith-Waterman local alignment. The idea is to change computing so that it will be faster and resulting scores won’t violate properites of metric so much, as they do now (for example by using borders to limit the computational space in the distance matrix).
Acknowledgments ˇ grant 201/05/P036 proThis research has been partially supported by GACR vided by the Czech Science Foundation. We would like to thank prof. Fatima Cvrˇckov´ a (Department of Plant Physiology, Faculty of Science, Charles University in Prague) for helping to get in touch with biologist point of view to the problem and contributing to the paper with helpful comments.
References 1. DNA DataBank of Japan. www.ddbj.nig.ac.jp. 2. European Molecular Biology Laboratory Data. www.embl.org. 3. S. F. Altschul, T. L. Madden, A. A. Schaffer, J. Zhang, Z. Zhang, W. Miller, and D. J. Lipman. Gapped blast and psi-blast: a new generation of protein database search programs. Nucleic Acids Res., 25:3389–3402, 1997. 4. A. Bairoch, B. Boeckmann, S. Ferro, and E. Gasteiger. Swiss-prot: Juggling between evolution and stability. Brief. Bioinform., 5:39–55, 2004. 5. E. Ch´ avez and G. Navarro. A Probabilistic Spell for the Curse of Dimensionality. In ALENEX’01, LNCS 2153, pages 147–160. Springer, 2001. 6. P. Ciaccia, M. Patella, and P. Zezula. M-tree: An Efficient Access Method for Similarity Search in Metric Spaces. In VLDB’97, pages 426–435, 1997. 7. M. O. Dayhoff, R. M. Schwartz, and B. C. Orcutt. A model for evolutionary change in proteins. Atlas of Protein Sequence and Structure, 5:345–352, 1978. 8. D. B. et al. Genbank. Nucleic Acids Res., 34(Database issue):D16–D20, 2006. 9. S. Henikoff and J. Henikoff. Amino acid substitution matrices from protein blocks. Proc. Natl Acad. Sci. USA., 89:10915–10919, 1992.
80
David Hoksza, Tom´ aˇs Skopal
10. S. Karlin and S. Altschul. Methods for assessing the statistical significance of molecular sequence features by using general scoring schemes. In Proc. Natl. Acad. Sci., volume 87, pages 2264–2268, 1990. 11. R. Mao, W. Xu, S. Ramakrishnan, G. Nuckolls, and D. Miranker. On optimizing distance-based similarity search for biological databases. In Proc IEEE Comput Syst Bioinform Conference, pages 351–61, 2005. 12. M. L. Mic´ o, J. Oncina, and E. Vidal. A new version of the nearest-neighbour approximating and eliminating search algorithm (AESA) with linear preprocessing time and memory requirements. Pattern Recognition Letters, 15(1):9–17, 1994. 13. S. Needleman and C. Wunsch. A general method applicable to the search for similarities in the amino acid sequence of two proteins. Journal of Molecular biology, 48(3):443–453, 1970. 14. Z. Ning, A. Cox, and J. Mullikin. Ssaha: a fast search method for large dna databases. Genome Research, 11(10):1725–1729, 2001. 15. W. Pearson and D. Lipman. Improved Tools for Biological Sequence Analysis. Proc. Natl. Acad. Sci., 85:2444–2448, 1988. 16. T. Skopal. Pivoting M-tree: A Metric Access Method for Efficient Similarity Search. In Proceedings of the 4th annual workshop DATESO, Desn´ a, Czech Republic, ISBN 80-248-0457-3, also available at CEUR, Volume 98, ISSN 1613-0073, http://www.ceur-ws.org/Vol-98, pages 21–31, 2004. 17. T. Skopal. On fast non-metric similarity search by metric access methods. In Proc. 10th International Conference on Extending Database Technology (EDBT’06), LNCS 3896, pages 718–736. Springer, 2006. 18. T. Skopal, J. Pokorn´ y, M. Kr´ atk´ y, and V. Sn´ aˇsel. Revisiting M-tree Building Principles. In ADBIS, Dresden, pages 148–162. LNCS 2798, Springer, 2003. 19. T. Skopal, J. Pokorn´ y, and V. Sn´ aˇsel. Nearest Neighbours Search using the PMtree. In DASFAA ’05, Beijing, China, pages 803–815. LNCS 3453, Springer, 2005. 20. T. Smith and M. Waterman. Identification of common molecular subsequences. Jurnal of molecular biology, 147:195–197, 1981. 21. C. Weimin and K. Aberer. Efficient querying on genomic databases by using metric space indexing techniques. In Proceedings of the 8th International Workshop on Database and Expert Systems Applications, page 148, 1997. 22. C. Wu, R. Apweiler, A. Bairoch, D. Natale, W. Barker, B. Boeckmann, S. Ferro, E. Gasteiger, H. Huang, R. Lopez, M. Magrane, M. Martin, R. Mazumder, C. O’Donovan, N. Redaschi, and B. Suzek. The universal protein resource (uniprot): an expanding universe of protein information. Nucleic Acids Res., 34(Database issue)(1):D187–D191, 2006. 23. W. Xu and D. Miranker. A metric model of amino acid substitution. Bioinformatics, 20(8):1214–1221, 2004. 24. P. Zezula, G. Amato, V. Dohnal, and M. Batko. Similarity Search: The Metric Space Approach (Advances in Database Systems). Springer-Verlag New York, Inc., Secaucus, NJ, USA, 2005.