APPLIED AND ENVIRONMENTAL MICROBIOLOGY, Dec. 2011, p. 8400–8408 0099-2240/11/$12.00 doi:10.1128/AEM.05688-11 Copyright © 2011, American Society for Microbiology. All Rights Reserved.
Vol. 77, No. 23
Influence of Host Phylogeographic Patterns and Incomplete Lineage Sorting on Within-Species Genetic Variability in Wigglesworthia Species, Obligate Symbionts of Tsetse Flies䌤† Rebecca E. Symula,1* Ian Marpuri,1 Robert D. Bjornson,2 Loyce Okedi,3 Jon Beadell,1 Uzma Alam,4 Serap Aksoy,4 and Adalgisa Caccone1 Department of Ecology and Evolutionary Biology, Yale University, 21 Sachem St., New Haven, Connecticut1; Department of Computer Science and W. M. Keck Biotechnology Resource Laboratory, Yale University, New Haven, Connecticut2; National Livestock Resources Research Institute, Tororo, Uganda3; and Division of Epidemiology of Microbial Diseases, School of Public Health, Yale University, New Haven, Connecticut4 Received 31 May 2011/Accepted 12 September 2011
Vertical transmission of obligate symbionts generates a predictable evolutionary history of symbionts that reflects that of their hosts. In insects, evolutionary associations between symbionts and their hosts have been investigated primarily among species, leaving population-level processes largely unknown. In this study, we investigated the tsetse (Diptera: Glossinidae) bacterial symbiont, Wigglesworthia glossinidia, to determine whether observed codiversification of symbiont and tsetse host species extends to a single host species (Glossina fuscipes fuscipes) in Uganda. To explore symbiont genetic variation in G. f. fuscipes populations, we screened two variable loci (lon and lepA) from the Wigglesworthia glossinidia bacterium in the host species Glossina fuscipes fuscipes (W. g. fuscipes) and examined phylogeographic and demographic characteristics in multiple host populations. Symbiont genetic variation was apparent within and among populations. We identified two distinct symbiont lineages, in northern and southern Uganda. Incongruence length difference (ILD) tests indicated that the two lineages corresponded exactly to northern and southern G. f. fuscipes mitochondrial DNA (mtDNA) haplogroups (P ⴝ 1.0). Analysis of molecular variance (AMOVA) confirmed that most variation was partitioned between the northern and southern lineages defined by host mtDNA (85.44%). However, ILD tests rejected finer-scale congruence within the northern and southern populations (P ⴝ 0.009). This incongruence was potentially due to incomplete lineage sorting that resulted in novel combinations of symbiont genetic variants and host background. Identifying these novel combinations may have public health significance, since tsetse is the sole vector of sleeping sickness and Wigglesworthia is known to influence host vector competence. Thus, understanding the adaptive value of these host-symbiont combinations may afford opportunities to develop vector control methods. scale, multiple parallel factors such as demography, geography, and history may influence genetic structuring of populations. The strict vertical inheritance of many endosymbionts suggests that demographic and historical processes that influence the host should also shape genetic patterns in symbionts. Wigglesworthia glossinidia is the primary obligate symbiont of tsetse (Diptera: genus Glossina), the sole insect vector of the pathogenic trypanosomes that cause human African trypanosomiasis (sleeping sickness). Like other obligate symbionts, Wigglesworthia is an intracellular bacterium housed in the tsetse midgut, in a specialized organ called the bacteriome (5). In addition to the bacteriome, extracellular forms of Wigglesworthia are found in the tsetse milk gland organ. Tsetse undergoes viviparous reproduction (deposition of live larvae rather than eggs), where a single fertilized oocyte hatches into a larva in the uterus and is nourished in the intrauterine environment for the duration of its development. Nutrients and the Wigglesworthia symbiont are provided in the milk to the larva in utero (8, 13). Wigglesworthia is highly integrated with host biology and indispensable for several important physiological functions. In the absence of Wigglesworthia, flies are sterile (31). Based upon vitamin biosynthetic pathways retained in the genome, Wigglesworthia likely provides the host with essential dietary supple-
Mutualistic bacterial symbionts are commonly associated with insects that have nutrient-poor diets. The bacteria are often responsible for the synthesis of vitamins and essential amino acids that are absent from the diet. As a result, insects often have complex adaptations to harbor the bacteria and to ensure vertical transmission. Since insect hosts and their symbionts codiversify, vertical transmission results in a predictable evolutionary history of the symbionts that is expected to mirror the history of their host. In particular, maternally inherited symbionts are expected to reflect genetic patterns in host mitochondrial DNA (mtDNA). Since this pattern has been confirmed among species in several insect groups, such as aphids (29), tsetse flies (12), and ants (46), symbiont genes are often used as proxies to estimate patterns of host species divergence and, ultimately, speciation (e.g., see reference 25). However, little has been done to investigate the extent to which this pattern is reflected within species. At this lower phylogenetic * Corresponding author. Mailing address: Department of Ecology and Evolutionary Biology, Yale University, 21 Sachem St., New Haven, CT 06520. Phone: (203) 432-3886. Fax: (203) 432-7394. E-mail: beckie
[email protected]. † Supplemental material for this article may be found at http://aem .asm.org/. 䌤 Published ahead of print on 23 September 2011. 8400
VOL. 77, 2011
GENETIC VARIATION IN TSETSE OBLIGATE SYMBIONTS
ments (4). Indeed, fecundity of antibiotic-treated (Wigglesworthia-cured) flies has been rescued partially by supplementing the host diet with vitamin metabolites (30). In the laboratory, Wigglesworthia has also been shown to influence tsetse’s trypanosome transmission ability indirectly, through the actions of a host immunity protein, peptidoglycan recognition protein LB (PGRP-LB) (34, 50). There is a positive correlation between Wigglesworthia densities and PGRP-LB levels, such that high PGRP-LB levels result in reduced trypanosome transmission through the protein’s putative trypanosome-inhibitory actions (34, 50). Additionally, the presence of Wigglesworthia during larval development influences host immune maturation. Larvae developing in the uterus without Wigglesworthia gave rise to adults that were immunocompromised and highly susceptible to parasitism (34, 51). Each tsetse species harbors a unique, coevolved lineage of Wigglesworthia that has an ancient, intimate, species-specific relationship (7). Phylogenetic analysis of nuclear host DNA and Wigglesworthia genes demonstrated strict coevolution among Glossina species and their obligate symbionts (12). Furthermore, a high degree of genetic divergence among Wigglesworthia lineages from different Glossina species indicated that the Wigglesworthia symbiosis is ancient (about 50 to 80 million years old), which likely predates the Glossina diversification (12). Spatial and temporal patterns of genetic differentiation within and among tsetse populations have been investigated for several tsetse species by use of both mtDNA and nuclear (microsatellite locus) markers (2, 9, 26, 28, 33). In Uganda, genetic variation in Glossina fuscipes fuscipes populations has been examined to identify relative contributions of population divergence, migration, and population size changes to disease transmission. These analyses identified stark divergence among tsetse populations that lie to the north and south of Lake Kyoga in central Uganda. In the contact zone between the northern and southern regions, gene flow was apparent in populations that had both northern and southern mtDNAs (2, 9). Given the geographic patterns found in tsetse mtDNA and the maternal transmission of Wigglesworthia, these vector data provide an excellent opportunity to investigate how demographic processes of host species influence symbiont genetic diversity. Symbiont genetic diversity is particularly relevant because specific genotypes may influence host physiological functions (11, 22, 32), such as vector competence (11, 22, 32), that are essential for parasite transmission processes. In this study, we tested whether patterns of within-species genetic variability observed in the tsetse host (G. f. fuscipes) are reflected in the patterns of genetic variation of its symbiont, Wigglesworthia glossinidia (W. g. fuscipes). To do this, we used previously collected G. f. fuscipes samples with known population genetic data (2, 9) to assess the amount of genetic variation in the symbiont and to test whether the observed W. g. fuscipes variation reflects geographic patterns observed in host G. f. fuscipes mtDNA over the same geographic scale. MATERIALS AND METHODS Marker development. Since the genome sequence of W. g. fuscipes is unavailable, two sequenced Wigglesworthia genomes, from the host species Glossina morsitans morsitans (W. g. morsitans) (unpublished data) and Glossina brevipalpis (W. g. brevipalpis) (4), were mined to design degenerate primers that amplified
8401
TABLE 1. Summary of collection sites Collection sitea
Site code
Approx GPS coordinates
Sample size
Host mtDNA groupb
Pallisa* Bunghazi Buvuma Junda Kabunkanga Kakoga Murchison Falls Masindi Moyo Nkumba Okame* Osuguro Dokolo*
BK BN BV JN KB KK MF MS MY NA OK OS OT
1.01, 33.86 0.94, 33.98 0.31, 33.30 1.33, 32.74 0.98, 30.55 0.36, 30.28 2.28, 31.56/31.69 1.62, 31.72 3.68, 31.73 0.90, 32.87 0.52, 34.11 1.53, 33.50 1.87, 33.50
2 18 5 6 5 5 8 6 5 17 3 13 16
N/S N/S S S N/S S N N/S N S S N N
a An asterisk next to a site identifies the source of samples used for the preliminary analyses that identified variable loci. b N, North; S, South; N/S, mixed.
300- to 1,000-bp variable regions in W. g. fuscipes. DNA sequences of the W. g. brevipalpis and W. g. morsitans 16S rRNAs are approximately 20% divergent from the 16S rRNA gene sequence of W. g. fuscipes (12). Orthologous genes were extracted from the two annotated and aligned genomes by using Mauve 2.3.1 (42). Using the Bioinformatics toolbox in Matlab (The Mathworks, Natick, MA), orthologous sequences were aligned with the “nwalign” function, and open reading frames were confirmed to ensure the best alignment by using the “nt2aa” function. To find suitable regions to amplify and design primers, a 20-bp sliding window was used to scan aligned orthologous genes. Regions used to design forward and reverse primers were defined as those of 20 to 50 bp with no more than one nucleotide difference in each window that flanked 300- to 1,000-bp stretches with more than one nucleotide difference in each 20-bp sliding window. The suitable regions identified using this script were then passed to the EMBOSS 6.1.0 application eprimer3 to find 18- to 35-bp primers that amplified 700- to 1,000-bp DNA fragments. To determine variability levels in these candidate loci, the resulting primer pairs were tested by PCR and sequencing, using nine tsetse samples from three geographically disparate sites in Uganda known to have variable mtDNA haplotypes (Table 1). Since there are multiple Wigglesworthia species within a bacteriocyte in the bacteriome and there can be hundreds of genomes in a single Wigglesworthia organism (41), we targeted genes that could be confirmed to exhibit variability only between individual flies. Therefore, candidate loci were selected for screening if PCR and sequencing resulted in a single product and variation was detected in at least two of the three sampling localities. Sampling. Samples were selected based upon the mtDNA haplogroups (North and South) and groups defined by microsatellite loci of the tsetse host. These comprised groups from four sites for the northern mtDNA haplogroup (MF, MY, OS, and OT) and from five sites for the southern mtDNA haplogroup (BV, KB, KK, NA, and OK), as well as groups from four sites that harbored both mtDNA haplogroups (BK, BN, JN, and MS). Ten of these sites (BV, JN, KB, KK, MF, MS, MY, NA, OS, and OT) were selected as representative of the genetically distinct tsetse groups identified using microsatellites (9). The number of screened individuals ranged from four to six individuals per site (Fig. 1). For four sites (BN, NA, OS, and OT), we increased the sample size by 10 to 12 individuals to examine within-population variation. Table 1 summarizes the sites, sample size, and host mtDNA haplogroups. Detailed sampling information is provided in Table S1 in the supplemental material. Laboratory methods. DNA was extracted from whole fly bodies with the head, legs, and wings removed by using Qiagen DNeasy extraction kits (Qiagen, Inc.). For each PCR, 2 to 4 l of a 1:10 dilution of DNA extract was used. PCRs were performed using the reagents provided with GoTaq DNA polymerase and green master mix. Difficult templates were amplified using Failsafe PCR 2⫻ PreMixes buffers H and I (Epicentre Biotechnologies, Madison, WI). All PCRs used the following conditions: initial denaturation at 94°C for 5 min, 35 cycles of 94°C for 1 min, 46°C for 30 s, and 72°C for 60 s, and a final extension at 72°C for 10 min. PCR success was determined using 1% agarose gel electrophoresis. Successful PCR products were purified with ExoAp and sequenced (Yale DNA Analysis Facility). Contiguous sequences generated using forward and reverse primers and alignments of sequences were constructed using the CLCBio DNA Workbench 5.7 (Cambridge, MA).
8402
SYMULA ET AL.
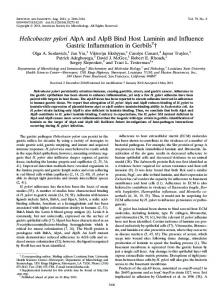
FIG. 1. Sampling localities and number of individuals collected at each site. The inset map shows the geographical position of Uganda on the African continent. Abbreviations of site names are expanded in Table 1. Light gray shading corresponds to the previously identified northern mtDNA haplogroup, and dark gray illustrates the southern mtDNA haplogroup (2, 9). The dotted line shows the western group delineated by the microsatellite loci (2, 9).
Three gene fragments were screened among sampling localities (mrsA, lepA, and lon). Two of these, lepA (encoding a ribosomal translocation factor [38]) and lon (encoding a cold shock protein [35]), were screened among all samples. To verify that the correct gene was PCR amplified from W. g. fuscipes, we aligned orthologous genes from the W. g. brevipalpis and W. g. morsitans genomes. Once confirmed, primer sequences were removed and alignments were improved manually in MacClade 4.07 (27). Since each individual tsetse harbors its own maternally acquired Wigglesworthia population, sequence variants may occur in a single fly (i.e., as rare variants). To ensure that direct sequences did not capture W. g. fuscipes rare variants and were therefore appropriate for evolutionary studies, we cloned the PCR product of one of the two genes (lon [644 bp]) for one individual from each of the host northern, southern, and mixed mtDNA haplogroup sites (MF, OK, and JN, respectively) and sequenced multiple clones from each individual. PCR products were cleaned using a NucleoSpin Extract II kit from Macherey-Nagel (Bethlehem, PA) and were cloned using the pGEM-T vector system (Promega, Madison, WI). For each individual, 5 clones were selected and sequenced using the primers provided in the pGEM-T kit. Cloned inserts were prepared for sequencing using the ExoAp protocol mentioned above, and products were sequenced using the T7 primer. To confirm that cloned sequences were identical, cloned sequences from each individual were compared to each other and to direct sequences. Given the high error rate and lack of proofreading enzymes of GoTaq mix (error rate ⫽ 1 ⫻ 10⫺4 to 7 ⫻ 10⫺4 error per base pair per cycle), clone sequences with one to three single-nucleotide polymorphisms (SNPs) were considered the result of PCR error (15). Phylogeographic measures and statistics. Relationships among haplotype lineages were inferred by using parsimony in TCS v1.21 (14). Networks were generated for each of the three loci individually. The mrsA locus showed limited variability (see Fig. S1 in the supplemental material) but showed similar patterns to those of lepA and lon (see Fig. S1 and S2). Thus, mrsA was not used to screen the complete data set. Since the networks were not different in general, lepA and lon were concatenated, a network was built using the combined data set (see Results), and only data for these loci were used in subsequent analyses. Another network was generated by concatenating W. g. fuscipes and G. f. fuscipes host mtDNA sequences to illustrate conflict between the two markers (9). W. g. fuscipes genetic variation may be influenced similarly by geographic structuring processes that shape host nuclear genetic variation. Host microsatellite loci can be used as a proxy for geographic differentiation, as neutral microsatellite loci capture evolutionary processes that generate geographic patterns. In polymorphic populations, if there is decoupling of host microsatellite groups and Wigglesworthia haplogroups, then we can infer that geographic pro-
APPL. ENVIRON. MICROBIOL. cesses that shape host neutral genetic variation do not similarly affect the symbiont. To examine this, we compared assignments of individuals to W. g. fuscipes haplogroups to assignment probabilities estimated by the program Structure (37), which probabilistically assigns individuals to K clusters. For G. f. fuscipes, Beadell et al. (2, 9) found support for three geographically restricted groups, corresponding to a K value of 3. Thus, we compared the assignments of individuals to each of the three host-defined clusters and each of two W. g. fuscipes haplogroups. Structure assignment probabilities were available for individuals in only some of the populations (JN, KB, KK, MF, MS, NA, and OS), as the individuals screened differed between this study and previous studies (2, 9). Of these, only JN and MS populations were polymorphic for W. g. fuscipes (the sites harbor both mtDNA haplogroups), and only the MF population was polymorphic in microsatellite Structure assignment (see Table S3 in the supplemental material). To assess whether W. g. fuscipes exhibits signatures of recent population expansion, we used mismatch distributions (43) and coalescent simulations of raggedness, Fu’s Fs (20), and the R2 statistic of Ramos-Onsins and Roza (40). The raggedness statistic tests how well the observed mismatch distribution resembles the unimodal curve expected from a growing population. To complement this statistic, two more powerful statistics, Fu’s Fs (18) and Ramos-Onsins and Roza’s R2 (36), were used to detect deviations from the null expectation of constant population size. If a deviation from constant population size is detected, Fu’s Fs tends to be negative. Under the hypothesis of population growth, the R2 test results in low R2 values because of the increased numbers of singleton mutations relative to the average number of nucleotide differences in a population. We used DnaSP (45) to conduct these tests and assessed significance by comparing the observed statistics to a distribution of values generated with 5,000 coalescent simulations (44). Statistical analyses and hypothesis testing. In order to test for congruence between pairs of data sets, incongruence length difference (ILD) tests (19) were performed using the partition homogeneity test as implemented in PAUP* 4.10b (48). The ILD test examines whether different loci generate conflicting evolutionary histories (tree topologies) by comparing the length of the maximum parsimony phylogenetic tree for the combined data set to the sum of the tree lengths for each of the data partitions examined separately. Statistical significance was assessed by calculating tree lengths from randomly generated data sets with the same lengths as the original partitions. When the difference was significant (P ⬍ 0.05), the null hypothesis that the two partitions produced the same phylogenetic history was rejected. To test whether the two W. g. fuscipes loci (lepA and lon) generated congruent topologies, an ILD test was performed by concatenating the two loci. Alignments were divided into locus-specific partitions to test whether the two partitions generated equivalent topologies. To test for congruence between G. f. fuscipes and W. g. fuscipes, lepA and lon sequences for each individual were concatenated with the mtDNA sequence for the same individual (2, 9). Alignments were divided into host and symbiont partitions to test whether the partitions generated different trees. All tests were performed with a data set that contained only a single representative of each haplotype. Tests were performed to examine two hypotheses (A and B) that investigate whether congruence exists on a fine or broad scale. First, we tested the hypothesis of “strict vertical transmission” by using the complete symbiont plus host mtDNA (1,910 bp) data set (hypothesis A). This tested whether each W. g. fuscipes haplotype was limited exclusively to a single G. f. fuscipes host mtDNA haplotype. Second, we tested the hypothesis of “broad-scale vertical transmission” (hypothesis B). This hypothesis tested whether the two groups identified in both W. g. fuscipes loci reflected the same north-south division identified by host mtDNA. Thus, for hypothesis B, any site that was variable only within a group was excluded for each of the three markers separately (lepA, lon, and mtDNA). This removed any conflict that might have arisen due to incomplete lineage sorting of the host and symbiont and tested if the northern and southern geographical groups defined by host mtDNA were identical to the two groups identified in W. g. fuscipes. For both of the above tests, additional tests were performed with invariant sites removed, since the ILD tests are known to show bias in the presence of many constant characters (16, 39, 52). To test whether variation in W. g. fuscipes was partitioned between the host northern and southern mtDNA haplogroups, an analysis of molecular variance (AMOVA) was performed using Arlequin 3.05 (18). Individual W. g. fuscipes sequences were grouped according to assignment to the northern or southern host mtDNA haplogroup. Nucleotide sequence accession numbers. Sequences JN688443 to JN688552 (lepA) and JN688553 to JN688662 (lon) have been deposited in GenBank. Accession numbers are shown for each individual fly in Table S1 in the supplemental material.
VOL. 77, 2011
GENETIC VARIATION IN TSETSE OBLIGATE SYMBIONTS
8403
TABLE 2. Diversity statistics for lepA, lon (W. g. fuscipes symbiont), and COII (G. f. fuscipes host mtDNA) loci lepA Site code
No. of samples
lepA ⫹ lon
lon
COII mtDNA
No. of haplotypes
Hd
⌸
No. of haplotypes
Hd
⌸
No. of haplotypes
Hd
⌸
No. of haplotypes
Hd
⌸
BK BN BV JN KB KK MF MS MY NA OK OS OT North South
2 18 5 6 5 5 8 6 5 17 3 13 16 60 49
2 2 1 2 1 1 1 2 1 1 1 1 1 2 3
1.0 0.503 0 0.600 0 0 0 0.600 0 0 0 0 0 0.232 0.503
0.0043 0.0022 0 0.0017 0 0 0 0.0026 0 0 0 0 0 0.0003 0.0006
2 2 1 2 1 1 2 2 2 2 1 1 2 5 3
1.00 0.503 0 0.600 0 0 0.250 0.600 0.600 0.515 0 0 0.382 0.298 0.481
0.0062 0.0031 0 0.0037 0 0 0.0004 0.0056 0.0009 0.0009 0 0 0.0006 0.0013 0.0012
2 2 1 2 1 1 2 2 2 2 1 1 2 6 4
1.00 0.503 0 0.600 0 0 0.250 0.600 0.600 0.515 0 0 0.382 0.466 0.658
0.0052 0.0026 0 0.0027 0 0 0.0002 0.0040 0.0005 0.0008 0 0 0.0003 0.0004 0.0010
2 4 3 3 1 2 1 2 2 2 1 4 4 9 8
1 0.627 0.7 0.733 0.0 0.4 0 0.6 0.4 0.515 0 0.654 0.692 0.783 0.622
0.0105 0.0057 0.0021 0.0115 0.0000 0.0007 0 0.0105 0.0007 0.0018 0 0.0040 0.0021 0.0034 0.0023
Total
109
5
0.668
0.0020
8
0.684
0.0032
10
0.770
0.0030
17
0.859
0.0086
RESULTS Marker development and screening. Our approach using the two sequenced Wigglesworthia genomes from the G. m. morsitans and G. brevipalpis host species yielded primer pairs for 30 candidate loci. Of these, 15 successfully amplified W. g. morsitans or W. g. fuscipes DNA. Of these 15, only 3 loci (mrsA, 495 bp; lon, 644 bp; and lepA, 696 bp) did not generate products with nonspecific amplification in the nine-sample subset (Table 1; see Table S2 in the supplemental material). Given that primers were designed from genomes that are 20% divergent (12), the failure to amplify and nonspecific amplification were attributed to differences in priming sites in W. g. fuscipes and thus to failure of the primers. Most variation was found in the two longer PCR fragments, from lon and lepA, which were used to screen the complete data set. Direct sequencing resulted in chromatograms with no double peaks, suggesting the presence of a single gene sequence per individual. This was supported by comparison of the lon DNA sequences from multiple clones from one individual tsetse from each of the northern, southern, and mixed host mtDNA haplogroups with sequences obtained from direct sequencing of the PCR products. For all 3 individuals, the direct sequence was verified by at least one clone sequence. No cloned sequences had more than 3 SNPs, which is well within the expected error rate of GoTaq polymerase (Promega). All SNPs were unique to an individual clone and were not found in any other cloned individual or in the entire data set. Therefore, our cloning results support the assumption that sequences generated by direct sequencing are appropriate for inference of evolutionary relationships among populations of W. g. fuscipes, and they were used in all downstream analyses. Verification of the presence of a single clonal population of W. g. fuscipes within an individual fly would require extensive cloning and sequencing of multiple individuals and was beyond the scope of this project. Genetic diversity, differentiation, and demography. Measures of genetic variation were obtained for 109 individuals from 13 populations (see Table S1 in the supplemental mate-
rial). Based on the similar outcomes for the two loci, we concatenated the data set to 1,340 bp (ILD test; P ⫽ 1.0). Of the 16 variable sites, only 3 resulted in nonsynonymous differences in the amino acid sequence (positions 453 and 552 in lepA and position 825 in lon). Two of the nonsynonymous differences were restricted to a single collection site (NA; position 825) or region (BN and BK; position 552). All 13 synonymous changes were at third codon positions. A total of 9, 5, and 10 haplotypes were identified for lon, lepA, and the combined data set, respectively. No more than two haplotypes were found for a given collection site (Table 2). Table 2 summarizes the symbiont genetic diversity for each gene and the combined data sets. Haplotype diversity (Hd) and nucleotide diversity (兿) were similarly low for both markers. The high Hd value of the BK sample was the only exception and was due to the only two sampled individuals carrying different haplotypes. This is unlikely to be representative of the variability at that site due to the small sample size. Genetic diversity was higher for symbionts from the southern than from the northern host mtDNA haplogroup. AMOVA (Table 3) on all samples showed that 85.44% of genetic variation in the symbiont was attributable to the North
TABLE 3. AMOVA results for lepA plus lon (W. g. fuscipes)a mtDNA haplogroup
Group comparisonb
Variance component
% Variation
All groups
Between North and South Among sites within North and South Within sites
3.00263 0.36791
85.44 10.47
0.14375
4.09
North
Among populations Within populations
0.17829 0.19592
47.64 52.36
South
Among populations Within populations
0.55498 0.20588
72.94 27.06
a b
AMOVA was performed using Arlequin (18). North and South refer to the host mtDNA haplogroups.
8404
APPL. ENVIRON. MICROBIOL.
SYMULA ET AL.
TABLE 4. Demographic test results for W. g. fuscipes groups, including those at sites where there are mixed host mtDNA haplotypesa Parameter
Value(s) for lepA ⫹ lon North (n ⫽ 61)
South (n ⫽ 49)
⫺2.730 ⫺3.3106, 3.9251 0.13085
1.7181 ⫺3.0036, 1.3487 0.83102
Raggedness (r) CI P
0.1255 0.0614, 0.8742 0.36984
0.1091 0.3341, 0.7110 0.31054
R2 CI P
0.1337 0.0322, 0.2426 0.71158
0.1337 0.0553, 0.2047 0.71069
Fu’s Fs CI P
a North and South, host mtDNA haplogroups; n, number of symbiont samples; CI, confidence interval; P, probability.
and South divisions defined by the host mtDNA. Permutation tests revealed that this difference was significant. The AMOVA run separately on the northern and southern samples suggested that while variation in the North was partitioned approximately equally among and within sites (47.64% versus 52.36%), variation among populations (72.94%) was higher than that within populations (27.06%) for the southern sites. Table 4 shows the results of the demographic tests. Since Wigglesworthia is inherited maternally and undergoes a bottleneck when transmitted to offspring, the population demographics of tsetse mtDNA and Wigglesworthia should be similar. Mismatch distributions, coalescent simulations of raggedness, Fu’s Fs, and the R2 statistic of Ramos-Onsins and Roza were used on the combined lepA-lon data set to evaluate whether these loci exhibit signatures of recent population expansion. These methods were the same as those used on tsetse
host mtDNA data, which revealed signatures of population expansion in northern and southern fly haplogroups (9). This does not seem to be the case for the symbiont. Mismatch tests provided raggedness values (r ⫽ 0.1255 and 0.1091 for the northern and southern clades, respectively) that failed to reject the null hypothesis of constant population size (P ⫽ 0.37 and 0.31, respectively) (Table 4). Although this was confirmed by the results of Fu’s Fs and R2 tests (Table 4), these results should be interpreted with caution, because genetic variation observed in both symbiont genes was low, a factor that severely limits test power. Thus, more informative markers could help to confirm or refute the signatures of population growth found in the host populations. Phylogeographic history. The TCS parsimony network generated using the lepA and lon combined data set identified two W. g. fuscipes lineages separated by five substitutions (Fig. 2A), only one of which was nonsynonymous. The geographic distribution of these haplotypes is illustrated in Fig. 2B. Each of the lineages was restricted geographically to either the north or south of Lake Kyoga. Five collection sites had only a single W. g. fuscipes haplotype, only one of which was north of Lake Kyoga (OS). All other sites had two. Collection sites that contained both northern and southern mtDNA haplotypes also had haplotypes from both W. g. fuscipes haplogroups. In the tsetse sample used for W. g. fuscipes, there were three sites with a single mtDNA haplotype (KB, MF, and OK). Two of them also had a single W. g. fuscipes haplotype (KB and OK). With one exception (OS), if a site had multiple mtDNA (host) haplotypes, it also had multiple W. g. fuscipes haplotypes. Also with one exception (MF), if a site had multiple W. g. fuscipes haplotypes, it had multiple mtDNA haplotypes. When individual W. g. fuscipes haplogroups were compared to the three host microsatellite groups, with the exception of MF, all sites that contained a single W. g. fuscipes (KK, KB,
FIG. 2. Phylogeographic relationships of W. g. fuscipes symbionts in Uganda. (A) TCS network estimated from two concatenated W. g. fuscipes loci. Green shades indicate individuals known to have northern mtDNA, and blue shades indicate those with southern mtDNA. (B) Geographic localities of haplotypes of W. g. fuscipes. Pie charts show frequencies of haplotypes at each site. (C) mtDNA haplotype network showing only the subset of samples used for the W. g. fuscipes sampling. Colors within the network show W. g. fuscipes haplotypes as they correspond to host mtDNA sequences.
VOL. 77, 2011
GENETIC VARIATION IN TSETSE OBLIGATE SYMBIONTS TABLE 5. ILD test resultsa No. of characters
P value
Hypothesis
Characters included
A
All variable sites, constant characters All variable sites, no constant characters
1,910 38
0.009 0.011
B
Variable sites that define two W. g. fuscipes lineages, constant characters Variable sites that define two W. g. fuscipes lineages, no constant characters
1,883
1.0
11
1.0
a There were 26 individuals tested in all cases. Hypothesis A used all variable characters from the lepA, lon (W. g. fuscipes symbiont), and COII (G. f. fuscipes host mtDNA) loci. Hypothesis B used variable characters from lepA and lon that defined the two lineages in W. g. fuscipes and all variable characters in COII mtDNA sequences. Both hypotheses were examined with constant characters included and constant characters excluded to examine known bias in the data set (18, 52). All tests were performed in PAUP*4.10b (48, 52) with 1,000 replicates.
NA, and OS) haplogroup were also assigned to a single microsatellite group (see Table S3 in the supplemental material). For MF, individuals from a single W. g. fuscipes haplogroup were assigned to multiple microsatellite groups. However, at sites polymorphic for W. g. fuscipes haplogroups (JN and MS), all individuals were assigned to a single microsatellite group (see Table S3). Since there was a decoupling between W. g. fuscipes and host microsatellite groups at the polymorphic sites MF, JN, and MS, this suggests that genetic variation in W. g. fuscipes is not generated by the same geographic processes that shape host population structure. We performed ILD tests, with and without constant characters, to evaluate the hypothesis of vertical transmission of W. g. fuscipes. Although removing constant characters did not change the outcome of the test, we show the results of both methods (Table 5). For hypothesis A (strict vertical transmission), using the complete 1,910-bp data set (for symbiont genes and host mtDNA), the ILD test rejects the hypothesis that mtDNA and W. g. fuscipes loci show the same phylogenetic history (Table 5) (P ⫽ 0.009). However, for hypothesis B (broad-scale vertical transmission), when we tested whether the northern and southern groups designated by the different loci were congruent, the test failed to reject the hypothesis that northern and southern samples share the same phylogenetic history (P ⫽ 1.0) (Table 5). Thus, we reject hypothesis A (strict vertical transmission) but support the hypothesis that individuals with northern W. g. fuscipes haplotypes have northern host mtDNA and those with southern W. g. fuscipes haplotypes have southern host mtDNA. DISCUSSION Genetic diversity. This study identified two divergent and variable W. g. fuscipes lineages (Fig. 2A; Table 2) with variation distributed within and among host populations. This was not unexpected, since obligate primary symbionts such as W. g. fuscipes have elevated rates of sequence evolution relative to free-living bacteria. Higher rates of sequence evolution are attributed to multiple causes, including rare or no opportunities for horizontal gene transfer, the absence of a complete
8405
suite of DNA repair enzymes, and the occurrence of severe bottlenecks between each generation (1, 3, 12, 21, 24, 29, 49). Other within-species studies have examined genetic diversity in symbionts (1, 21–24, 47, 49). The majority of comparable studies have focused on aphids and their symbiont, Buchnera aphidicola (1, 21, 47, 49). For example, among biotypes of Russian wheat aphids, all but four biotypes were genetically identical. The remaining four types differed by the presence of the same insertion. This small difference in biotypes is attributed to recent adaptation to new environmental conditions, a hypothesis supported by low host nuclear and mtDNA variability (47). Similarly, in geographically distant (⬎1,000 km) populations of two U.S. aphid species, Buchnera variation was limited to a few variable sites (21). This low variation has been attributed to elevated gene flow among aphid populations, which also display extremely low mtDNA divergence levels (21). Interestingly, when symbiont variation was examined at a smaller geographic scale (⬍200 km apart) in Florida ant populations, genetic variation in noncoding regions of the symbiont, Blochmannia floridanus, exceeded that found in geographically distant Buchnera symbionts (23). Though noncoding sequences might be expected to have higher substitution rates, there is no evidence that noncoding regions have elevated rates of substitution in Buchnera (21). Although it is difficult to make direct comparisons with other published data and our study because, with the exception of the ant symbiont study (23), the geographic scale of sampling differs (1, 21–24, 47, 49), our work suggests that W. g. fuscipes harbors more genetic variation than other obligate symbionts. In Uganda, we found 16 variable sites in the lepA and lon (1,340 bp) genes of W. g. fuscipes symbionts from collection sites that were no more than 500 km apart. Though the total number of variable sites is similar to that found in Buchnera, our data suggest the existence of much finer-scale variation in W. g. fuscipes, since Buchnera samples were from sites that were nearly 3,000 km apart (1, 21). Congruence between symbionts and host mtDNA and geographic patterns of diversity. In the majority of studies on symbionts, the primary hypothesis is that cospeciation occurs between host species and their symbionts (6, 12, 25). Thus, symbiont genetic variation should be correlated with that of its host. Indeed, Wigglesworthia shows phylogenetic congruence with its Glossina host species (12). Therefore, it was expected that the evolutionary history of W. g. fuscipes would be linked tightly to that of G. f. fuscipes (2, 9). This study identified two W. g. fuscipes lineages that correspond to geographically restricted tsetse host mtDNA haplogroups (Fig. 2A and B; Table 5). Furthermore, in regions where the two mtDNA haplogroups can be found mixed within populations (BK, BN, JN, and MS), W. g. fuscipes haplotypes always sort according to their mtDNA haplogroup. This suggests that evolutionary processes influencing host genetic variability (e.g., geography) also impact symbiont genetic variability, as W. g. fuscipes haplotypic diversity sorts according to the northern and southern host mtDNA haplogroups (2, 9) (Fig. 1; Table 2). Compared to geographic patterns of host nuclear variation, W. g. fuscipes haplotypes do not sort according to the three host microsatellite-based groups (see Table S3 in the supplemental material). Since microsatellite groups reflect historical geographic processes, this suggests that W. g. fuscipes genetic variation is
8406
SYMULA ET AL.
independent of recent geographic processes that shape host nuclear variation. Variation in W. g. fuscipes was about three times less than that found in the host mtDNA (Table 2). This lower variability suggests that the rate of evolution in W. g. fuscipes is lower than that in mtDNA, at least for the loci sequenced in this study. Comparable within-species studies of symbiont polymorphism have found that symbionts and their host mtDNA have similar rates and patterns of substitution (1, 21). Unfortunately, the lower variability in W. g. fuscipes resulted in decreased power for estimating population demographics. Thus, the population expansions identified for G. f. fuscipes mtDNA (9) could not be confirmed for the symbiont (Table 4). In Uganda, G. f. fuscipes phylogeographic patterns based on mtDNA and microsatellites confirmed an ancient historical break (⬃340,000 years ago) between the North and South, with a contact zone just south of Lake Kyoga (2, 9) (Fig. 1). Further subdivision was identified in western Uganda (KK, KB, MS, and MF) (Fig. 1) (2, 9). The data from W. g. fuscipes support the ancient subdivision between the North and South (Fig. 2A). Furthermore, AMOVA showed that the majority of variation in the data set was partitioned between northern and southern mtDNA haplogroups (Table 3). Based on the W. g. fuscipes data, with the exception of the KK population, the remaining western populations are comprised solely of haplotypes not found elsewhere, supporting the separation of this western group. All individuals in the KK population had the same, most common W. g. fuscipes haplotype, supporting an ancient connection between southern and western tsetse populations (Fig. 2A and B). Like the case with mtDNA (2, 9), genetic differentiation within the northern lineage was lower than that observed in the southern lineage as determined by AMOVA (Table 3). On a broad scale (North and South), the mtDNA and symbiont data are congruent with one another and generally support the pattern of vertical inheritance (hypothesis B) (Table 5). In no individual fly was there conflict between mtDNA and W. g. fuscipes haplotypes in assigning individuals to either a northern or southern group, even in the contact zone, where individuals from both the northern and southern haplogroups can be collected (hypothesis B) (Table 5). Independence from the host microsatellite groups suggests that W. g. fuscipes variation is not shaped by more recent geographic structuring processes and further supports the evidence that W. g. fuscipes is transmitted vertically. However, congruence was not found in comparing the patterns of symbionts and host mtDNA within each of the northern and southern haplogroups (hypothesis A) (Table 5). With strict vertical transmission, it is expected that either each mtDNA haplotype has a single W. g. fuscipes haplotype or each W. g. fuscipes haplotype has a single mtDNA haplotype. Based on our sequence data, this is not the case (Fig. 2C; see Fig. S1 and S2 in the supplemental material). When W. g. fuscipes sequences were compared to host mtDNA on a fine scale (hypothesis A), ILD tests showed conflict between data sets (P ⬍ 0.05) (Table 5; Fig. 2C). There are several possible explanations for the conflict between host and symbiont genetic markers. First, it is possible that W. g. fuscipes is not strictly vertically inherited. In adult tsetse, Wigglesworthia symbionts are found intracellularly in the bacteriome and in a separate free-living population in the
APPL. ENVIRON. MICROBIOL.
female milk gland (34). Transmission of Wigglesworthia to the offspring happens while larvae are in utero, through female milk secretions (13). There is no evidence that males have such free-living populations or that they can transmit their own Wigglesworthia bacteria. In free-living bacteria, it is common for genes to be exchanged in linkage groups such that different parts of the genome have different evolutionary histories. Based upon known tsetse physiology, populations of Wigglesworthia from different individual flies do not come in contact with each other and therefore are unlikely to have opportunities to undergo recombination. While rare, cryptic horizontal transfer cannot be ruled out entirely, W. g. fuscipes symbionts are shared only between mother and offspring, and males cannot transmit the bacteria to offspring, so this explanation for incongruence between mtDNA and W. g. fuscipes is unlikely. Second, it is possible that selection acts differently within and among G. f. fuscipes populations and therefore influences W. g. fuscipes. Wigglesworthia is known to impact not only fecundity of the host but also its immunity (34, 50, 51). In the absence of W. g. morsitans, colony G. m. morsitans flies are more likely to acquire trypanosome infections, which bears a fitness cost for the tsetse host (34, 50). As such, it is possible that different genotypes of W. g. fuscipes may differentially influence host vector competence. Since human African trypanosomiasis, commonly known as sleeping sickness, occurs in geographically distinct foci (10, 36), it is possible that W. g. fuscipes symbionts converge on advantageous genotypes inside geographically distinct disease foci, thus resulting in individuals with the same W. g. fuscipes haplotypes but different mtDNA haplotypes. The two W. g. fuscipes loci investigated here are housekeeping genes that function to encode either a ribosomal translocation factor (lepA) (38) or a heat shock protein (lon) (35). Though these genes are not obviously associated with immune responses, it is possible that they may be linked to other genes that are under selection. Future studies of genomewide variation in Wigglesworthia bacteria from trypanosome-infected and uninfected flies within a population will address this hypothesis. However, even if selection can explain the one instance of incongruence (e.g., haplotype 8), it does not explain the incongruence at silent sites, rendering this hypothesis also unlikely. Finally, the most likely reason for the observed incongruence between W. g. fuscipes and its host mtDNA within the mtDNA haplogroups is incomplete lineage sorting, a phenomenon commonly observed in examining recently diverged genes (17). If multiple haplotypes occur at a single locus in an ancestral population, then the stochastic process of genetic drift will eventually fix alleles in some populations through the process of lineage sorting. In W. g. fuscipes, this process appears to have occurred at site MS (Fig. 2), since all northern individuals have a single mtDNA haplotype and a single W. g. fuscipes haplotype. However, if divergence is too recent and genetic drift has not fixed haplotype combinations, this will lead to conflict between markers and to misleading information about among-population relationships due to differences in coalescence times for each gene (including those from the host) (17). Thus, our observed mtDNA-symbiont incongruence within northern and southern host mtDNA haplogroups could be the result of random haplotype combinations present in the ancestral northern (or southern) population. Again, whole-genome
VOL. 77, 2011
GENETIC VARIATION IN TSETSE OBLIGATE SYMBIONTS
sequencing approaches will test this hypothesis by using genomewide scans of variability among different loci exhibiting different disease transmission dynamics. Relevance to public health. Vector control has been shown to be effective for curbing tsetse-transmitted diseases. Understanding the processes that influence trypanosome infection of tsetse and identifying populations that are likely to be susceptible to parasite infections can enhance disease control efforts. Wigglesworthia and other symbionts (e.g., Sodalis) are known to influence trypanosome infection processes in tsetse (22, 34, 50). In Sodalis, tsetse’s commensal secondary symbiont, different genotypes have been identified in trypanosome-infected and noninfected populations (22, 34, 50), illustrating that understanding the genetic variability of symbionts is critical to understanding trypanosome transmission dynamics. It is possible that a similar type of variability influences trypanosome establishment through variation in W. g. fuscipes. Here we show that genetic diversity in W. g. fuscipes occurs within and among fly populations and that there are several unique combinations of W. g. fuscipes in different host backgrounds (as defined by mtDNA). While some variation is attributable to tsetse phylogeographic history (e.g., see references 2 and 9), some variants may generate unique gene combinations that are more apt to prevent trypanosome establishment and thus increase the fly’s potential to become less susceptible to parasite establishment. A more detailed understanding of the adaptive value of certain host-symbiont haplotypic combinations, especially with regard to parasite establishment, may provide novel insights and tools for vector and parasite control. ACKNOWLEDGMENTS This project was funded by an NIH grant (AI068932) to S.A. and A.C. Support was also provided by the Yale Center for High Performance Computation in Biology and Biomedicine and by NIH grant S10_RR019895, which provided the computer cluster used in this research. We thank Edward Ssewannyana and the staff at the National Livestock Resources Research Institute, Tororo, Uganda, for facilitating tsetse fly collection. REFERENCES 1. Abbot, P., and N. A. Moran. 2002. Extremely low levels of genetic polymorphism in endosymbionts (Buchnera) of aphids (Pemphigus). Mol. Ecol. 11:2649–2660. 2. Abila, P. P., et al. 2008. High levels of genetic differentiation between Ugandan Glossina fuscipes fuscipes populations separated by Lake Kyoga. PLoS Negl. Trop. Dis. 2:e242. 3. Adams, A. S., S. M. Adams, C. R. Currie, N. E. Gillette, and K. F. Raffa. 2010. Geographic variation in bacterial communities associated with the red turpentine beetle (Coleoptera: Curculionidae). Environ. Entomol. 39:406– 414. 4. Akman, L., et al. 2002. Genome sequence of the endocellular obligate symbiont of tsetse flies, Wigglesworthia glossinidia. Nat. Genet. 32:402–407. 5. Aksoy, S. 1995. Wigglesworthia gen. nov. and Wigglesworthia glossinidia sp. nov., taxa consisting of the mycetocyte-associated, primary endosymbionts of tsetse flies. Int. J. Syst. Bacteriol. 45:848–851. 6. Aksoy, S., X. Chen, and V. Hypsa. 1997. Phylogeny and potential transmission routes of midgut-associated endosymbionts of tsetse (Diptera:Glossinidae). Insect Mol. Biol. 6:183–190. 7. Aksoy, S., A. A. Pourhosseini, and A. Chow. 1995. Mycetome endosymbionts of tsetse flies constitute a distinct lineage related to Enterobacteriaceae. Insect Mol. Biol. 4:15–22. 8. Attardo, G. M., et al. 2008. Analysis of milk gland structure and function in Glossina morsitans: milk protein production, symbiont populations and fecundity. J. Insect Physiol. 54:1236–1242. 9. Beadell, J. S., et al. 2010. Phylogeography and population structure of Glossina fuscipes fuscipes in Uganda: implications for control of tsetse. PLoS Negl. Trop. Dis. 4:e636.
8407
10. Berrang-Ford, L., M. Odiit, F. Maiso, D. Waltner-Toews, and J. McDermott. 2006. Sleeping sickness in Uganda: revisiting current and historical distributions. Afr. Health Sci. 6:223–231. 11. Burke, G. R., H. J. McLaughlin, J. C. Simon, and N. A. Moran. 2010. Dynamics of a recurrent Buchnera mutation that affects thermal tolerance of pea aphid hosts. Genetics 186:367–372. 12. Chen, X., S. Li, and S. Aksoy. 1999. Concordant evolution of a symbiont with its host insect species: molecular phylogeny of genus Glossina and its bacteriome-associated endosymbiont, Wigglesworthia glossinidia. J. Mol. Evol. 48:49–58. 13. Cheng, Q., and S. Aksoy. 1999. Tissue tropism, transmission and expression of foreign genes in vivo in midgut symbionts of tsetse flies. Insect Mol. Biol. 8:125–132. 14. Clement, M., D. Posada, and K. A. Crandall. 2000. TCS: a computer program to estimate gene genealogies. Mol. Ecol. 9:1657–1659. 15. Cummings, S. M., M. McMullan, D. A. Joyce, and C. van Oosterhout. 2010. Solutions for PCR, cloning and sequencing errors in population genetic analysis. Conserv. Genet. 11:1095–1097. 16. Darlu, P., and G. Lecointre. 2002. When does the incongruence length difference test fail? Mol. Biol. Evol. 19:432–437. 17. Degnan, J. H., and N. A. Rosenberg. 2009. Gene tree discordance, phylogenetic inference and the multispecies coalescent. Trends Ecol. Evol. 24:332– 340. 18. Excoffier, L., and H. E. L. Lischer. 2010. Arlequin suite ver 3.5: a new series of programs to perform population genetics analyses under Linux and Windows. Mol. Ecol. Resour. 10:564–567. 19. Farris, J. S., M. Kallersjo, A. G. Kluge, and C. Bult. 1994. Testing significance of congruence. Cladistics 10:315–319. 20. Fu, Y. X. 1997. Statistical tests of neutrality of mutations against population growth, hitchhiking and background selection. Genetics 147:915–925. 21. Funk, D. J., J. J. Wernegreen, and N. A. Moran. 2001. Intraspecific variation in symbiont genomes: bottlenecks and the aphid-buchnera association. Genetics 157:477–489. 22. Geiger, A., et al. 2007. Vector competence of Glossina palpalis gambiensis for Trypanosoma brucei s.l. and genetic diversity of the symbiont Sodalis glossinidius. Mol. Biol. Evol. 24:102–109. 23. Gomez-Valero, L., et al. 2008. Patterns and rates of nucleotide substitution, insertion and deletion in the endosymbiont of ants Blochmannia floridanus. Mol. Ecol. 17:4382–4392. 24. Hurtado, L. A., M. Mateos, R. A. Lutz, and R. C. Vrijenhoek. 2003. Coupling of bacterial endosymbiont and host mitochondrial genomes in the hydrothermal vent clam Calyptogena magnifica. Appl. Environ. Microbiol. 69: 2058–2064. 25. Kolsch, G., and B. V. Pedersen. 2010. Can the tight co-speciation between reed beetles (Col., Chrysomelidae, Donaciinae) and their bacterial endosymbionts, which provide cocoon material, clarify the deeper phylogeny of the hosts? Mol. Phylogenet. Evol. 54:810–821. 26. Krafsur, E. S. 2002. Population structure of the tsetse fly Glossina pallidipes estimated by allozyme, microsatellite and mitochondrial gene diversities. Insect Mol. Biol. 11:37–45. 27. Maddison, D. R., and W. P. Maddion. 2004. MacClade4: analysis of phylogeny and character evolution, 4.08 ed. Sinauer Associates, Sunderland, MA. 28. Marquez, J. G., M. J. Vreysen, A. S. Robinson, S. Bado, and E. S. Krafsur. 2004. Mitochondrial diversity analysis of Glossina palpalis gambiensis from Mali and Senegal. Med. Vet. Entomol. 18:288–295. 29. Moran, N. A., M. A. Munson, P. Baumann, and H. Ishikawa. 1993. A molecular clock in endosymbiotic bacteria is calibrated using the insect hosts. Proc. R. Soc. Lond. B Biol. Sci. 253:167–171. 30. Nogge, G. 1981. Significance of symbionts for the maintenance of an optimal nutritional state for successful reproduction in hematophagous arthropods. Parasitology 82:101–104. 31. Nogge, G. 1976. Sterility in tsetse flies (Glossina morsitans Westwood) caused by loss of symbionts. Experientia 32:995–996. 32. Oliver, K. M., N. A. Moran, and M. S. Hunter. 2005. Variation in resistance to parasitism in aphids is due to symbionts not host genotype. Proc. Natl. Acad. Sci. U. S. A. 102:12795–12800. 33. Ouma, J. O., J. G. Marquez, and E. S. Krafsur. 2007. Patterns of genetic diversity and differentiation in the tsetse fly Glossina morsitans morsitans Westwood populations in East and southern Africa. Genetica 130:139–151. 34. Pais, R., C. Lohs, Y. Wu, J. Wang, and S. Aksoy. 2008. The obligate mutualist Wigglesworthia glossinidia influences reproduction, digestion, and immunity processes of its host, the tsetse fly. Appl. Environ. Microbiol. 74:5965–5974. 35. Phillips, T. A., R. A. VanBogelen, and F. C. Neidhardt. 1984. lon gene product of Escherichia coli is a heat-shock protein. J. Bacteriol. 159:283–287. 36. Picozzi, K., et al. 2005. Sleeping sickness in Uganda: a thin line between two fatal diseases. BMJ 331:1238–1241. 37. Pritchard, J. K., M. Stephens, and P. Donnelly. 2000. Inference of population structure using multilocus genotype data. Genetics 155:945–959. 38. Qin, Y., et al. 2006. The highly conserved LepA is a ribosomal elongation factor that back-translocates the ribosome. Cell 127:721–733. 39. Quicke, D. L., O. R. Jones, and D. R. Epstein. 2007. Correcting the problem
8408
40. 41.
42. 43. 44. 45.
46.
SYMULA ET AL.
of false incongruence due to noise imbalance in the incongruence length difference (ILD) test. Syst. Biol. 56:496–503. Ramos-Onsins, S. E., and J. Rozas. 2002. Statistical properties of new neutrality tests against population growth. Mol. Biol. Evol. 19:2092–2100. Rio, R. V., Y. N. Wu, G. Filardo, and S. Aksoy. 2006. Dynamics of multiple symbiont density regulation during host development: tsetse fly and its microbial flora. Proc. Biol. Sci. 273:805–814. Rissman, A. I., et al. 2009. Reordering contigs of draft genomes using the Mauve aligner. Bioinformatics 25:2071–2073. Rogers, A. R., and H. Harpending. 1992. Population growth makes waves in the distribution of pairwise genetic differences. Mol. Biol. Evol. 9:552–569. Rozas, J. 2009. DNA sequence polymorphism analysis using DnaSP. Methods Mol. Biol. 537:337–350. Rozas, J., J. C. Sanchez-DelBarrio, X. Messeguer, and R. Rozas. 2003. DnaSP, DNA polymorphism analyses by the coalescent and other methods. Bioinformatics 19:2496–2497. Sauer, C., E. Stackebrandt, J. Gadau, B. Holldobler, and R. Gross. 2000. Systematic relationships and cospeciation of bacterial endosymbionts and their carpenter ant host species: proposal of the new taxon Candidatus Blochmannia gen. nov. Int. J. Syst. Evol. Microbiol. 50:1877–1886.
APPL. ENVIRON. MICROBIOL. 47. Swanevelder, Z. H., A. K. Surridge, E. Venter, and A. M. Botha. 2010. Limited endosymbiont variation in Diuraphis noxia (Hemiptera: Aphididae) biotypes from the United States and South Africa. J. Econ. Entomol. 103: 887–897. 48. Swofford, D. L. 2003. PAUP*: phylogenetic analysis using parsimony (*and other methods), 4th ed. Sinauer Associates, Sunderland, MA. 49. Tsuchida, T., R. Koga, H. Shibao, T. Matsumoto, and T. Fukatsu. 2002. Diversity and geographic distribution of secondary endosymbiotic bacteria in natural populations of the pea aphid, Acyrthosiphon pisum. Mol. Ecol. 11:2123–2135. 50. Wang, J., Y. Wu, G. Yang, and S. Aksoy. 2009. Interactions between mutualist Wigglesworthia and tsetse peptidoglycan recognition protein (PGRPLB) influence trypanosome transmission. Proc. Natl. Acad. Sci. U. S. A. 106:12133–12138. 51. Weiss, B. J., J. Wang, and S. Aksoy. 2011. Tsetse immune system maturation requires the presence of obligate symbionts in larvae. PLoS Biol. 9:e1000619. 52. Yoder, A. D., J. A. Irwin, and B. A. Payseur. 2001. Failure of the ILD to determine data combinability for slow loris phylogeny. Syst. Biol. 50:408– 424.