Proceedings of the World Congress on Engineering 2014 Vol I, WCE 2014, July 2 - 4, 2014, London, U.K.
Information Gain as a Feature Selection Method for the Efficient Classification of Influenza Based on Viral Hosts Nermeen A. Shaltout, Mahmoud El-Hefnawi, Ahmed Rafea, and Ahmed Moustafa Abstract—The paper demonstrates the improvement in Influenza A classification based on viral host when applying feature selection on classical machine learning techniques. The impact of using the most informative DNA positions on classifier efficiency and performance was measured. Both decision trees (DTs) and neural networks (NNs) were used. The experiments were conducted on DNA sequences belonging to the PB1 and HA segments of subtypes H1 and H5 respectively. Sequences from each segment were further divided into human and nonhuman hosts prior to classification analysis. Accuracy, sensitivity, specificity, precision and time were used as performance measures. Extracting the best hundred informative positions with information gain increased classification efficiency by 90% for both classifiers, without compromising performance significantly. NNs performed better on both DNA segments than DTs, when decreasing the number of informative positions below a hundred. The classification speed of NNs was improved vastly compared to DTs, when classifying the H1, PB1 segment.
Index Terms—decision tree, feature selection, host classification, Influenza A, information gain, machine learning, neural network, bioinformatics
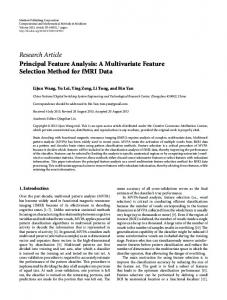
techniques, intends to remedy this, by cutting down the computational time of virus analysis further without drastically sacrificing performance. Of the many recurring infectious diseases, Influenza A was selected for analysis due to its high mutation, morbidity and mortality rates and yearly seasonal outbreaks. Influenza A's vast amount of constantly growing and changing data also makes it more challenging, and time costly to analyze than other viruses. A. Overview of Influenza A’s Properties Influenza A's genetic data is divided into eight RNA segments [1], that can be swapped between different virus strains to produce new viruses. Of these segments, the most important are Hemagglutinin (HA) and Neuraminidase (NA), since they code for the virus’s surface antigens. The target host’s antibodies recognize and destroy the virus via these antigens. Outbreaks usually occur when the mutation of the virus, leads to the production of unrecognizable HA and NA proteins. Due to Influenza A’s rapid mutation rate, there are currently at least 16 HA and 9 NA known subtypes [2]. The combination of the different HA (H) and NA (N) subtypes determines the virus’s strain. E.g. H1N1 is the virus strain which mutated, resulting in the swine flu pandemic. Fig. 1 summarizes the most important features of the Influenza A virus.
I. INTRODUCTION
D
URING epidemics and pandemics, rapid analysis is crucial to identifying the causative infectious virus and its cure. Virus analysis using laboratory techniques is usually time costly, posing a health risk to the handlers. Classical bioinformatics computation techniques, in addition to being time consuming, are too course for detailed virus analysis. Improving the efficiency of machine learning
Manuscript received March 17, 2014; revised March 26, 2014. This work was supported in part by Department of Computer Science in the American University of Cairo. Nermeen A. Shaltout is currently a research student in the Computer Science Department, The American University of Cairo, Cairo Egypt (email:
[email protected]). Ahmed Rafea is currently the chair of the Computer Science and Engineering Department, School of Sciences and Engineering, The American University of Cairo, New Cairo 11835 Cairo, Egypt (e-mail:
[email protected]). Mahmoud El-Hefnawi is currently the chief of research at the Informatics and Systems Department and Biomedical Informatics and Chemoinformatics group, Division of Engineering Research and Centre of Excellence for Advanced Sciences, National Research Centre, Tahrir Street, 12311 Cairo, Egypt (e-mail:
[email protected]). Ahmed Moustafa is a professor in the Biology Department, School of Sciences and Engineering, The American University of Cairo, New Cairo 11835 Cairo, Egypt (
[email protected]).
ISBN: 978-988-19252-7-5 ISSN: 2078-0958 (Print); ISSN: 2078-0966 (Online)
Fig. 1. An overview of the structure of Influenza A virus.
The severity of Influenza A outbreaks is determined by its virulence or mortality rate. Influenza A’s virulence is increased by its capacity to infect a variety of hosts [3]. Based on previous pandemic and epidemic history, the most problematic hosts are human, avian, and swine in nature. Some strains pertaining to these hosts have gained the capability of infecting multiple hosts simultaneously via mutation [3]. To aid in the virus’s analysis, decoded Influenza A sequences are stored in online databases as RNA/cDNA and Protein sequences. These sequences can be WCE 2014
Proceedings of the World Congress on Engineering 2014 Vol I, WCE 2014, July 2 - 4, 2014, London, U.K.
utilized for predicting the target host(s) of the virus in future outbreaks. B. Motivation for Improving the Classification of Influenza A by Host Influenza A’s mutation, through a process known as antigenic drift, causes it to infect its host seasonally [1]. Although the process alters the virus' surface antigens minimally, it still renders them unrecognizable by the host’s antibodies. Typically, Influenza A strains do not intercross species; i.e. Influenza A strains infecting avian and swine species are not transmittable to human hosts and vice versa. In cases where virus strains with interspecies transmission exist, the strain’s virulence is low. However, in some rare cases, the virus undergoes massive changes by a mutation process known as antigenic shift [1]. This in turn leads to the formation of a virulent strain with interspecies transmission ability. During outbreaks, these mutated strains pose a significant health risk to the human population, due to their accelerated spread using swine and avian hosts as intermediaries [4]. By improving the efficiency of machine learning methods for classifying Influenza A by host, the infectious ability of new virus strains can swiftly be assessed in an outbreak’s early stages. C. Related Works Hemagglutinin Inihibtion (HI) and Neuraminidase Inhibition (NI) assay [5], [6] are classical laboratory analysis methods for determining Influenza A’s host and subtype. These processes are time consuming, taking several days to generate results. When used frequently they pose a health risk to the handlers involved. They are unsuitable for rapid virus analysis during emergencies. Identifying the virus with classical computational bioinformatics techniques is also possible, e.g. sequence alignment, phylogenic trees, and the blast algorithm [7], [8]. This is done by comparing the unknown virus sequence against known virus sequences. Although these methods are suitable for identifying variations between different species, they are unsuitable for detecting fine grained, differences within the same species, e.g. Influenza A hosts. The methods are also extremely time costly for utilization with high dimensionality datasets, e.g. Influenza A. To enhance machine learning efficiency, feature selection is often applied to bioinformatics datasets with high dimensionality. Saeys et al. [9] described the pros and cons of three types of feature selection techniques when applied to bioinformatics problems: filter, embedded and wrapper methods. They emphasized that univariate filter methods are favored when analyzing high dimensionality data, due to their speed, scalability and classifier independence. Leung et al.'s [10] utilized a filter method known as information gain to indentify the RNA biomarkers, in the Hepatitis B virus, responsible for causing liver cancer. They utilized Rule Learning and Nonlinear Integrals to classify their data, after the feature selection step. The feature selection technique has not been tried on other viruses. In order for DNA and protein sequences to be suitable for machine learning analysis, they have to be encoded in a format recognizable by the classifiers at hand. Sami A. & Takahashi developed techniques to map DNA to common data mining methods and introduced a technique that suits ISBN: 978-988-19252-7-5 ISSN: 2078-0958 (Print); ISSN: 2078-0966 (Online)
all methods of classification [11]. Salzber et al. created an interpolated Markov model system to locate genes in DNA [12]. Neural network encoding schemes for DNA analyses were discussed by the following researches: Brunak et al. described a direct input encoding scheme, utilizing four units to represent the nucleotides [13]. Demeler & Zhou presented a dense representation using two units for four nucleotides [14]. They demonstrated how this direct encoding scheme performs better than using four units. Wu & Shivakumar discovered an indirect encoding scheme that calculates frequencies of nucleotide bases either individually or in k-tuples [15]. These frequencies are fed to the classifier as input. Farber et al. contrasted the pros and cons of direct versus indirect encoding methods [16]. They proved that indirect 2-Mer frequency representation schemes performed better than direct encoding methods. Attaluri [17] compared and contrasted the effect of different neural network encoding schemes on the classification performance of Influenza A. He discovered that including the gaps in direct encoding schemes generated more accurate classification results. He additionally determined the k-frequencies at which indirect encoding schemes generated the best results. Yuan et al. [18] compared and contrasted decision trees (DTs) and support vector machines (SVMs) in classifying gene expressions. They built a SVM bank holding all the possible encoding schemes for nucleotide sequence data. E.g. the binary code (00 01 10 11) was one of the encoding schemes used for representing the four nucleotides: ‘A’, ‘C’, ‘G’, and ‘T’. The following key researches on Influenza A analysis using machine learning were conducted by Attaluri [17] and El-Hefnawi et al. [19], [20]. El-Hefnawi et al. [19] classified Influenza A hosts and subtypes using hidden Markov models (HMMs). Protein sequences from the HA segment pertaining to subtypes H1, H2, H3, H4 and H5 were used. To classify hosts, the virus sequences were further divided into human and nonhuman hosts. The research yielded an overall subtype classification accuracy of 100%. Accuracies of host classification ranged from 50% to 100%, depending on subtype. Although sequences pertaining to subtypes H1 and H2 yielded higher host classification accuracies, the classification performance was reduced when using sequences pertaining to subtypes H3, and H5. This drop in performance can be explained by the limited number of documented protein virus with human viral hosts for subtypes H3 and H5. The method didn’t analyze classification performance at the RNA level, or the effect of applying of feature selection prior to classification. In another experiment, El-Hefnawi et al. [20] used HMMs and DTs on extracted host associated protein signatures to increase host identification accuracy. The experiments were conducted on the HA protein of various subtypes. DTs yielded higher host classification accuracies, ranging from 92%-100%, as opposed to HMMs. The research did not explore extracting host associated signatures at the RNA level. Attaluri [17] analyzed the use of neural networks (ANNs), decision trees (DTs), and support vector machines (SVMs) for Influenza A hosts and subtypes identification. He conducted the experiments using cDNA and protein WCE 2014
Proceedings of the World Congress on Engineering 2014 Vol I, WCE 2014, July 2 - 4, 2014, London, U.K.
sequences. A subset of virus sequences belonging to the H1N1 strain was used for host classification. Sequences belonging to the H1, H2, H3, N1, and N2 subtypes were used for subtype classification. The overall of classification accuracies, for both subtype and host classification, were 96.5%, 96.2% and 95.1% when using DTs, SVMs and ANNs respectively. Attaluri [17] additionally integrated DTs and HMMs in a singular model to classify Influenza A hosts and subtypes. He used DTs to extract informative positions from the cDNA sequences then converted them into their protein equivalent. The attained protein sequences were then fed as input to a HMM classifier. Both viral host and subtype classification were analyzed. The technique yielded an overall accuracy of 97%. The results attained by Attaluri, however, are not suitable for comparing the performances of the different classifiers used to each other. This was due to the use of varying data along different classifiers. Different classifiers did not always classify the same type of virus hosts. E.g. The DTs and SVMs were trained with sequences infecting swine and human hosts, while the ANNs were trained with sequences infecting human, avian and swine hosts. The type of data used for classification was additionally not consistent. For instance, while DTs and NNs were trained using DNA data, SVMs and HMMs were trained using protein data. Thus, a fair comparison between classifier performances cannot be made. The data was also limited to the H1N1 dataset when analyzing host classification. The capacity of feature selection to improve classification performance in [17] was not thoroughly analyzed. While the integrated model using DTs and HMM performed feature selection using cDNA data, the model did not feed the results directly to the HMM classifier. It instead required the features to be converted into protein format prior to classification. In a situation where a new outbreak occurs, the protein sequences of the corresponding virus strain won’t be initially available, and the aforementioned classification method cannot be used. While the performance of the integrated model was assessed, the effect of the feature selection on classifier efficiency, in terms of speed, was not measured. The study additionally did not explore the effect of using feature selection on other classifiers’ performances other than HMM. In this research, we seek to improve on all the aforementioned points mentioned. D. Aim of the Research The research seeks to analyze the improvement in the classification efficiency of Influenza A hosts when applying feature selection. The effect of feature selection on the overall classifier performances’ will be noted. The system will be implemented by directly feeding informative cDNA extracted in the feature selection step to the classifier(s). This is done without protein conversion to improve RNA/cDNA analysis of the virus when protein data is unavailable. Important signatures, at the RNA level, can also be extracted from these features. The research additionally seeks to determine if the results are repeatable when varying classifiers, virus segments, and virus subtypes. This will be achieved as follows:
ISBN: 978-988-19252-7-5 ISSN: 2078-0958 (Print); ISSN: 2078-0966 (Online)
--Using Information Gain to extract the most informative cDNA positions as features for host classification. --Feeding the extracted informative cDNA positions directly to two different classifiers, neural networks (ANNs) and decision trees (DTs) and analyzing their performance. --Comparing the classification performance attained when using informative positions as input to the base performance where no informative positions are used. --Recording the time taken for classifier construction as a measure for classifier efficiency --Running the experiment on different virus segments: PB1 and HA, belonging to different virus subtypes: H1 and H5. II. INFORMATION GAIN AS A FEATURE SELECTION ALGORITHM FOR INFLUENZA A CLASSIFICATION Based on the research in [9] and the nature of the Influenza A virus, Information Gain (IG) was selected as the feature selection method of choice. Since IG is a filter technique; it can scale well with the high dimensionality data of Influenza A without a vast decrease in performance; it is also applicable on several classifiers due to being classifier independent. The latter is useful in this research’s scope to test the effect of feature selection on the efficiency of more than one classifier. Information gain is able to detect the feature(s) possessing the most information, based on a specific class. It is derived from entropy, using equations (2) to (5). We used Matlab for implementing the IG algorithm. Further details on deriving IG from entropy are in [10]. Entropy is a measure of a class’s uncertainty using the probability of a certain event or attribute. It is inversely proportional to IG. When defined over a binary training set S, entropy is calculated using (1), as shown below:
+ × log
+ ]
- × log
- ]
Where P(+) is the probability of the positive class in the training set and P(-) is the probability of the negative class. When using more than two classes, the entropy is measured using:
∑
log
Where is the number of classes being analyzed. In the scope of this research, the entropy is calculated based on the virus hosts. Since cDNA data is used, the value of the nucleotide positions are consequently used as the classification attributes or features. By calculating the IG of each nucleotide position based on its entropy value, the most informative positions in the sequence can be identified. The number of nucleotide positions, used during classification, can thus be reduced. The entropies of the nucleotide positions are calculated using the probabilities of the nucleotides ‘A’, ‘G’, ‘C’, and ‘T’ over the cDNA sequences used as the training dataset. This is done relative to the Influenza A classes in consideration: avian, human and swine.
WCE 2014
Proceedings of the World Congress on Engineering 2014 Vol I, WCE 2014, July 2 - 4, 2014, London, U.K.
To clarify, consider an example where the virus is being classified based on its host. At position 5 in the sequence, the probability of nucleotide ‘A’, for each of the host classes, is calculated across several sequences. The probabilities are then used to determine the entropy as follows:
The informative positions extracted using IG represent conserved RNA regions in the Influenza A virus, based on host. Although the exact function of most of these regions are not known they can prove to be medically significant if analyzed thoroughly. III. METHODOLOGY SUMMARY
∑
log
(3)
Where A is nucleotide ‘A’, and 1, … , represents the host classes. The entropy is calculated for the other nucleotides, ‘G’, ‘C’ and ‘T’, as shown in (3), for the same nucleotide position. A weighted average of the entropies is then calculated by multiplying the overall probability of each nucleotide in a certain position with the entropy of that nucleotide. E.g. the weighted average of the entropy of nucleotide ‘A’, at a hypothetical position 5, is calculated first by dividing the frequency of ‘A’ in all three classes, at that position, by the total frequency of the nucleotides for all the classes. The result is then multiplied by the entropy of ‘A’. The weighted sum of the nucleotide entropies is termed the remainder, R(X), and is summarized in (4). ∑
∑ ∑
,…,
.
(4)
Where 1, … , represents the nucleotide at a certain aligned site whose sequence is ‘A’, ‘G’, ‘C’, or ‘T’. Assuming the data has K classes represented by , ,…, , then | | is the number of sequences making up class . | | as a consequence is the number of sequences in class, , whose character at the aligned site is i.
|
|
|
|
is thus the probability of nucleotide i, in class
, and
is used to calculate the weighted average. Finally, ,…, , is the entropy of the nucleotide at the same aligned position, based on the K classes. R(X) is calculated once per nucleotide position, over a group of sequences. After determining the remainder, the information gain is calculated using: IGJ=E C –R J
(5)
Where E(C) is the class entropy and J is the nucleotide position. E(C) is calculated, once, using (2). Taking host classification as an example, to calculate E(C), the entropies of the three main classes; swine, avian, and human, are calculated using the number of nucleotide sequences per class. Like the remainder, IGJ is calculated once per nucleotide position, over a group of sequences. This is done by subtracting the remainder, R(J), of each nucleotide position from the value of E(C). Once IGJ is calculated for all nucleotide positions, the positions are arranged by their information gain value in descending order. The best hundred positions with highest information gain are then used to build and train a classifier of choice. As a rule, calculating IG should be done, after the genetic data has been preprocessed by multiple sequence alignment (MSA). This is done to group similar sequences together and unify sequences’ length.
ISBN: 978-988-19252-7-5 ISSN: 2078-0958 (Print); ISSN: 2078-0966 (Online)
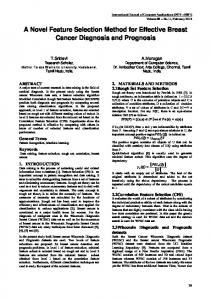
The following chapter explains the experimentation steps. The main steps are: Virus subtype and segment classification, data collection and preprocessing, feature selection using information gain, classifier construction and classifier evaluation. --Subtype and Segment Specification: Sequences belonging to the H1, PB1 and H5, PB2 datasets were selected. Both H1 and H5 subtypes were selected, since they commonly infect human hosts [21]. Compared to the H5 subtype, the H1 subtype has a sufficient number of recorded sequences, infecting human hosts, stored in online Influenza databases. Details of the sequence frequencies per host before preprocessing are available in Table-I. The reason for selecting such varying subtypes, is to assess the performance of using feature selection on classification, in both ideal and non-ideal settings. The two RNA segments, PB1 and HA, were both selected for their biological nature and significance. The HA segment, for instance, is responsible for binding the virus to the host cell’s surface [1]. The RNA sequence of the HA segment contains conserved sequences per host type, giving it the ability to infect each host accordingly. The HA segment was selected, as even the slightest mutation in one of these conserved regions can cause a change in virus’s binding affinity to a certain host cell [1]. The PB1 segment, on the other hand, aids in the creation of RNA polymerase which is responsible for the replication of the virus inside the infected cell [1]. Other than its biological function, it was selected since its sequences are more conserved per host, than the HA segment. Both segments were chosen to contrast and compare between the classifications performances of a stable segment, PB1, with respect to a less conserved segment, HA. To maximize ideal and nonideal scenarios during classification; the first dataset will contain sequences from the PB1 segment of subtype H1; while the second dataset will contain sequences from the HA segment of subtype H5. --Data Collection: Complete and near complete cDNA sequences were selected from online Influenza database: http://flu.lanl.gov. The most important Influenza hosts were selected: Avian, Human and Swine. This was repeated for each specified virus segment and subtype. --Data Alignment: The collected data was aligned using a multiple sequence alignment (MSA) program, to unify the sequences’ length. An online MSA program, Mafft was used, due to its capability to align high dimensionality data rapidly. The FFT-NS-2 function, containing a modified version of Fast Fourier Transform (FFT) was used to achieve this. --Feature Selection: For each segment and each subtype, the best hundred informative positions of the cDNA sequences were determined. This was done by measuring IG across the selected hosts: Avian, Human and Swine. Although the binary classifier built in the scope of this paper WCE 2014
Proceedings of the World Congress on Engineering 2014 Vol I, WCE 2014, July 2 - 4, 2014, London, U.K.
will differentiate only between human and non-human hosts, the IG algorithm is run on all three hosts for future expansion of the project, if needed. --Classifier Construction: Binary classifiers that differentiate human sequences from nonhuman strains were constructed. This was implemented once with neural networks (ANNs) and once with decision trees (DTs). The two aforementioned classifiers were selected for the following reasons: ANNs were chosen for their ability to classify patterns in the presence of noisy or unbalanced data; A common place phenomenon in the Influenza A dataset. DTs were selected due to their ability to generate easy to understand, classification rules. This is important for identifying RNA signatures in Influenza A, specific to each viral host. --Classifier Evaluation: Classifier performance was evaluated by running the set of experiments detailed below: a) Creating Benchmarks: The base classification performance of the DTs and ANNs using raw cDNA, unprocessed by IG, is obtained. b) Measuring the Impact of Feature Selection: IG is used to extract the best hundred informative positions from the cDNA sequence. These positions are then directly fed to the NNs and DTs as input. The classification performance is then analyzed. c) Comparing the Performance: After running both experiments in the first two steps, the classification performance is compared based on accuracy, sensitivity, specificity and precision. The time for classifier construction is recorded and compared to measure classifier efficiency. In this way, the benchmark performance is compared to the performance attained when using feature selection. Fig. 2 provides a summary of the overall methodology described above. It shows how the most important positions in the cDNA data from each segment and subtype are used in order to classify the Influenza A hosts. Virus Subtype and Segment Specification e.g. H1, PB1 e.g.H5,HA Data Collection from Online Influenza Databases by Host (DNA) Human Avian Swine
Multiple Sequence Alignment (Global)
Feature Selection using Information Gain Human
Avian
Swine
Construction of the Binary Classifiers (Human/Non-Human) Neural Networks Decision Trees
section. The results for decision trees are shown in subsection A, while the results for neural networks are shown in subsection B. A. Experiment-1: Measuring the Impact of Using the Most Informative Positions on Classification Performance --Objective: To measure the impact of using the most informative positions on the accuracy or speed of classification. C4.5 decision trees are used to demonstrate this. --Method: The section below explains additional settings and steps used during the classification process. a) Classifier Settings: The training dataset of the DTs is divided into sequences infecting humans and nonhumans respectively. To prevent overtraining, data preprocessing is performed to balance the dataset, as shown in Table-I. The Weka program is used to train, build and test the DTs. The default value of 0.25 was set as the confidence level used for pruning the DTs. The maximum number of branches per tree was set to 3. To guarantee that no overtraining occurs, 10-fold validation is used to train, test, and build the C4.5 DTs. The DT was constructed so that; the nucleotide position represented the DT’s nodes; the nucleotide value of the positions, represented the attributes on the node; and the host classes represented the DT’s leaf nodes. b) Finding the Optimal number of Informative Positions: On the H1, PB1 dataset, the number of informative positions used for building the DT is decreased in increments of 10. The least number of informative positions which can be used without decrease in classification performance is then recorded. The performance of these positions on the host classification using the H5, HA dataset is then tested. --Results: The results of the DT classification for both datasets are summarized in Table-II and Table-III. The time represents the speed in seconds required to build the DTs. Step b) yielded the optimal number of informative positions for classifying the H1, PB1 dataset to be to be 10. Thus the H5, HA dataset was classified once more using 10 informative positions as shown in Table-III. Table-II and Table-III demonstrate the impact of using the most informative positions on DTs as opposed to using raw aligned DNA data. DNA sequences belonging to the H1, PB1 dataset were used to generate the results in TableII, while those belonging to the H5, HA dataset were used to generate the results in Table-III. There is a noted speed increase, when using the most informative positions, in both cases. Table-II shows that the classifier performance remains comparable to the benchmark, when using the H1, PB1 dataset, even when the number of informative positions is decreased to 10. This is not the case with the HA, H5 dataset, as shown by Table-III; the performance deteriorates heavily, when only 10 informative positions are used for host classification.
Classifier Evaluation Time
Accuracy
Sensitivity
Specificity
Precision
Fig. 2. Summary of the Methodology.
IV. RESULTS The following section details the setting used for classification and the corresponding results attained from running the experiment described in the Methodology ISBN: 978-988-19252-7-5 ISSN: 2078-0958 (Print); ISSN: 2078-0966 (Online)
TABLE I. NUMBER OF DNA SEQUENCES PER SUBTYPE AND SEGMENT BEFORE AND AFTER DATA PREPROECESSING. Host Type
Before Preprocessing
After Preprocessing
Subtype H1, Segment PB1
Subtype H5, Segment HA
Subtype H1, Segment PB1
Subtype H5, Segment HA
Human
1505
213
1505
213
Not Human
1342
2380
1342
239
WCE 2014
Proceedings of the World Congress on Engineering 2014 Vol I, WCE 2014, July 2 - 4, 2014, London, U.K. TABLE IV. DIRECT DECIMAL ENCODING SCHEME USED FOR NEURAL NETWORK INPUT. TABLE II. COMPARISON OF THE PERFORMANCE OF DECISION TREES WHEN USING BOTH RAW ALIGNED CDNA DATA AND THE MOST INFORMATIVE POSITIONS IN THE H1, PB1 DATSET. Info. Gain
No. of Inputs
Time (s)
Accuracy
Sensitivity
Specificity
Encoding Scheme
‘A’
0.2
‘G’
0.4
‘C’
0.6
‘T’
0.8
‘-’
1
Precision
No
2422
2.16
98.0%
97.5%
98.6%
98.7%
Yes
100
0.05
98.1%
97.8%
98.4%
98.5%
Yes
10
0.01
98.2%
98.0%
98.4%
98.5%
TABLE III.
COMPARISON OF THE PERFORMANCE OF DECISION TREES WHEN USING BOTH RAW ALIGNED CDNA DATA AND THE MOST INFORMATIVE POSITIONS IN THE H5, HA DATASET Info. Gain
No. of Inputs
Time (s)
Accuracy
Sensitivity
Specificity
Precision
No
1838
0.84
81.25%
87.3%
75.7%
76.5%
Yes
100
0.05
79.2%
89.2%
70.2%
73.1%
Yes
10
0.03
63.8%
89.7%
40.4%
57.7%
B. Experiment-2: Measuring the Impact of Using the Most Informative Positions on a Different Classifier --Objective: To measure the improvement in classification efficiency after applying IG to a different classifier. For demonstration purposes, a three-layered, feed forward neural network (ANN) composed of one input layer, one hidden layer and one output layer is used. --Method: The section below explains additional settings and steps used during the classification process. a) Classifier Settings: The same datasets used in Experiment-1, shown in Table-I, are used to train the ANN. The data is divided into 70% training, 15% testing and 15% validation datasets. This is used instead of using 10-fold validation, due to the nature of the ANN’s architecture. The method prevents overtraining, by early stopping of the training algorithm, when the validation fails on the dataset. Matlab’s neural network toolbox is used for classifier construction. The number of neurons in the hidden layer is fixed at 20 for all experiments. The encoding schemes, summarized in Tables-VI and Table-V, are used for the ANN’s inputs and outputs respectively. A direct decimal encoding scheme is used for the former while a direct binary scheme is used for the latter. b) Finding the Optimal number of Informative Positions: As per Experiment-1, the least number of informative positions that will not deteriorate ANN classifier performance is found and tested on both datasets. --Results: The results of the ANN host classification of both datasets are summarized in Table-VI and Table-VII. The optimal number of informative positions attained from step b) of the Method section was found to be 60 for ANNs. The performance of the H1, PB1 dataset and H5, HA dataset is thus measured when using 100 and 60 informative positions. Using informative positions as input increased the speed for classifier construction without performance deterioration in both datasets as shown in Table-VI and Table-VII.
ISBN: 978-988-19252-7-5 ISSN: 2078-0958 (Print); ISSN: 2078-0966 (Online)
Nucleotide Value
TABLE V. DIRECT BINARY ENCODING SCHEME USED FOR NEURAL NETWORK OUTPUT. Output
Encoding Scheme
Human Host
10
Nonhuman Host
01
TABLE VI. COMPARISON OF THE PERFORMANCE OF NEURAL NETWORKS WHEN USING BOTH RAW ALIGNED DNA DATA AND THE MOST INFORMATIVE POSITIONS IN THE H1, PB1 DATASET. Info. Gain
No. of Inputs
Time (s)
Accuracy
Sensitivity
Specificity
Precision
No
2422
29
98.9%
98.3%
99.6%
99.6%
Yes
100
4
99.0%
98.6%
99.5%
99.5%
Yes
60
3
99.0%
98.5%
99.6%
99.7%
TABLE VII. COMPARISON OF THE PERFORMANCE OF NEURAL NETWORKS WHEN USING BOTH RAW ALIGNED CDNA DATA AND THE MOST INFORMATIVE POSITIONS IN THE H5, HA DATASET. Info. Gain
No. of Inputs
Time (s)
Accuracy
Sensitivity
Specificity
Precision
No
1838
1
80.1%
85.0%
75.5%
76.1%
Yes
100
0
81.7%
92.5%
71.9%
74.9%
Yes
60
0
83.0%
91.1%
75.7%
77.3%
V. DISCUSSION Regarding Experiment-1, Table-II shows that building the DT host classifiers using 100 and 10 informative positions, from the H1, PB1 dataset, increased the classification efficiency without performance deterioration. The accuracy, sensitivity, specificity and precision stayed comparable to the results attained in the benchmark when using raw aligned cDNA data. The speed of classifier construction increased by 97.7% and 99.5%, with respect to the benchmark, when using 100 positions and 10 positions from the dataset respectively. The minimal decrease in performance could be because the H1, PB1 dataset has a sufficient number of virus sequences that infect human hosts. Table-III, on the hand, shows a gradual deterioration in classification performance when training the DT using 100 and 10 informative positions from the H5, HA dataset. When using 100 informative positions, the accuracy, the specificity and the precision of the classifier decreased by 2.5%, 7.5% and 4.4% respectively. This sacrifice in performance is acceptable compared to the 94% increase in speed attained. However, when using 10 informative positions, the accuracy, specificity and precision WCE 2014
Proceedings of the World Congress on Engineering 2014 Vol I, WCE 2014, July 2 - 4, 2014, London, U.K.
deteriorated heavily, decreasing by 21.5%, 46.6% and 24.9% respectively. This is unlike the consistent performance of the H1, PB1 dataset. This shows that when a dataset has insufficient sequences, decreasing the number of informative positions will not properly improve the classification efficiency of DTs. The time for constructing the benchmark classifier using raw aligned cDNA data is less in Table-III than Table-II as the number of sequences used to build and train the classifier, in the former case, is less. Regarding Experiment-2, Table-VI and Table-VII show that, using the most informative positions to train the ANN increased classifier construction speed. This was the case when using both the large and small datasets of H1, PB1, and H5, HA respectively. A significant 87.9% increase in speed was attained when using the H1, PB1 dataset. The speed increase attained when using the H5, HA dataset, however, was insignificant in comparison. This is because the number of sequences in the preprocessed H5, HA dataset, used for classifier training, is less than that of H1, PB1. When using the most informative positions to construct the ANNs, the accuracy, sensitivity, specificity and precision of host classification improved slightly compared to the benchmark classification results. This applied for both the large and small datasets of H1, PB1 and HA, H5 respectively. VI. CONCLUSION The results of Table-II and Table-III show that feature selection using information gain can improve DT classification efficiency provided a sufficient number of informative positions or sequences are used to train the classifier. It additionally shows that DTs are more sensitive to smaller datasets than ANNs. Thus, sufficient informative positions must be used to avoid performance deterioration when the training dataset is too small. The results of Table-VI and Table-VII show that feature selection using information gain greatly increases ANN classifier efficiency, in terms of speed, when using larger datasets. It additionally shows that the number of informative positions used in classification can be decreased further without a marked deterioration in the ANN's performance. This additionally applies for smaller datasets classified using ANNs. The overall results of Table-II, Table-III, Table-VI, and Table-VII prove that using the most informative positions can increase cDNA host classification efficiency or speed. This can be achieved regardless of the classifier used, under two conditions: the dataset used for classification contains a sufficient number of sequences; a sufficient number of informative positions are selected. Based on the above conclusions, feature selection using information gain, can be used to improve the efficiency of cDNA host classification using various classifiers. The method can be used to improve the cDNA classification efficiency of other important Influenza A problems in the field, e.g. Virus subtyping and viral anti-resistance determination.
ISBN: 978-988-19252-7-5 ISSN: 2078-0958 (Print); ISSN: 2078-0966 (Online)
REFERENCES [1] [2]
[3] [4]
[5]
[6]
[7]
[8]
[9]
[10]
[11]
[12]
[13]
[14]
[15]
[16]
[17]
[18] [19]
[20]
[21]
N. M. Bouvier and P. Palese. “The biology of Influenza viruses.” Vaccine, vol. 26, D49-53, Sep. 2008. E. Ghedin, Sengamalay N., Shumway M., Zaborsky J., Feldblyum T. et al., “Large-scale sequencing of Human Influenza reveals the dynamic nature of viral genome evolution,” Nature, vol. 437, pp. 1162–6, 2005. T. Fislova and F. Kostolansky, “The factors of virulence of Influenza A virus,” Acta Virologica, vol. 49, pp.147-157, 2005. G. Gabriel, B. Dauber,T. Wolff, O. Planz, H.D. Klenk, and J. Stech, “The viral polymerase mediates adaptation of an Avian Influenza virus to a mammalian host,” Proc. Natl. Acad. Sci., vol. 102, pp.18590–18595, 2005. J. C. Pedersen, “Hemagglutination-inhibition test for Avian Influenza virus subtype identification and the detection and quantitation of serum antibodies to the Avian Influenza virus,” Methods in Molecular Biology, vol. 436, pp. 53-66. Feb. 2008. J. C. Pedersen, “Neuraminidase-Inhibition assay for the identification of Influenza A virus Neuraminidase subtype or Neuraminidase antibody specificity,” Methods in Molecular Biology, vol. 436, pp. 67-75, 2008. D. S. Song, C. S. Lee, K. Jung, B. K. Kang, J. S. Oh, Y. D. Yoon et al. “Isolation and phylogenetic analysis of H1N1 Swine Influenza Virus Isolated in Korea,” Virus Research, vol. 125, pp. 98-103, 2007. S.F Altschul, T. L. Madden, A.A. Schaffer, J. Zhang, Z. Zhang, W. Miller, D.J. Lipman, “Gapped BLAST and PSI-BLAST: a new generation of protein database search programs,” Nucl. Acids Res., vol. 25, pp. 3389-402, 1997. Yvan Saeys, In˜aki I. and Pedro L., “A review of feature selection techniques in Bioinformatics,” Briefings in Bioinformatics, vol. 23, pp. 2507-2517, 2007. K. S. Leung, KH. Lee, et al., “Data mining on DNA sequences of Hepatitis B virus.” IEEE/ACM Trans Comput Biol Bioinform, vol. 8, pp.428-40, 2011. A. Sami and M. Takahashi, “Decision Tree construction for genetic applications based on Association Rules,” IEEE TENCON 2005, Melbourne. Australia, pp. 21-25, 2005. S.L. Salzber, Al. Delcher, S. Kasif and White O, “Microbial gene identification using interpolated Markov models,” Nucl. Acids Res., vol. 26, pp.544-8, 1980. S. Brunak, Engelbrecht J., Knudsen S., “Neural network detects errors in the assignment of mRNA splice sites,” Nucl. Acids Res., vol 18, pp. 4797-4801, 1990. Demeler B. and G. Zhou, “Neural network optimization for E. Coli promoter prediction,” Nucl. Acids Res., vol. 19, pp. 1593-1599, 1991. C. H. Wu and S. Shivakumar, “Back-propagation and counterpropagation neuralnetworks for phylogenetic classification of ribosomal RNA sequences,” Nucl. Acids Res., vol. 22, pp. 42914299, 1994. Farber. R., A. Lapedes, and K. Sirotkin, “Determination of eukaryotic protein coding regions using neural networks and information theory,” Journal of Molecular Biology, Vol. 226, pp. 471-479, 1992. P. K. Attaluri, Classifying Influenza Subtypes and Hosts using Machine Learning Techniques, ProQuest, UMI Dissertation Publishing, 2012. X. Yuan, Xiaohui Yuan, F. Yang, J. Peng, and B. P. Buckles “Gene expression classification: Decision Trees vs. SVMs,” FLAIRS, 2003. M. El-Hefnawi, Y.M. Kadah, and F. Sherif, “Influenza A subtyping and host origin classification using Profile Hidden Markov Models,” Journal of Mechanics in Medecine and Biology, vol. 12., 2012. M. El-Hefnawi, Y.M. Kadah, and F. Sherif, “Accurate classification and Hemagglutinin amino acid signatures for Influenza A virus hostorigin association and subtyping,” Virology, vol. 449, 2014 C. Scholtissek, W. Rohde, V. Von Hoyningen, and R. Rott, “On the origin of the Human Influenza virus subtypes H2N2 and H3N2,” Virology, vol. 87, pp. 13–20, 1978.
WCE 2014