Hindawi Publishing Corporation International Journal of Agronomy Volume 2013, Article ID 618926, 9 pages http://dx.doi.org/10.1155/2013/618926
Research Article Inheritance and Linkage Map Positions of Genes Conferring Agromorphological Traits in Lens culinaris Medik. Gopesh C. Saha,1 Ashutosh Sarker,2 Weidong Chen,1 George J. Vandemark,1 and Fred J. Muehlbauer1 1 2
Grain Legume Genetics and Physiology Research Unit, USDA-ARS, Washington State University, Pullman, WA 99164, USA International Center for Agricultural Research in the Dry Areas (ICARDA), New Delhi 110012, India
Correspondence should be addressed to Gopesh C. Saha; gopesh
[email protected] Received 4 March 2013; Revised 19 June 2013; Accepted 19 June 2013 Academic Editor: Song Joong Yun Copyright © 2013 Gopesh C. Saha et al. This is an open access article distributed under the Creative Commons Attribution License, which permits unrestricted use, distribution, and reproduction in any medium, provided the original work is properly cited. Agromorphological traits have immense importance in breeding lentils for higher yield and stability. We studied the genetics and identified map positions of some important agro-morphological traits including days to 50% flowering, plant height, seed diameter, 100 seed weight, cotyledon color, and growth habit in Lens culinaris. Earlier developed RILs for stemphylium blight resistance (ILL5888 × ILL-6002), contrasted for those agro-morphological traits, were used in our study. Three QTLs for days to 50% flowering were detected with additive and epistatic effects. One QTL for days to 50% flowering, QLG483 (QTL at linkage group 4 at 83 cM position), accounted for an estimated 20.2% of the variation, while QLG124 × QLG1352 and QLG484 × QLG138 accounted for 15.6% and 24.2% of the variation, respectively. Epistatic effects accounted for most of the variation in plant height, but the main effect of one QTL, QLG84 , accounted for 15.3%. For seed diameter, three QTLs were detected, and one QTL, QLG482 , accounted for 32.6% of the variation. For 100 seed weight, five QTLs were identified with significant additive effects and four with significant interaction effects. The main effect of one QTL, QLG482 , also accounted for 17.5% of the variation in seed diameter. QLG482-83 which appears to affect days to 50% flowering, seed diameter, and 100 seed weight is flanked by RAPD markers, UBC 34 and UBC1. Growth habit and cotyledon color are controlled by single genes with prostrate dominant to erect and red cotyledon dominant to yellow. The QTL information presented here will assist in the selection of breeding lines for early maturity, upright growth habit, and improved seed quality.
1. Introduction Agromorphological traits have immense importance in crop breeding. Crop adaptation, field performance, market value, and demands for specific uses are major factors that drive breeding goals. Linkage maps and QTL analysis are valuable tools for plant breeders to improve breeding efficiency by tagging genes with markers and analyzing the association between markers and traits. The inheritance of quantitative traits and tagging genes such as days to 50% flowering, plant height, seed diameter, and seed weight and qualitative trait genes such as growth habit and cotyledon color in lentil (Lens culinaris Medikus subsp. culinaris) will help breeders in the selection process and understanding interrelationships among traits. Lentil is quantitative long-day plant flowering in progressively longer days [1]. Sometimes it is hard to determine days
to maturity at or near the end of a crop season due to weather conditions. It has been reported that soybean (Glycine max) breeders select lines for optimum maturity based on days to flowering [2]. Sarker et al. [3] reported that flowering time is sensitive to photoperiod and temperature, and that a more complete understanding of genetic control of flowering time in lentil is needed. Roberts et al. [1] proposed four developmental phases of flowering as: preemergence, preinductive, inductive, and postinductive. When lentil plants were transferred from short days (either 8 or 10 h) to long days (16 h), or vice versa, the first two phases and the last are insensitive to photoperiod but are probably sensitive to temperature. So, it is evident that a complex phenomenon controls days to flowering in lentil. Plant height of lentil ranges from 25 to 30 cm for the majority of genotypes but may vary from extremes of 15 to
2 75 cm depending on genotype and environment [4]. Most lentils grown in South Asia, Middle East, and Africa are land races. These are generally short in plant stature, prostrate in growth habit, lack uniformity in pod maturation, have a high incidence of pod shattering, and are low yielding. Tall upright lentil cultivars with high basal pod positions are always preferred by farmers for mechanical harvesting [5]. Sakar [6] reported that three genes were responsible for variation in plant height from the cross of the two lentil cultivars, Laird and Precoz. Tullu et al. [7] reported that plant height is a polygenic trait and QTL detected for plant height has environmental effect. Growth habit has received a great deal of attention from breeders attempting to develop cultivars with more upright stature that are also lodging resistant and adaptable to mechanized harvesting. Ladizinsky [8] indicated that a single gene with incomplete dominance controls growth habit in lentil. Uniformity of seed size, shape, and color is important for marketing of lentil. A wide range of lentil cultivars are used throughout the world. Small diameter red cotyledon types account for most of the lentil production followed by the large-seeded and small-seeded yellow cotyledon types. Lentil seeds are lens shaped and generally weigh between 20 and 80 mg. Their diameter generally ranges from 2 to 9 mm. Seed size differs according to genotype, and researchers frequently follow the classification of Barulina [9] who grouped lentils as macrosperma with large seeds that range from 6 to 9 mm in diameter and microsperma with smaller seeds that range from 2 to 6 mm in diameter. It has been reported that dry seed weight of lentil is controlled by two genes [6], whereas polygenic control of seed weight was reported by Abbo et al. [10]. Cotyledon color of lentil can be red/orange, yellow, or green. Large green lentils with yellow cotyledons are marketed to countries of southern Europe, particularly Spain, Italy, and Greece, and small red cotyledon types are exported to South Asia and the Middle East [11]. The first report of genetics of lentil cotyledon color was studied by Tschermak-Seysenegg et al. [12, 13] and by Wilson et al. [14] and confirmed that cotyledon color is controlled by a single gene and red/yellow cotyledon is dominant over yellow. Singh [15] and Slinkard [16] reported that red cotyledon color is completely dominant over green and yellow. Sharma and Emami [17] detected monogenic and digenic control of cotyledon coloration in lentil. The objectives of the present study were to identify regions of the lentil genome associated with agromorphological traits including days to 50% flowering, plant height, growth habit, seed diameter, seed weight, and cotyledon color that could be utilized in marker-assisted breeding and to improve our understanding of the genetics of these traits.
2. Materials and Methods 2.1. Development of Inbred Lines. In order to identify and map the agromorphological trait genes, a lentil mapping population (F6 derived F7 recombinant inbred lines (RILs)) that was previously developed to determine the genomic locations of the genes for stemphylium blight (caused by
International Journal of Agronomy Stemphylium botryosum Wallr.) resistance was used [18]. The mapping population is comprised of 206 RILs from the cross ILL-5888 (“Uthfola” the popular name and described as a glex pilosae microsperma type; short stature with prostrate growth habit) by ILL-6002 (developed as a pure line selection from Argentinian variety, Precoz, macrosperma type; tall and erect in growth habit). These parents were contrasting for the agromorphological traits (quantitative and qualitative traits) under study. 2.2. Phenotyping. The parents and the mapping population of 206 RILs were grown in silty loam soil at the Washington State University Spillman Agronomy Farm near Pullman, Washington (46∘ 73 N latitude and 117∘ 73 W longitude), USA, in the 2007 and 2008 cropping year. The experimental design was a randomized complete block with three replications. Individual plots were single rows 1 meter long and spaced 60 cm apart and within row plant spacing of approximately 3 cm. Flowering was recorded as number of days from planting to 50% of the plants in the plot with at least one open flower. Plant height was taken at the 50% flowering stage and measured from the soil surface to the tip of the central axis. Seed diameter was measured by using sliding calipers, and 100 seed weight was taken using a Mettler digital balance. Growth habit data were taken based on plant canopy spreading, and cotyledon color was determined visually. All the qualitative and quantitative trait data taken were used for statistical analysis. The combined analysis of variance (ANOVA) of the quantitative traits was done using SAS 9.1. 2.3. Genotyping, Linkage Analysis, and QTL Mapping. DNA extraction and genotyping using simple sequence repeats (SSR), randomly amplified polymorphic markers (RAPD), and sequence-related amplified polymorphic (SRAP) markers were performed following protocols described in Saha et al. [18]. Mapmaker Macintosh V2.0 was used for linkage analysis, and QTL analysis for quantitative traits were conducted following inclusive composite interval mapping (ICIM) method with the following software: QTL IciMapping v2.2 [19] and Q gene 4.2.3 [20] as described by Saha et al. [18]. The intraspecific linkage map was developed with an LOD score of 4.0 and at maximum recombination fraction 0.25. The ICIM methods were used to detect QTLs for the quantitative traits due to the greater efficiency of detection. This method uses stepwise regression models for identifying the significant flanking markers and one-way scanning to identify additive effect and two-way scanning to identify digenic epistatic effect [19].
3. Results and Discussion The agromorphological data of two parents (ILL-5888 and ILL-6002) and 206 RILs were collected at Spillman Agronomy Farm near Pullman in 2007 and 2008 cropping years. The combined ANOVA showed highly significant differences between the parents and among RILs for the four quantitative traits analyzed (Table 1). Highly significant (𝑃 < 0.001) correlations exist between seed diameter and 100 seed weight, and days to 50% flowering and seed diameter and 100
International Journal of Agronomy
3
Table 1: Statistical parameters of quantitative traits of RILs developed from the ILL-5888 × ILL-6002 cross grown at Pullman, WA, USA, in 2007 and 2008 cropping years (combined). Statistical parameters MSE Mean ± sd Range ILL-5888 ILL-6002 Shapiro-Wilk value and probability MSE: Mean sum of squares, and
∗∗∗
Days to 50% flowering (days) 32.6∗∗∗ 51.3 ± 3.5 47–58 53 60 0.875, P = 0
Plant height (cm) 38.6∗∗∗ 25.1 ± 3.8 15.7–34.3 18.2 27.8 0.992, P = 0.466
Seed diameter (mm) 0.83∗∗∗ 4.9 ± 0.5 4.0–6.3 3.7 6.5 0.959, P = 0.001
100 seed weight (g) 1.78∗∗∗ 3.2 ± 0.6 2.0–4.9 2.16 5.59 0.965, P = 0.003
𝑃 < 0.001.
seed weight (Table 2). Plant height was highly significantly correlated with 100 seed weight (𝑃 < 0.001) and significantly correlated with days to 50% flowering and seed diameter (𝑃 < 0.05) (Table 2). The photoperiod sensitivity between two parental lines was also observed due to high genetic differences (data not shown). To map the genes, an intra-specific lentil map of 14 linkage groups comprised of 23 SSRs (simple sequence repeats), 30 RAPDs and 108 SRAPs (sequence-related amplified polymorphisms) and two morphophysiological markers (cotyledon color and growth habit) was used [18]. 3.1. Qualitative Trait Loci 3.1.1. Cotyledon Color. ILL-5888 and ILL-6002 have red and yellow cotyledon colors, respectively. The RILs segregated into a 1 : 1 ratio of red to yellow (Table 3). The clear 1 : 1 segregation ratio of the RILs was consistent with reports of the inheritance of cotyledon color by Tschermak-Seysenegg et al. [12, 13] and Wilson et al. [14]; that is, cotyledon color is controlled by a single gene. All F1 seeds were red and the F2 segregated in a 3 : 1 ratio of red to yellow (99 : 32), indicating that red cotyledon is completely dominant over yellow cotyledon. Singh [15] and Slinkard [16] also reported that red cotyledon color is completely dominant over green and yellow. The cotyledon color gene (Yc) was positioned on LG8 and flanked by RAPD marker UBC40b and SSR marker GLLC511a at 16.4 cM and 13 cM from Yc, respectively (Figure 1). 3.1.2. Growth Habit. ILL-5888 is a prostrate variety while ILL6002 has an erect growth habit. The RILs segregated in a 1 : 1 ratio (Table 3). Based on segregation of the RILs, it can be inferred that a single gene controls plant growth habit in this population. The F1 s (ILL-5888 × ILL-6002) had a prostrate growth habit indicating that prostrate is dominant over erect. The gene for growth habit (Gh) was located at the distal end of LG9 at 77.8 cM position and 35.1 cM apart from the F18XR9b SRAP marker, which is considered as loosely linked with the gene (Figure 1). Ladizinsky [8] made crosses within and between lines of L. culinaris and L. orientalis that differed for growth habit: erect tall with few branches, erect bushy with many branches, and prostrate. He reported that prostrate growth habit was incompletely dominant over erect growth habit. Emami and Sharma [21] also showed that prostrate is dominant over
erect growth habit. On the contrary, Kumar [22] and Mishra [23] reported erect growth habit as completely dominant over prostrate type. These suggest that multiple alleles may confer growth habit, so different inheritance patterns may be observed in different crosses. 3.2. Quantitative Traits and QTLs. The QTLs and epistatic interactions were identified in different linkage groups, but one of the QTLs, QLG482-83 (QTL at linkage group 4 at 8283 cM), accounted for 20.2%, 32.6%, and 17.5% phenotypic variation for days to 50% flowering, seed diameter, and 100 seed weight, respectively. 3.2.1. Days to 50% Flowering. ILL-5888 flowered in 53 days compared to 60 days for ILL-6002. The range for days to 50% flowering among RILs was 47 to 58 days with a mean of 51.3 ± 3.5 days (Table 1). The frequency distribution of the RILs and the normality test (Shapiro-Wilk, 𝑃 = 0) of days to 50% flowering showed two discrete classes and the absence of a normal distribution pattern (Table 1, Figure 2(a)). The ICIM analysis for days to 50% flowering (Table 4) showed the presence of additive and epistatic interaction effects that accounted for a significant amount of phenotypic variation. LODA determines the significance of total variation at the interaction data point, whereas the LODAA value indicates epistatic effects between QTLs. Three significant QTLs were detected with two on linkage group 4 and one on linkage group 13. The QTL detected at the 83 cM position of linkage group 4 (QLG483 ) showed significant additive effects (1.506) that accounted for 20.2% of the phenotypic variation (Table 4). The flanking markers, UBC34 and UBC1, were 1.4 and 1.6 cM from QLG483 (Figure 1). The other two QTLs, QLG47 and QLG1350 , accounted for 14.4% and 10.4% of the variation, respectively (Table 4). QTL, QLG47 , was 7 cM from the GLLC 556 marker on linkage group 4, and QLG1350 was flanked by two SRAP markers, ME5XR7b and F8XEM58b, on linkage group 13 separated by 2.9 cM and 7.2 cM, respectively (Figure 1). The QLG484 × QLG138 and QLG124 × QLG1352 interactions accounted for 24.2% and 15.6% of the phenotypic variation, respectively, and were due to combined additive and epistatic effects. Five other QTL interaction pairs had significant epistatic effects that accounted for 4.6 to 8.0% phenotypic variation each, but the additive effects of the individual QTLs were nonsignificant (Table 4). It should be noted that the QLG484 × QLG138 interaction probably
4
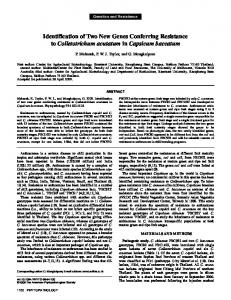
International Journal of Agronomy LG1
LG2
0.0 14.7 23.8 34.3 44.0
F6XEM3a ME2XEM1 F14XEM3b ME4XR16b F9XR16a
78.2 81.6 85.4 98.1 107.6 112.3 120.0 147.3 158.9 164.8 175.9
GLLC607 GLLC548 F6XR8 SSR204a F8XEM5a UBC38b UBC24a
205.3 223.9 231.8 232.4 237.1 256.2
UBC56 GLLC592 F7XEM6a F8XEM1a ME3XEM5c F6XEM2b
F11XR15b F8XR14a UBC33 UBC78b
29.9 54.2 62.3 63.9 68.5 70.7 72.9 76.1 80.1 88.7 101.4 116.3 133.3 163.8 177.7 195.4
ME2XR7a ME2XR16 ME5XR7a ME2XR9b F7XEM4b F7XEM5 F14XEM5a F12XR14d F13XR9b UBC9b F13XR8b SSR48 F11XR7b ME2XR15a GLLC562
229.2 229.8
GLLC108 GLLC106
0.0
ME2XR8a
31.7
F12XR14c
57.9
ME5XEM6b
49.4 56.3
UBC9a UBC57
76.8
F13XR8a
F14XEM3a F14XR8a F8XEM5d
F13XEM5a ME1XR12 ME2XEM14b F11XR15a F10XR9a F8XR14b
96.1
F13XR9a
GLLC541 GLLC598 0.0 GLLC563 7.1 F10XEM1b ME3XEM5b 11.1 F7XR14b 23.5 F12XR15 54.4 F10XR9b GLLC538 F11XEM2b F9XR16b
QTL days to 50% flowering QTL plant height
F7XEM6d F14XEM5b UBC78a UBC43 F13XEM2b F13XR7a ME1XEM5a F13XR7b F13XEM2c
0.0
GLLC556
54.9 66.9 73.8 78.2 80.4 81.6 84.6 99.6 124.9 140.7
UBC7b UBC36 ME1XEM6b ME5XR10 ME4XR16c UBC34 UBC1 UBC119 UBC7a UBC38c
LG8
0.0 7.7 26.3 37.4 53.2 58.1
LG11 0.0 9.8 9.8 13.8 17.4 22.9 29.3 34.0 38.7 49.8 68.1
F7XEM6b
F7XR14a F12XR14b F7XEM4a
130.5 140.6 146.1 149.7 154.4 156.3 164.0 183.3 183.9
LG12 GLLC591 F10XEM3 ME1XEM5b GLLC511b GLLC559
0.0 17.8 34.2 47.2 64.1 88.5 92.1
LG13 0.0 7.7 24.1 27.0 42.8 52.9
LG5
LG4
0.0 3.5 22.5
LG7
LG6
85.2 85.5 102.1
LG3 GLLC609
0.0
0.0 31.3 39.5 44.2 47.1 50.0 57.7 64.9 72.6 91.9 104.1
LG10
LG9 SSR204b UBC40b Yc GLLC511a F13XEM2a GLLC587 GLLC527
F17XR9a UBC52 ME1XEM6a F18XR9a UBC10 F11XEM6 F8XR13 F17XR9c F6XEM3b UBC602 UBC16
UBC24b
0.0 23.4
ME1XR9
42.7
F18XR9b
77.8
Gh
0.0 17.2 23.2 24.1 27.3 33.2 53.8 68.6
UBC151 F6XEM2a F15XEM3 F15XR8 F11XR7a F11XEM2a F8XR14c UBC641b
LG14 UBC 641a F18XEM2 F12XR14a ME2XR14a F8XEM1b ME5XR7b
0.0 20.1 23.7 24.0 28.4 35.0 38.4
ME4XR16d UBC38a F14XEM3c F14XR8c ME3XEM5a ME2XR9a F10XEM1a
QTL seed diameter QTL 100 seed weight
Figure 1: Intraspecific linkage map of lentil at an LOD score of 4.0 and at maximum recombination fraction 0.25. The linkage groups are named (LG1–LG14). Loci names are indicated on the right side, and genetic distances are on the left side of the vertical bar. SSR markers are named as SSR or GLLC-SSR, RAPDs are UBC, and SRAP are F or ME as forward and R or EM as reverse primer.
involves the main effect of QTL QLG483 , and the QLG124 × QLG1352 interaction probably involves the QTL QLG1350 . Study of the inheritance of flowering in Precoz under both Indian and Syrian environments determined that a dominant gene Sn played a major role in early flowering [3]. Tahir and Muehlbauer [24] identified four QTLs on different linkage groups, and Sarker et al. [3] reported single and polygenic systems control of days to 50% flowering based on F2 segregation in different lentil crosses. Tullu et al. [7] identified two QTLs (LG4 and LG12) from one location data and five QTLs (LG1, LG4, LG5, LG9, and LG12) from another location data for days to 50% flowering. We could not compare our QTLs for days to flowering with the QTLs identified by Tullu et al. [7] because the UBC and SSR markers they were using were not polymorphic in
our population. But all the QTL mapping studies on lentil indicate the presence of more than two QTLs for days to 50% flowering. In our study, three significant QTLs were detected, QLG483 , QLG47 , and QLG1350 , that have additive effects and accounted for 45% of the phenotypic variation, and one QTL, QLG483 alone accounted for 20% of the phenotypic variation. The QLG484 × QLG138 and QLG124 × QLG1352 interactions accounted for 24.2 and 15.6%, respectively, of the variation through combined additive and epistatic effects. We found that the 83-84 cM position on LG 4 and the 50–52 cM position on LG 13 contained major QTLs and accounted for significant phenotypic variation for days to 50% flowering. 3.2.2. Plant Height. The RILs varied in height from 15.7 cm to 34.3 cm with a mean of 25 ± 3.8 (Table 1). Frequency
International Journal of Agronomy
5
ILL-5888
ILL-5888
ILL-6002
ILL-6002
30
40
Number of RILs
Number of RILs
30
20
20
10
10
0
0 47
49
51
53
55
57
59
16
20
28
24
Days to flowering
32
34
36
Plant height (cm)
(a)
(b)
ILL-5888
ILL-6002
ILL-6002
ILL-5888
35 40
30
Number of RILs
Number of RILs
30
20
20
10 10
0 4
4.4
4.8
5.2
5.6
6.0
6.4
0 2.0
2.5
3.0
3.5
4.0
4.5
5.0
100 seed weight (g)
Seed diameter (mm) (c)
(d)
Figure 2: Frequency distribution of 2007 and 2008 combined cropping year data of the RILs for (a) days to 50% flowering, (b) plant height, (c) seed diameter, and (d) 100 seed weight of lentil.
Table 2: Correlation between quantitative agromorphological traits (days to 50% flowering, plant height, seed diameter, and 100 seed weight). Trait Days to 50% flowering Plant height Seed diameter 100 seed weight ∗∗∗
𝑃 < 0.001, ∗ 𝑃 < 0.05.
Days to 50% flowering 1.0
Plant height 0.217∗ 1.0
Seed diameter 0.393∗∗∗ 0.207∗ 1.0
100 seed weight 0.411∗∗∗ 0.261∗∗∗ 0.885∗∗∗ 1.0
6
International Journal of Agronomy
Table 3: Chi-square tests for goodness of fit to expected segregation ratios of cotyledon color (Yc/yc) and growth habit (Gh/gh) among RILs developed from the ILL-5888 × ILL-6002 cross grown at Pullman, WA, USA. RILs/parents F6 derived F7 RILs Parents: ILL-5888 ILL-6002 F6 derived F7 RILs Parents: ILL-5888 ILL-6002 ∗
Traits and gene symbol Red cotyledon (Yc) Yellow cotyledon (yc) Red cotyledon (Yc) Yellow cotyledon (yc) Prostrate growth habit (Gh) Erect growth habit (gh) Prostrate growth habit (Gh) Erect growth habit (gh)
Number of RILs 94 75
Expected segregation ratio 1:1
𝜒2 value 2.14∗
92 75
1:1
1.73∗
𝑃 < 0.250 > 0.100.
Table 4: Summary of QTL analysis for days to 50% flowering variation in RILs from the ILL-5888 × ILL-6022 cross. Trait Days to 50% flowering
+
QTL QLG47 QLG483 QLG1350 Interacting QTLs QLG124 × QLG1352 QLG20 × QLG1224 QLG230 × QLG892 QLG282 × QLG3150 QLG2132 × QLG818 QLG350 × QLG794 QLG484 × QLG138
Additive effect −1.262 1.506 1.078 Epistatic effect 0.637 −0.914 0.858 −0.937 0.731 0.744 0.912
LOD 4.84 10.24 4.99 LODA 13.25 6.74 6.09 7.01 4.73 3.81 19.22
PVE+ (%) 14.38 20.18 10.40 LODAA 3.48 6.59 5.89 6.56 4.43 3.74 6.57
PVE+ (%) 15.57 7.26 6.39 7.98 5.07 4.56 24.16
Phenotypic variation explained.
distribution and the normality test for plant height showed the presence of a normal distribution (Shapiro-Wilk, 𝑃 = 0.466) and indicated polygenic control (Table 1, Figure 2(b)). A significant QTL (LOD = 4.9) was detected on LG 8 at the 4 cM position (QLG84 ), and the closest marker, SSR204b, was 4 cM away at the proximal end. QTL QLG84 accounted for an estimated 15.3% of the phenotypic variation for plant height (Table 5, Figure 1). The epistatic effects of QLG376 × QLG836 and QLG382 × QLG46 accounted for 17.6 and 17.3% phenotypic variation, respectively, but additive effects of the interacting QTLs were insignificant (Table 5). The interaction of QLG144 × QLG814 accounted for an estimated 14.6% of phenotypic variation by combined additive and epistatic gene action (Table 5). Six other pairs of QTLs displayed epistatic interactions each affecting 6.8 to 10.7% of the phenotypic variation (Table 5). Epistatic effects of QTLs accounted for a major portion of the phenotypic variation for plant height in our population. Genes close to F13XR8 and Yc markers played a major role for the QLG376 × QLG836 interactions, whereas, for the QLG382 × QLG46 interactions, genes close to the same SRAP marker F13XR8 and GLLC 556 accounted for a significant portion of the variation (Table 5, Figure 1). Tahir and Muehlbauer [24] reported that a gene linked to the Aat-p locus was responsible for increased plant height. Tullu et al. [7] reported that PI 320937 is taller than “Eston” but both contributed to reduced height of lentil plants, and
they identified different QTLs of plant height at two locations, though there is a nonsignificant genotype × environment interaction. They concluded that the chance of simultaneous detection of QTLs at both environments was small due to lack of powerful statistical methods to detect minor QTLs. 3.2.3. Seed Diameter. The parents, ILL-5888 and ILL-6002, had seed diameters of 3.7 mm and 6.5 mm, respectively, and all the RILs were intermediate to the parents. The highest and the lowest seed diameters of the inbred lines were 4.0 and 6.3 mm, respectively, with a mean of 4.9 ± 0.5 mm (Table 1). Frequency distribution of seed diameter of the RILs is bimodal but continuous (Figure 2(c)) indicating that a single major gene or QTL along with minor QTLs was involved in determining seed diameter. Three different QTLs, QLG1112 , QLG482 , and QLG598 , were detected for seed diameter on LG1, LG4, and LG5, respectively. QLG482 , at the 82 cM position of linkage group 4, accounted for 32.6% of the phenotypic variation through large additive effect of 0.293 with an LOD score of 22.2 (Table 6). The QLG482 QTL has the most significant effect by far and may be responsible for the bimodal frequency distribution of the mapping population observed for this trait (Table 6, Figure 2(c)). Two flanking markers, UBC34 and UBC1, were 0.4 cM and 2.6 cM from the QTL, respectively (Figure 1). The other two QTLs, QLG1112 , and QLG598 accounted for 4.5 and 3.6% of the phenotypic variation for seed diameter, respectively (Table 6). Significant
International Journal of Agronomy
7
Table 5: Summary of QTL analysis for plant height variation in RILs from the ILL-5888 × ILL-6002 cross. Trait Plant height
+
QTL QLG84 Interacting QTLs QLG144 × QLG814 QLG144 × QLG822 QLG186 × QLG776 QLG1224 × QLG530 QLG376 × QLG836 QLG382 × QLG46 QLG3164 × QLG1052 QLG466 × QLG1416 QLG572 × QLG1168
Additive effect −1.478 Epistatic effect −0.958 −0.976 1.114 1.21 −1.590 −1.557 −1.103 −1.232 1.267
LOD 4.93 LODA 8.42 4.39 3.26 7.19 11.52 6.64 6.17 6.48 7.98
PVE + (%) 15.33 LODAA 4.12 4.36 3.21 7.06 11.34 6.58 5.93 6.42 6.66
PVE+ (%) 14.57 6.84 8.65 9.92 17.61 17.29 8.84 10.56 10.69
Phenotypic variation explained.
Table 6: Summary of significant QTLs, additive and epistatic effects for seed diameter in RIL population from the ILL-5888 × ILL-6002 cross. Trait Seed diameter
+
QTL QLG1112 QLG482 QLG598 Interacting QTLs QLG262 × QLG2132 QLG262 × QLG2136 QLG130 × QLG140
Additive effect −0.097 0.293 0.109 Epistatic effect 0.113 0.120 0.100
LOD 3.21 22.23 3.25 LODA 3.58 3.59 4.47
PVE+ (%) 3.64 32.63 4.51 LODAA 3.139 3.14 4.24
PVE+ (%) 3.48 3.97 3.72
Phenotypic variation explained.
epistatic interactions of QLG262 × QLG2132 , QLG262 × QLG2136 , and QLG130 × QLG140 with relatively minor effects were observed (Table 6). Cubero [25] reported that a polygenic system governs seed shape and size in faba bean (Vicia faba L.). In chickpea (Cicer arietinum L.), small seed size was found to be dominant in desi × kabuli crosses [26], but Niknejad et al. [27] found polygenic control of seed size and partial dominance for large seededness. Davies et al. [28] reported that three genes control the seed size in peas (Pisum sativum L.). In our study, one major QTL with two minor QTLs and three minor epistatic interactions indicate that genetic control of seed diameter in lentil is controlled by a combination of genetic effects. 3.2.4. 100 Seed Weight. Seed weight is a major yield component. The 100 seed weight of ILL-5888 was 2.16 g and ILL6002 was 5.59 g. The range of 100 seed weight of the RILs was 2.0 to 4.9 g with a mean of 3.2 ± 0.1 g (Table 1). As with seed diameter, the 100 seed weight of the RILs was intermediate to the two parents. The frequency distribution showed a skewed distribution toward light seed (Figure 2(d)). Five QTLs for 100 seed weight were identified on four linkage groups (LG1, LG4, LG5, and LG8) that additively accounted for 5.6 to 17.5% of the phenotypic variation. Two QTLs, QLG482 , and QLG1113 accounted for 17.5% and 12.8% of the phenotypic variation with an LOD score of 15.3 and 11.5, respectively (Table 7). QLG482 was flanked by UBC34 and UBC1 at 0.4 and 2.6 cM, respectively, and
QLG1113 was flanked by UBC38b and UBC 24a at 1 cM and 7 cM, respectively (Figure 1). The epistatic interactions of QLG2158 × QLG2210 , QLG422 × QLG456 , QLG574 × QLG578 , and QLG576 × QLG584 accounted for a significant portion of the phenotypic variation, each accounting for about 9% of the variation (Table 7). Genetics of seed weight of common bean (Phaseolus vulgaris) has been under investigation since the early studies of Johannsen [29]. According to Motto et al. [30], based on a classical quantitative genetics study, seed weight of common bean is quantitatively inherited and affected by at least ten genes with additive effects. In mung bean (Vigna radiata), seed weight is controlled by genes with additive and nonadditive actions and low seed weight is dominant [31]. It has been reported that dry seed weight of lentil is controlled by two genes [6]. Abbo et al. [10] found that seed weight of lentil is under polygenic control with additive and dominant gene action and partial dominance of low seed weight alleles. In our study, two QTLs accounted for relatively high levels of variation supporting the results of Sakar [6], and the frequency distribution was skewed toward low seed weight and indicated the polygenic nature of the control of seed weight and partial dominance for low seed weight, the results supporting Abbo et al.’s [10] findings.
4. Conclusion Agromorphological traits have immense importance in breeding lentils for high yields, yield stability, and market
8
International Journal of Agronomy Table 7: Summary of QTLs, additive and epistatic effects for 100 seed weight in RILs from the ILL-5888 × ILL-6002 cross.
Trait
100 seed weight
+
QTL QLG1107 QLG1113 QLG482 QLG555 QLG834 Interacting QTLs QLG2158 × QLG2210 QLG422 × QLG456 QLG574 × QLG578 QLG576 × QLG584
Additive effect 0.146 −0.219 0.258 0.150 −0.166 Epistatic effect −0.183 −0.159 −0.278 −0.237
LOD 5.47 11.45 15.25 5.40 7.20 LODA 3.47 3.43 3.58 3.01
PVE+ (%) 5.63 12.83 17.52 5.83 7.32 LODAA 3.06 2.63 3.58 2.93
PVE+ (%) 9.19 8.67 9.54 9.26
Phenotypic variation explained.
acceptability. The ICIM (inclusive composite interval mapping) method opens the door for understanding quantitative inheritance with epistatic interactions. Now, it is possible to identify digenic interactions while developing polygenic interaction models to improve the efficiency and accuracy of QTL detection. Taking these interactions into account, it will be possible to formulate breeding and selection procedures for important agronomic and market value traits. We report here the detection of three significant QTLs (QLG47 , QLG483 , and QLG1350 ) for days to 50% flowering, one significant QTL (QLG84 ) for plant height, three significant QTLs (QLG1112 , QLG482 , and QLG598 ) for seed diameter, and five significant QTLs (QLG1107 , QLG1113 , QLG482 , QLG555 , and QLG834 ) for 100 seed weight. QLG482-83 accounted for 20.2%, 32.6%, and 17.5% of the phenotypic variation for days to 50% flowering, seed diameter, and 100 seed weight, respectively. QLG482-83 was flanked by two RAPD markers UBC 34 and UBC 1 at 0.4–1.4 and 1.6–2.6 cM, respectively. The three traits involved are all positively correlated with each other indicating the possibility for linkage or pleiotropic effect in this LG 4 QTL region. Some interacting QTLs accounted for significant phenotypic variation for quantitative traits through additive or epistatic interactions or both. QLG124 × QLG1352 and QLG484 × QLG138 accounted for 15.6% and 24.2% through additive and epistatic effects for days to 50% flowering. For plant height, QLG376 × QLG836 , QLG382 × QLG46 , QLG466 × QLG1416 , and QLG572 × QLG1168 interactions accounted for 17.6%, 17.3%, 10.6%, and 10.7% of the phenotypic variation, respectively. QLG144 × QLG814 both additively as well as epistatically accounted for 14.6% of the phenotypic variation for plant height. Growth habit and cotyledon color were each controlled by single genes with prostrate growth dominant over erect plant type and red cotyledon dominant over yellow cotyledon. Understanding genetics of the quantitative traits will help to develop the breeding strategy for selection. The significant correlations among days to 50% flowering, seed diameter, and 100 seed weight and the association between the gene-rich QTL region (QLG482-83 ) will help the breeders in selecting plants for early maturity and improved seed quality. The putative QTLs will be useful to locate the genes in the genome that are important for the traits and provide the guidance for marker-assisted selection and cloning of the genes.
Acknowledgments The authors are indebted to Sheri McGrew, Tony Chen, Jarrod Pfaff, Lorna Burns, and Tracie Anderson for the field and lab support.
References [1] E. H. Roberts, R. J. Summerfield, F. J. Muehlbauer, and R. W. Short, “Flowering in lentil (Lens culinaris medic.): the duration of the photoperiodic inductive phase as a function of accumulated daylength above the critical photoperiod,” Annals of Botany, vol. 58, no. 2, pp. 235–248, 1986. [2] A. Tulmann Neto and M. C. Alves, “Induction of mutations for earliness in the soybean cultivar Parana,” Brazilian Journal of Genetics, vol. 20, no. 1, pp. 45–50, 1997. [3] A. Sarker, W. Erskine, B. Sharma, and M. C. Tyagi, “Inheritance and linkage relationships of days to flower and morphological loci in lentil (Lens culinaris Medikus subsp. culinaris),” Journal of Heredity, vol. 90, no. 2, pp. 270–275, 1999. [4] M. C. Saxena and G. C. Hawtin, “Morphology and growth patterns,” in Lentils, C. Webb and G. Hawtin, Eds., pp. 39–52, Commonwealth Agricultural Bureaux, Slough, UK, 1981. [5] F. J. Muehlbauer, R. W. Short, R. J. Summerfield, K. J. Morrison, and D. G. Swan, Description and Culture of Lentils, Cooperative Extension, College of Agriculture, Washington State University and USDA-ARS, Washington, DC, USA, 1981. [6] D. Sakar, Breeding behaviour of characters related to yield and adaptation to mechanical harvesting in lentil (Lens culinaris Medik.) [Ph.D. dissertation], Department of Agronomy and Soils, Washington State University, Washington, DC, USA, 1983. [7] A. Tullu, B. Tar’an, T. Warkentin, and A. Vandenberg, “Construction of an intraspecific linkage map and QTL analysis for earliness and plant height in lentil,” Crop Science, vol. 48, no. 6, pp. 2254–2264, 2008. [8] G. Ladizinsky, “The genetics of several characteristics in lentil as indicated by crosses between Lens culinaris and Lens orientalis,” Journal of Heredity, vol. 70, pp. 135–137, 1979. [9] H. Barulina, “Lentils of the USSR and other counties,” Bulletin of Applied Botany, Genetics, and Plant Breeding, vol. 40, pp. 225– 238, 1930. [10] S. Abbo, G. Ladizinsky, and N. F. Weeden, “Genetic analysis and linkage study of seed weight in lentil,” Euphytica, vol. 58, no. 3, pp. 259–266, 1991. [11] F. J. Muehlbauer, “Lentil: improvement in developing countries,” in The Lentil: Botany, Production and Uses, W. Erskine, F. J.
International Journal of Agronomy
[12]
[13]
[14]
[15] [16] [17]
[18]
[19]
[20]
[21]
[22]
[23]
[24]
[25]
[26]
[27]
[28]
[29]
Muehlbauer, A. Sarker, and B. Sharma, Eds., pp. 137–154, CAB International, Oxford, UK, 2009. E. Tschermak-Seysenegg, “Lentil and fieldbean crosses,” Sityringsbe Akad Wiss Wien Math Nat, vol. 137, no. 3-4, pp. 171–181, 1928. F. J. cf. Muehlbauer and A. E. Slinkard, “Breeding methodology,” in Lentils, C. Webb and G. Hawtin, Eds., pp. 69–90, CABICARDA, Farnham, UK, 1987. V. E. Wilson, A. G. Law, and R. L. Warner, “Inheritance of cotyledon color in Lens Culinaris (Medic.),” Crop Science, vol. 10, pp. 205–207, 1970. T. P. Singh, “Inheritance of cotyledon colour in lentil,” Indian Journal of Genetics, vol. 38, pp. 11–12, 1978. A. E. Slinkard, “Inheritance of cotyledon color in lentils,” Journal of Heredity, vol. 69, pp. 139–140, 1978. B. Sharma and M. K. Emami, “Discovery of a new gene causing dark green cotyledons and pathway of pigment synthesis in lentil (Lens culinaris Medik),” Euphytica, vol. 124, no. 3, pp. 349– 353, 2002. G. C. Saha, A. Sarker, W. Chen, G. J. Vandemark, and F. J. Muehlbauer, “Inheritance and linkage map positions of genes conferring resistance to Stemphylium blight in lentil,” Crop Science, vol. 50, no. 5, pp. 1831–1839, 2010. H. Li, J.-M. Ribaut, Z. Li, and J. Wang, “Inclusive composite interval mapping (ICIM) for digenic epistasis of quantitative traits in biparental populations,” Theoretical and Applied Genetics, vol. 116, no. 2, pp. 243–260, 2008. J. C. Nelson, “QGENE: software for marker-based genomic analysis and breeding,” Molecular Breeding, vol. 3, no. 3, pp. 239– 245, 1997. M. K. Emami and B. Sharma, “Linkage between three morphological markers in lentil,” Plant Breeding, vol. 118, no. 6, pp. 579– 581, 1999. Y. Kumar, Inheritance and linkage of genes for morphological traits in lentil (Lens culinaris. Medik.) [Ph.D. thesis], CCS University, Meerut, India, 2002. S. K. Mishra, “Final technical report on development of comprehensive genetic linkage map in lentil (Lens culinaris Medik.),” Tech. Rep., ICAR, New Delhi, India, 2004. M. Tahir and F. J. Muehlbauer, “Gene mapping in lentil with recombinant inbred lines,” Journal of Heredity, vol. 85, no. 4, pp. 306–310, 1994. J. I. Cubero, “Taxonomy, distribution and evolution of faba bean and its wild relative,” in Genetic Resources and Their Explotation: Chickpeas, Faba Beans and Lentils, J. R. Witcombe and W. Erskine, Eds., pp. 131–144, Springer, Berlin, Germany, 1984. J. B. Smithson, J. A. Thompson, and R. J. Summerfield, “Chickpea (Cicer arietinum L.).,” in Grain Legume Crops, R. J. Summerfield and E. H. Roberts, Eds., pp. 312–390, Collins, London, UK, 1985. M. Niknejad, M. Khosh-khui, and S. R. Ghorashy, “Inheritance of seed size in chickpeas (Cicer arietinum L.),” Crop Science, vol. 11, pp. 768–769, 1971. D. R. Davies, G. J. Berry, M. C. Health, and T. C. K. Dawkins, “Pea (Pisum sativum L.).,” in Grain Legume Crops, R. J. Summerfield and E. H. Roberts, Eds., pp. 147–198, Williams Collins Sons, London, UK, 1985. W. L. Johannsen, “Om Arvelighed i Samfund ogrene Linier,” Kongelige Danske Videnskabernes Selskabs Forhandlinger, vol. 3, pp. 235–294, 1903.
9 [30] M. Motto, G. P. Soressi, and F. Salamini, “Seed size inheritance in a cross between wild and cultivated common beans (Phaseolus vulgaris L.),” Genetica, vol. 49, no. 1, pp. 31–36, 1978. [31] B. C. Imrie, Z. U. Ahmed, and J. P. J. Eerens, “Heritability of seed weight in mungbean,” SABRAO Journal, vol. 17, pp. 173– 175, 1985.
Veterinary Medicine International
Scientifica Hindawi Publishing Corporation http://www.hindawi.com
Volume 2014
Hindawi Publishing Corporation http://www.hindawi.com
Volume 2014
International Journal of
Food Science Hindawi Publishing Corporation http://www.hindawi.com
Journal of Botany Volume 2014
Hindawi Publishing Corporation http://www.hindawi.com
Volume 2014
International Journal of
Hindawi Publishing Corporation http://www.hindawi.com
Volume 2014
International Journal of
Ecology
Agronomy
Hindawi Publishing Corporation http://www.hindawi.com
The Scientific World Journal
Hindawi Publishing Corporation http://www.hindawi.com
Volume 2014
Volume 2014
Submit your manuscripts at http://www.hindawi.com Applied & Environmental Soil Science
International Journal of
Biodiversity Hindawi Publishing Corporation http://www.hindawi.com
Hindawi Publishing Corporation http://www.hindawi.com
Volume 2014
Journal of
International Journal of
Forestry Research Hindawi Publishing Corporation http://www.hindawi.com
Volume 2014
Biotechnology Research International Hindawi Publishing Corporation http://www.hindawi.com
Volume 2014
Nutrition and Metabolism Hindawi Publishing Corporation http://www.hindawi.com
International Journal of
Evolutionary Biology Volume 2014
International Journal of
Volume 2014
International Journal of
Cell Biology Hindawi Publishing Corporation http://www.hindawi.com
Hindawi Publishing Corporation http://www.hindawi.com
Hindawi Publishing Corporation http://www.hindawi.com
Hindawi Publishing Corporation http://www.hindawi.com
Volume 2014
International Journal of
Genomics
Volume 2014
International Journal of
Plant Genomics
Hindawi Publishing Corporation http://www.hindawi.com
Advances in
Agriculture Hindawi Publishing Corporation http://www.hindawi.com
Volume 2014
Psyche
Microbiology Volume 2014
Volume 2014
Volume 2014
Hindawi Publishing Corporation http://www.hindawi.com
Volume 2014