Initial Experiences with occam-pi Simulations of Blood Clotting on the Minimum Intrusion Grid Peter H. Welch, Brian Vinter and Frederick R.M. Barnes Abstract—This paper describes our initial experiences of running simple blood-clot simulations on Grid infrastructure. The individual simulations are concurrent process networks programmed in occam-π, containing over ten thousand parallel processes. The Minimum intrusion Grid (MiG) infrastructure is used to distribute program execution and result collection automatically across a set of processing nodes. Index Terms—grid, nanite
simulation, occam-pi,
blood-clot,
I. Introduction
T
HIS paper describes initial experiences of running blood-clot simulations on Grid. The occam-π programming language [1], [2], [3] is used to program individual simulations, that are then distributed for execution across a Minimum-intrusion Grid [4]. Each blood-clot simulation is a simple one-dimensional automaton (a pipeline of cells) and represents a hugely simplified model. Despite this simplicity, useful and informative results have been obtained. This model is a prelude to more elaborate simulations, specifically of artificial/biological blood platelets [5] in the context of project TUNA (Theory Underpinning Nanite Assemblers) [6]. Current models contain tens of thousands of concurrent processes; however, we plan to extend this to the order of (at least) tens of millions of processes for more elaborate and realistic simulations in two or three dimensions. II. TUNA The TUNA project aims to investigate the emergent properties of systems containing millions of interacting agents — nanites or biological organelles (such as blood platelets). Here, goals are achieved by emergent behaviour from force of numbers, not by complicated programming or external direction. Such systems are complex, but not complicated. The clotting model and implementation described here are a gross simplification of what we will eventually require for TUNA. It is crucial, however, that we have a firm understanding and confidence in simple models, before attempting more elaborate ones. We would not wish for any emergent behaviour of the system to be wholly determined by implementation-specific artifacts, such as programming errors arising from a lack of understanding. P.H. Welch and F.R.M. Barnes are members of the Computing Laboratory, University of Kent, Canterbury, Kent, CT2 7NF, England. email: {frmb,phw}@kent.ac.uk B. Vinter is director of the Nordic Data-Grid Facility and a member of the Department of Mathematics and Computer Science, University of Southern Denmark, Odense, Denmark. email:
[email protected]
Unlike systems developed for traditional embedded and parallel supercomputing applications, TUNA networks will be highly dynamic — with elements, such as channels and processes, growing and decaying in reaction to environmental pressures with continually evolving internal topology as the organelles/nanites combine, split and recombine. To model more directly (and, hence, simply) the underlying biological/mechanical interactions, extremely finegrained concurrency will be used. Complex behaviour will be obtained not by direct programming of individual process types, but by allowing maximum flexibility for self-organisation following encounters between mobile processes — randomised modulo physical constraints imposed by their modelled environments. We will need to develop location awareness for the lowest level processes, so they may discover other processes in their neighbourhood and what they have to offer. We will need to synchronise the development of organisms to maintain a common sense of time. III. Minimum intrusion Grid MiG1 is a Grid middleware model and implementation designed with previous Grid middleware experiences in mind. In MiG, central issues such as security, scalability, privacy, strong scheduling and fault tolerance are included by design. Other Grid middlewares tend to suffer from problems with at least one of those issues. The MiG model seeks to be non-intrusive in the sense that both users and resources should be able to join the Grid with a minimal initial effort and with little or no maintenance required. One way to obtain these features is keeping the required software installation to a functional minimum, e.g. the software that is required to run MiG includes only ‘need to have’ features, while any ‘nice to have’ features are completely optional. This design philosophy has been used, and reiterated, so stringently that in fact neither users nor resources are required to install any software that is MiG specific. Another area where MiG strives to be non-intrusive is the communication with users and resources. Users in general and resources in particular can not be expected to have unrestricted network access in either direction. Therefore the MiG design enforces that all communication with resources and users should use only the most common protocols known to be allowed even with severely restricted networking configurations. Furthermore resources should not be forced to run any additional network-listening daemons. 1 MiG is a non-profit project developed by a group of computer scientists from the University of Southern Denmark, Odense (SDU).
request job (https) user
submit job (https)
GRID
job (scp) results (https)
resource
cleanup (ssh)
Fig. 1. MiG architectural overview
Figure 1 depicts the way MiG separates the users and resources with a Grid layer, securely accessed through one of a number of MiG-servers. The MiG model follows a classic client-server model, where the users and resources are clients. The servers are the Grid itself, which in the case of MiG is a set of actual computers, not simply a protocol for communicating between computers. Upon contacting the MiG, any client can request either to upload or download a file. Users can additionally submit a file to the job-queue while resources can request a job. The security infrastructure relies on all entities — users, MiG-servers and resources — being identified by a signed certificate and a private key. The security model is based on sessions and as such requires no insecure transfers or storage of certificates or proxy-certificates as it is seen with some Grid middlewares. MiG jobs are described with mRSL (minimal Resource Specification Language). mRSL is similar to other Resource Specification Languages, but keeps the philosophy of minimum intrusion; thus mRSL tries to hide as many aspects of Grid computing as possible from the user. To hide further the complexities of Grid computing from the user, MiG supplies every user with a Grid home-directory where input and output files are stored. When a job makes a reference to a file, input or output, the location is simply given relative to the user’s home-directory and thus all aspects of storage-elements and transfer-protocols are completely hidden from the user. Users can access their home-directories through a web-interface or through a set of simple MiG-executables for use with scripting. Job management and monitoring is very similar to file access; so it is also done either through the web-interface or with the MiG-executables. Users simply submit jobs to the MiG-server, which in turn handles everything from scheduling and job hand-out to input and output file management. An important aspect is that a job is not scheduled to a resource before the resource is ready to execute the job. Resources request jobs from the MiG-server when they become ready. The MiG-server then seeks to schedule a suitable job for execution at the resource. If one is found, the job (with its input files) is immediately handed to the resource. Otherwise the resource is told to wait and request a job again later. Upon completion of a job, the resource hands the result back to the MiG-server which then makes the results available to users through their homedirectories.
tion of a blood vessel. Each cell maintains internal state indicating whether it contains a ‘clot’. Clots may span one or more cells and grow by aggregation. The model is timestepped by having the cells synchronise on a barrier [7], which is also used to protect access to shared data. Figure 2 shows the process network used in this clot model. Not shown are two additional processes: a ‘generator’ that determines (stochastically) whether a new clot is generated and, if so, injects it into the pipeline; and a ‘target’ process that acts as a sink for clots. Every process (including cells, report cells, the generator, target and display) is registered with the barrier and accesses the shared state and running flag (with read/write access indicated by the dashed arrows. (reporting output)
display
cell
running
draw
(display output)
Fig. 2. Clot model process network
In each barrier-synchronised cycle: • a new clot is generated with probability p. • each clot moves down the pipeline at an average speed proportional to its size. • if clots bump into each other, they coalesce to form a single (and larger) clot. The generation probability p is given as a fraction of 256 (for convenience of simple random number generation). Thus, 0 means that a new clot is never generated, and 256 means that a new clot is generated every time-step. The current design requires that all cells synchronise on the barrier and exchange their state with their neighbours. Every cell is always active, regardless of whether it contains a clot. To allow scaling up an intended three orders of magnitude, future designs will allow processes to resign from this timing barrier when they become idle. A. Cell processes The implementation of the individual cell processes is simple and effective: 1 2 3 4 5 6 8 9
The model used for these simulations is a onedimensional pipeline of ‘cell’ processes representing a sec-
cell
state array
7
IV. Blood clot modelling
report. cell
cell
10 11
PROC cell (BARRIER draw, ..., CHAN CELL.CELL l.in?, l.out!, r.in?, r.out!) WHILE running SEQ SYNC draw -- tick ... I/O-PAR exchange with neighbours ... update local state SYNC draw -- tock ... update externally visible state :
The ‘CELL.CELL’ protocol used for communication between cells is defined with: 1 2 3 4 5 6 7
PROTOCOL CELL.CELL CASE state; BOOL -push; BOOL -pull; BOOL -size; INT -:
full/empty move/no-move move/no-move clump size
The I/O-PAR communications of state, using only the above ‘state’ variant, cannot introduce deadlock — all processes communicate on all their channels in parallel [8]. Other communications, involving the other variants of the ‘CELL.CELL’ protocol, occur in the “... update local state” part of the cell cycle. This part moves clots along, at a (slightly randomised) rate proportional to the size of the clot. The entire coding is given below, using three local boolean variables ‘me.full’, ‘left.full’ and ‘right.full’. The first of these is the cell’s current state, which has been communicated to its neighbours; the latter two are the states received from its neighbours. 1 2 3 4 5 6 7 8 9 10 11 12 13
IF me.full INT clump.size: BOOL move: SEQ -- compute clump size so far IF left.full SEQ l.in ? CASE size; n clump.size := n + 1 TRUE clump.size := 1
14 15 16 17 18 19 20 21 22 23 24 25
-- decide on move IF right.full SEQ r.out ! size; clump.size r.in ? CASE pull; move TRUE SEQ -- our decision move := decide (clump.size) r.out ! push; move
26 27 28 29 30 31 32 33 34 35 36 37 38 39 40
-- tell those behind IF left.full l.out ! pull; move move me.full := FALSE TRUE SKIP TRUE IF left.full l.in ? CASE push; me.full TRUE SKIP
Cells are initially in a state where ‘me.full’ is set to false. If after the state exchange a cell sees that the cell to the left has a clot (‘left.full’ is true), a ‘push’ is communicated indicating whether or not the clot moves. Assuming the clot moved, this is the only place where a cell changes its state from empty to full. Once a cell is part of a clot (‘me.full’ is true), it is either at the head of the clot (and responsible for advancing that clot), in the middle of a clot, or at the tail-end of a clot. At each cycle, the length of a clot is measured (by communicating ‘size’ messages between the clotted cells) and used to determine whether the clot advances. The cell that decides this is the right-most one at the head of the clot, which has ‘right.full’ false. The cell at the head of the clot outputs a ‘push’ message indicating whether the clot is to be moved or not. This is picked up by the next cell along, that must be empty (because this cell had ‘right.full’ false), that either becomes full or empty. Similarly, a ‘pull’ message is communicated to cells behind the head cell, indicating whether the clot is to be moved. The last cell, that has ‘left.full’ false, will become empty if the clot moves forward. This algorithm also handles coalescence when one clot ‘bumps’ into another. The cell at the head of a faster moving clot, that usually sees ‘right.full’ as false, will suddenly see ‘right.full’ as true when it reaches the next clot along. Once this has happened, that head cell becomes part of the larger clot. B. Barrier Synchronisation Barrier synchronisation is expressed in occam-π by its SYNC primitive [7]. The semantics is that any process trying to synchronise on a barrier will block until all processes, registered for that barrier, also try to synchronise. Only when all have synchronised can all continue. In occamπ, barrier overheads are very low — 4 words per barrier for memory costs and around 16 nanoseconds runtime per process per synchronisation (on a 3.2 GHz Pentium IV, assuming no cache hits). The current (simple) model described in this paper has just one barrier, ‘draw’, on which all processes are registered. Each cycle represents one time unit of the simulation. Every cycle of every process is divided into two phases, ‘tick’ and ‘tock’, by barrier synchronisation — see the code at the start of subsection A above. The two phases are used to coordinate safe access to state shared between all processes: a state array used for visualisation of activity in the whole pipeline and a running flag used for termination — see Figure 2 above. Rendering of the state array is managed by the ‘display’ process during its ‘tick’ phase. Each ‘cell’ process shares access to its component of this state array, but only updates that during its ‘tock’ phase (when ‘display’ is not rendering). The running flag is set false only by the ‘display’ process during its ‘tick’ phase. Each ‘cell’ process inspects this shared flag only during its ‘tock’ phase (when ‘display’ is not changing it).
Thus, the barriers are used to ensure deterministic semantics for the shared data. Access conforms to CREW (Concurrent Read Exclusive Write) rules, which eliminate race hazards. For example, when running is made false, all processes observe this in the same cycle (i.e. simultaneously in simulation time) and we have deadlock-free termination. A more detailed description of these techniques, including the concept of resignation from barriers — necessary for the lazy evaluation of more complex models — is given in [7]. C. Reporting
Fig. 3. Clot model visualisation
Reporting cells are largely the same, except that the cell maintains a count of how many consecutive clots are pushed through it, reporting and resetting this value whenever the cell state changes (i.e. when a whole clot enters or leaves the cell). The output from a particular reporting cell includes the reporting cell’s position (along the 1-dimensional pipe), the current time (in barrier ‘SYNC’s), and the size of the clot (for end-clot reports only). For example: clotfixed 1 0 74 1 0 75 0 1 100 202 1 100 203 0 1 ... 9800 552603 9800 552641 9900 552922 9900 552943
2000 30 (1073741823) 100
1 0 10 1 0 10
To aid identification, the report starts with a line describing its parameters. In this case, a probability of 1/256 for a total of 2000 clots, updating the display every 230 frames (i.e. only once), and with reporting cells every 100 along the pipe. Some basic post-processing is done on this data to produce surface-plot histograms of clot distribution, described in section V. D. Visualisation Visualisation of the clot model (if desired) is handled by a ‘display’ process, that reads and displays the sharedstate. The display update frequency is adjustable, depending on the desired resolution. Both text-based and graphics-based visualisations have been written. Advantages of the graphics display include a faster display update and the ability to visualise large models (e.g. a 1000x1000 window at 1 pixel-per-cell allows approximately 1 million cell processes to be visualised). Figure 3 shows a screen-shot of a visualisation for a 100x50 cell grid (arranged as a 1-dimensional ‘pipe’) using 16 pixels-per-cell and with a 4/256 probability of clot injection at the start of the ‘pipe’ (top-left in the picture). The pipeline is displayed “snaking” down the image, with the first cell at the top-left, the next cells moving
right along the first row, then left along the second row, etc. Reporting cells (that could be shown differently if required) might typically be placed every 100 cells, i.e. at the end of each row in the display. In the early rows of Figure 3, only small (mainly singlecelled) clots are seen. Further down the pipeline (blood vessel), small randomised variations in their speed have resulted in them bumping and coalescing into larger and slower moving clots. Even so, they manage to flow away fast enough that the faster moving singletons behind them coalesce into similarly large clots that cannot catch them and the stream continues to flow. With higher probabilities of clot injection (not shown in the above figure), larger clots are formed that move slower still. Above a threshold (to be found by in silico experiment), these larger clots cannot escape being caught by smaller clots behind them — which leads to eventual catastrophic clotting of the whole system. Further discussion is postponed to Section V. E. Blood clot modelling on MiG The overall blood-clot model experiment is nothing more than a parameter sweep across a set of probabilities. Thus the entire experiment can easily be split into a set of independent jobs, where each job simply represents a single probability. Since we are running a stochastic model, each experiment must be run a number of times, in this case we have chosen 10, to return a trustworthy average. Running an application on Grid is often quite demanding. In addition to writing the Grid job description, the binary has to be placed on a storage-element which can be referred to in the job-description file. To make matters worse the binary has to match the environment on the executing resource, CPU architecture, operating system and dynamic libraries. Dynamic libraries are an especially frequent source of problems, but fortunately the KRoC occam-π complier is able to produce very tight static binaries. With the model of a user/home-directory in MiG and the quite portable static binaries of the clot model, we were able to completely ignore the usual problems with gridifying the execution. The next step was to create job descriptions in mRSL. Since we already knew how to run the jobs manually from
the command line, this was mostly a matter of filling in the command line information in an mRSL template. Output files that were explicitly fetched from the cluster in the initial setup were specified as output files in the mRSL to make them automatically available in the MiG home directory after job execution. ::EXECUTE:: ./clotbin 1 2000 30 100 1> /dev/null \ 2> chance_1-0 ::EXECUTABLES:: clotbin ::OUTPUTFILES:: chance_1-0 ::CPUTIME:: 9000 Fig. 4. mRSL specification for a clot-model run with probability 1
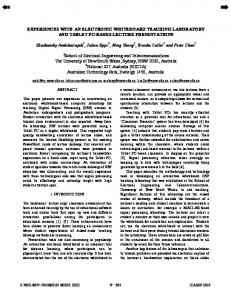
The mRSL script should be easy to understand. The ‘::EXECUTE::’ block holds the commands to be run in the job, which in this case is ‘clotbin’. The clotbin binary should be run with the parameters ‘1 2000 30 100’, the first of which is the probability (as a fraction of 256), the second is the total number of clots generated at the source, the third is the display update frequency (as a power of two), and the fourth is the frequency of reporting cells. Since we are not interested in the display here (redirected to the ‘null’ device), the display update interval is set to 30 (approximately every 1 billion cycles). Under ‘::EXECUTABLES::’, clotbin is listed, meaning that this file should be copied from the user’s homedirectory to the resource before the execution should begin, and the executable flag should be set. Under ‘::OUTPUTFILES::’ only ‘chance 1-0’ is listed, meaning that only that file should be copied to the user’s homedirectory after job-completion. Finally ‘::CPUTIME::’ is set to 2.5 hours, to ensure that the job will have sufficient time to complete. For each probability between 1/256 and 32/256, ten individual jobs were submitted, with the output filename incorporating the probability (1-32) and run-number (0-9). All jobs were submitted at the same time and thus the first jobs started running almost immediately while the last jobs were queued for some time. The resources that were made available to the clot model experiments differed from 1.7 GHz Intel Celeron CPUs to, 3.2 GHz Intel Xeon64 CPUs. This combined with the varying execution times of the individual jobs, meant that overall execution times varied from a minimum of 54 seconds to a maximum of more than 8 days! The minimum, maximum and average times for total turnover time, time in queue and time for execution can be seen in figure 5.
Fig. 5. Execution statistics
V. Results Initial results from this clot model are encouraging. To allow some comparison between the different probabilities, some data-sets have been trimmed-down — once a clot has become sufficiently large it ‘backs-up’ the system to the source, advancing relatively slowly. Figure 6 shows the distribution of clots by reporting-cell position and clot-size, plotted as a histogram. Note that graphs are rotated 180 degrees on the horizontal plane, placing the origin at the far-right. With an injection probability of 1/256, small clots survive for a relatively long time — some even making it to the end of the cell pipeline without bumping into any other clots! As the clots advance down the pipeline, however, many will bump into each other and coalesce into larger clots. This is reflected by the gradual increase in larger clots, as a function of reporting-cell position (i.e. the graph traced at the bottom of the horizontal plane). Clot sizes of 8 are shown to be the most common at the end of the pipeline for this simulation (10, 000 cells). If the simulation were made for a longer blood vessel, larger clots would accumulate. Once a sufficiently large clot forms, it will not be able to exit the vessel before the clots behind it catch up and merge. This condition is shown in the frequency plots of figure 6 for injection probabilities 8/256 and above. New clots join faster than larger clots further down the vessel can move. The whole system backs-up into one giant clot (that drains away very slowly once the fixed number of injected clots, set for each run of the model, has been generated). Figure 7 shows the maximum clot-size by reporting cell for each of the probabilities. At a certain point (interpreted by reporting-cell position), the system starts to block. These points are clearly visible in the graph, where the behaviour of the line changes. Some injection probabilities (e.g. below 8/256), do not jam the system — or rather, we have yet to build a system sufficiently large to jam at those levels. Probabilities above 8/256 jam the system fairly quickly. Note: the maximum clot sizes are (artificially) limited to 2000 for these runs.
2000 clots, probability 1/256
2000 clots, probability 2/256
frequency
frequency 10000
10000
10000 10000
1000 1000
1000 1000
100 100
100 100
10 10
10 10
1
1
1
1
0 10000
0
20 8000 6000 4000 reporting position
10000
40 60 2000
clot size
80 0100
20 8000 6000 4000 reporting position
2000 clots, probability 4/256
40 60 2000
clot size
80 0100
2000 clots, probability 8/256
frequency
frequency 10000
10000
10000 10000
1000 1000
1000 1000
100 100
100 100
10 10
10 10
1
1
1
1
0 10000
0
20 8000 6000 4000 reporting position
10000
40 60 2000
clot size
80 0100
20 8000 6000 4000 reporting position
2000 clots, probability 16/256
40 60 2000
clot size
80 0100
2000 clots, probability 32/256
frequency
frequency 1000
10000 10000
1000 1000
1000
100
100
100
10
10
100 10 1
1
10 1
1
0 10000
20 40
8000
6000 4000 reporting position
60 2000
80
clot size
0100
0 10000
20 40
8000
6000 4000 reporting position
60 2000
80
clot size
0100
Fig. 6. Clot frequency by reporting cell position
A. TUNA interpretation The clotting model presented here is particularly simple. It has been developed to try out techniques that need to be matured before the real modelling can be attempted. Nevertheless, unprogrammed behaviour has emerged that is encouraging and relevant to our TUNA investigations.
For example, considering the 1-dimensional pipeline as a capillary in the blood circulation system, these results reflect certain observed realities. Above a certain length and clot probability (resulting from tissue damage), such a capillary always becomes ‘blocked’. For the introduction of nanites implementing artificial
10000
maximum clot-size
1000
100
10
1/256 2/256 4/256 8/256 16/256 32/256
1 0
1000
2000
3000
4000 5000 6000 reporting position
7000
8000
9000 10000
Fig. 7. Maximum clot size by reporting cell position
blood platelets, getting the balance right between the stimulation and inhibition of clotting reactions will be crucial to prevent a catastrophic runaway chain reaction. This model is a crude (as yet) platform for investigating the impact of many factors on that balance. Addressing these issues in considered in the final section below. VI. Conclusions and future work Despite the particularly simple clotting model, interesting results have been obtained and relevant modelling techniques explored. However, our ambitions in the TUNA project call for scaling the size of these models through three additional orders of magnitude (i.e. tens of millions of processes) and hard-to-quantify orders of complexity. We will need to model (and visualise) two and three dimensional systems, factor in a mass of environmental stimulators and inhibitors and distribute the simulation efficiently over many machines (to provide sufficient memory and processor power). We do not believe that simple cellular automata, as described in this paper, will be sufficient. We need to develop lazy versions, in which cells that are inactive make no demands on the processor. We also need to concentrate our modelling on processes that directly represent nanites/organelles, that are mobile and that attach themselves to particular locations in space (which can be modelled as passive server processes that do not need to be time-synchronised). Barrier resignation will be crucial to manage this laziness; but care will need to be applied to finding design patterns that overcome the nondeterminism that arises from unconstrained use — see [7]. Successfully building such models will be a strong testing ground for the dynamic capabilities (e.g. mobile processes, channels and barriers) built into the new occam-π
language, its compiler and runtime kernel. Currently, occam-π is the only candidate software infrastructure (of which we are aware) that offers support for our required scale of parallelism and relevant concurrency primitives (backed up with compiler-checked rules against their misuse). We believe that we will need the very high level of concurrency to give a chance for interesting complex behaviour to emerge that is not pre-programmed and, for the safety critical application we have in mind, closely corresponds to reality. We need to be able to capture rich emergent behaviour to investigate and develop the necessary theories to underpin the safe deployment of Nanite technology in human medicine and elsewhere. How those theories will/may relate to the process algebra underlying occam-π semantics (i.e. Hoare’s CSP [9] and Milner’s πcalculus [10]) is a very interesting and very open question. This work will contribute to the (UK) ‘Grand Challenges for Computer Science’ areas 1 (In Vivo – In Silico [11]) and 7 (Non-Standard Computation [12]). References [1] P. Welch and F. Barnes, “Communicating mobile processes: introducing occam-pi,” in 25 Years of CSP, ser. Lecture Notes in Computer Science, A. Abdallah, C. Jones, and J. Sanders, Eds., vol. 3525. Springer Verlag, Apr. 2005, pp. 175–210, to appear. [2] F. R. Barnes, “Dynamics and Pragmatics for High Performance Concurrency,” Ph.D. dissertation, University of Kent, June 2003. [3] F. Barnes and P. Welch, “Prioritised dynamic communicating and mobile processes,” IEE Proceedings – Software, vol. 150, no. 2, pp. 121–136, Apr. 2003. [4] H. Karlsen and B. Vinter, “Minimum intrusion grid – the simple model,” in Proceedings of ETNGRID-2005, Workshop on Emerging Technologies for Next Generation GRID (ETNGRID2005), June 2005, to appear. [5] R. Freitas, “Clottocytes: artificial mechanical platelets,” in Nano-medicine, 2000, available at http://www.imm.org/ Reports/Rep018.html. [6] S. Stepney, P. Welch, F. Pollack, J. Woodcock, S. Schneider, H. Treharne, and A. Cavalcanti, “TUNA: Theory underpinning nanotech assemblers (feasibility study),” Jan. 2005, EPSRC grant EP/C516966/1. Available from: http://www.cs.york.ac. uk/nature/tuna/index.htm. [7] F. Barnes, P. Welch, and A. Sampson, “Barrier synchronisations for occam-pi,” in Proceedings of the 2005 International Conference on Parallel and Distributed Processing Techniques and Applications (PDPTA’2005). CSREA press, June 2005, to appear. [8] P. Welch, G. Justo, and C. Willcock, “Higher-Level Paradigms for Deadlock-Free High-Performance Systems,” in Proceedings of the 1993 World Transputer Congress. IOS Press, Netherlands, September 1993, pp. 981–1004, iSBN 90-5199-140-1. [9] C. Hoare, Communicating Sequential Processes. London: Prentice-Hall, 1985, ISBN: 0-13-153271-5. [10] R. Milner, J. Parrow, and D. Walker, “A Calculus of Mobile Processes – parts I and II,” Journal of Information and Computation, vol. 100, pp. 1–77, 1992, available as technical report: ECS-LFCS-89-85/86, University of Edinburgh, UK. [11] R. Sleep, “In Vivo ⇔ In Silico: High fidelity reactive modelling of development and behaviour in plants and animals,” May 2004, available from: http://www.nesc.ac.uk/esi/events/ Grand Challenges/proposals/. [12] S. Stepney, “Journeys in Non-Classical Computation,” May 2004, available from: http://www.nesc.ac.uk/esi/events/ Grand Challenges/proposals/.