Ant Colony Optimization (ACO) is a meta-heuristic inspired by the emergent ... ants [4]. Classification is a central problem in the fields of data mining and ...
Procedia Computer Science Volume 53, 2015, Pages 248–256 2015 INNS Conference on Big Data
Instance Selection with Ant Colony Optimization Ismail M. Anwar1 , Khalid M. Salama2 , and Ashraf M. Abdelbar3 1
Dept. of Computer Science & Engineering, American University in Cairo, Cairo, Egypt 2 School of Computing, University of Kent, Canterbury, UK 3 Dept. of Mathematics & Computer Science, Brandon University, Manitoba, Canada
Abstract Classification is a supervised learning task where a training set is used to construct a classification model, which is then used to predict the class of unforeseen test instances. It is often beneficial to use only a subset of the full training set to construct the classification model, and Instance Selection is the task of selecting the most appropriate subset of the training set. In many cases, the classification model induced from the reduced training set can have better predictive accuracy on test instances. ADR-Miner is a recently introduced Ant Colony Optimization algorithm for Instance Selection that aims to produce classification models with improved test set predictive accuracy. In this paper, we present an extension of ADR-Miner, where one classification algorithm is employed in the instance selection process, and potentially a different algorithm is employed in the final model construction phase. We evaluate performance using 37 UCI datasets, and we note the combinations of algorithms which produce the best results. Keywords: Selection
1
Ant Colony Optimization (ACO), Data Mining, Classification, Data Reduction, Instance
Introduction
Ant Colony Optimization (ACO) is a meta-heuristic inspired by the emergent behaviour of real ants [4]. Classification is a central problem in the fields of data mining and machine learning, which attempts to learn the relationship between the input attributes and a class in a training dataset so as to be able to predict the class of instances in unforeseen datasets. Because real world datasets will often contain noise, erroneous data, outliers, and mis-labeled and irrelevant instances, the data presented to a data mining algorithm will commonly first go through a phase that either removes attributes, removes instances, or both before it is processed. This pre-processing phase, known as data reduction, aims to improve the predictive effectiveness of the produced classifiers by reducing the number of aforementioned data anomalies. In addition, data reduction also has the benefit of decreasing the dataset processed by the learning algorithm by retaining only the most representative instances. Due to the high utility of performing data reduction, it is usually included in the pipeline of most real world classification applications. 248 Selection and peer-review under responsibility of the Scientific Programme Committee of INNS-BigData2015 c The Authors. Published by Elsevier B.V. �
doi:10.1016/j.procs.2015.07.301
Instance Selection with ACO
Anwar, Salama and Abdelbar
ADR-Miner, a recently proposed algorithm by the authors [2], is an adaptation of the ACO meta-heuristic to perform data reduction via instance selection, in order to improve the predictive models of the produced classifiers. In previous work [2], the ADR-Miner algorithm was evaluated on 20 benchmark datasets, using three different, well-known classification algorithms (1-Nearest-Neigbour, Ripper, and C4.5). For each of the three used classification algorithms, ADR-Miner used the same algorithm in the process of performing the data reduction (for evaluating the quality of the candidate solutions), as well as building the final classifier based on the best reduced dataset. The experimental results showed a marked statistically significant improvement in the effectiveness of the classifiers produced, according to the Wilcoxon signedranks test [2]. In this paper, we extend the work in [2] in three different ways. First, we present an extension of ADR-Miner where one classification algorithm is used in the instance selection process, and potentially another classifier is used for the final model construction. We investigate the use of various combinations of two different classification algorithms as follows. For each pair of algorithms, one is used for evaluating the candidate solutions (i.e., reduced sets) during the course of the ACO algorithm, while the other is used to build the final classification model based on the best produced reduced set by the ACO algorithm. Second, we use five different classification algorithms, instead of three as in [2], in our computational experiments. In particular, we examine all the possible pairings of five classification algorithms: support vector machines, nearest neighbour lazy classifier, C4.5 decision tree induction algorithm, Ripper rule induction algorithm and the Naive-Bayes classifier [17]—twenty-five algorithm configurations in all, compared to only 3 algorithm configurations in [2]. Third, we increase the number of the evaluation datasets from 20 to 37, which were obtained from the UCI Machine Learning Repository, in order to identify the pairs that produced the best predictive results.
2
Ant Colony Optimization Overview
Ant Colony Optimization (ACO) is a meta-heuristic search and optimization method that is inspired by the “intelligent” behaviour of natural ant colonies when they are foraging for food, and it has been widely used to solve (mainly combinatorial) optimization problems [4]. The basic principle of ACO is that a population of artificial ants cooperate with each other to find the best path in a graph, representing a candidate solution to the target problem. The way the artificial ants cooperate with each other is inspired by the way that natural ants cooperate to find the shortest path between two points in a given terrain, such as their nest and a food source. When an ant constructs a candidate solution, it deposits an amount of pheromone proportional to the solution’s quality in the region of the search space where that solution is located. With time the ants tend to converge to paths representing near-optimal solutions in the search space. Classically applied to combinatorial optimization problems, ACO has also been successful in tackling classification problems. A number of ACO-based algorithms have been introduced in the literature with different classification learning approaches [6, 7, 8, 9, 10, 11, 12].
3
Data Reduction Background
Data reduction is a vital preprocessing task for classification and its significance lies in that it removes noisy, outlier and other instances from the training data set that can be detrimental or misleading to the algorithm learning a model. In addition to improving accuracy, it also reduces 249
Instance Selection with ACO
Anwar, Salama and Abdelbar
the size of the training set before it is presented to the machine learning algorithm. The use of a reduced training set results in shorter training times for eager-learning classification algorithms, such as decision trees, classification rules and probabilistic models. For lazy-learning algorithms, such as nearest neighbor(s), the reduced data set decreases the time needed for arriving at the class of a new instance in question. In addition, a smaller dataset would require less resources for storage and maintenance. One of the earliest algorithms for data reduction is Wilson editing [15], also known as editing nearest neighbor. This algorithm attempts reduction by going through the instances and removing those that are incorrectly classified by their nearest neighbors, typically considering the three closest neighbors. Two known extensions of Wilson editing are Repeated Edited Nearest Neighbor (RENN) and All k-Nearest Neighbors (All-kNN) [14]. The IB2 and IB3 [1] algorithms, part of the Instance-Based learning (IB) family of algorithms, are incremental lazy learners that perform reduction by means of instance selection. With IB2, a new instance is added to the set of maintained instances by the lazy classifier if and only if it cannot be correctly classified by the set already maintained. At the end, this maintained set then becomes our reduced set. IB3 enforces a policy that removes instances from the maintained set if they contribute negatively to the classification. This is done by keeping track of how well instances in the maintained set classify instances in the training set. Wilson et al. [16] introduced the DROP family of reduction algorithms. DROP1 performs reduction by considering whether removing an instance would result in a misclassification of its neighbors. If that is not the case, the instance is removed. The algorithm does this iteratively for each instance in the data set, and the remaining set of instances after this whittling then becomes the reduced data set. DROP2 differs from DROP1 in that during the algorithm’s iterations, it will consider the effect of leaving a considered instance on the misclassification of deleted instances in previous iterations as well as those which remain. DROP2 also adds an ordering to the process of removing instances. Other extensions to the same family include DROP3, DROP4 and DROP5. Iterative Case Filtering (ICF) is an instance selection algorithm introduced in [3]. ICF achieves reduction over two phases: first it performs regular Wilson editing, with a neighborhood size typically of 3, then it builds two sets for each instance that still remains: a reachable set and a coverage set. The reachable set consists of those instances that include the current instance in their neighborhoods. The coverage set comprises those instances that have the current instance as a neighbor. After having built those sets, the algorithm then removes those instances that have a reachable set larger than their coverage sets. These instances are considered superfluous and their removal should not affect the quality of a classifier built using the remaining instances. ICF has proven to be an effective data reduction algorithm in terms of maintaining the predictive power of the predictive models and reducing the size of the used training data [3].
4
The ADR-Miner Algorithm and Its Extension
The authors have recently proposed ADR-Miner [2], an ant-based algorithm to perform data reduction with an emphasis on improving a classifier’s predictive effectiveness. The ADR-Miner uses a classification algorithm in two different phases during its execution, to serve two different purposes. The first phase is during the optimization phase, while the algorithm tries to find the best reduced instance set, using a classifier g to evaluate the quality of each instance set. Then, in the second phase, after the ACO procedure converges on the best reduced instance set Rbsf , a classifier h is applied to Rbsf to produce the final classification model Mf inal . In our previous work, the assumption was that the same classifier would be used in both cases, 250
Instance Selection with ACO
Anwar, Salama and Abdelbar
and our previous experimental results considered the performance of three different classifiers (1-NN, Ripper, and C4.5) for this double-role. Our hypothesis, in the present work, is that it is not necessary to use the same algorithm g in both phases to produce the best possible final classifier Mf inal . Hence, we experiment with this hypothesis by allowing ADR-Miner to use two (possibly different) classification algorithms, g and h, in the first phase (for candidate reduced sets evaluation), and the second phase (for final classifier construction), respectively. Our experimental results consider five classifiers for the role of each of g and h (25 classifier combinations in all). The pseudo-code of the Extended ADR-Miner algorithm is shown in Algorithm 1. As shown in Algorithm 1, ADR-Miner takes two classification algorithms as inputs: g and h (lines 2 and 3). Algorithm g is used for candidate solution quality evaluation: it is used to build a classifier using the candidate reduced set, and then the predictive accuracy of the constructed classifier is evaluated (lines 10 and 11). Algorithm h builds the final classifier Mf inal using the best produced reduced set Rbsf (line 21). This scheme allows for one algorithm g to be used during that the training phase and possibly another algorithm h to be used for building the final model. This allows us to test pairings of classification algorithms, and note the effect of such pairings on the effectiveness of the final model. Adapting the ACO algorithm to perform data reduction involves a number of steps: 1) translating the problem into a search space that is traversable by the ants, also known as a construction graph; 2) defining the overall meta-heuristic that will be used to direct the ants as they search the problem space; 3) defining how an ant constructs a candidate solution (i.e., a reduced set) while traversing the construction graph, and 4) defining the mechanics of evaluating the quality of such solutions and updating the pheromone trails. At the core of the ACO algorithm is the construction graph, which consists of decision components that represent the search space of the current problem. An ant constructs a solution by selecting decision components from the construction graph. In our case, we are attempting to perform data reduction via instance selection. Starting with a set of instances I, we want to arrive at a subset R ⊆ I that produces the best possible predictive accuracy. Essentially, we have to decide which instances from I are to be included in R, and that translates into each instance having two decision components within the graph: dtrue whose i selection would imply the inclusion of the i-th instance in I, and dfi alse whose selection would imply the exclusion of the i-th instance from I. Selection between dtrue and dfi alse for the same i value of i is mutually exclusive, and an ant constructing a solution cannot include both in its selection. The decision components of the graph take the form of a two dimensional array, with a length of |I| and a depth of 2 (for the values of true and f alse). ADR-Miner begins by initializing the pheromones on all the decision components to equal values (line 6). This includes both the components for inclusion and exclusion for all instances in the dataset to be reduced (i.e., the current trainingset). It then enters a repeat − until loop (lines 7 to 20) that is terminated when either of the following criteria are reached: we exhaust max_iterations number of iterations, or the colony has converged on a solution and no visible improvement has been observed over conv_iterations number of iterations, where max_iterations and conv_iterations are external parameters. Within each iteration t of this outer loop, each anta in the colony constructs a candidate solution Ra (line 9). After a candidate solution is produced, a classification model Ma is constructed using the reduced set Ra and an input classification algorithm g (line 10). The quality of model Ma is evaluated (line 11), and if it is better than that achieved by other ants in the current iteration t, it supplants an iteration-best solution Rtbest (lines 12 to 14). After all the ants in the colony complete the construction of their solutions, the best ant 251
Instance Selection with ACO
Anwar, Salama and Abdelbar
in the iteration is allowed to update the pheromone trails based on Rtbest . This complies with the pheromone update strategy of the MAX -MIN Ant System [13], on which the ADR-Miner algorithm is based. The iteration-best solution Rtbest will supplant the best-so-far solution Rbsf if it is better in quality (lines 16 to 18). This process is repeated until the main loop exits. At this point, we use algorithm h to build the final classification model Mf inal using the best reduced set Rbest (line 21), and return Mf inal as the output of the ADR-Miner algorithm. Now, let us look at the solution construction process (Algorithm 2) in greater detail. The solution construction process is invoked in line 9 of Algorithm 1. Each anta constructs a solution by first starting with an empty structure Ta (which represents the ant trail) and incrementally appending decision components dvi from the construction graph. In turn, the ant will consider and dfi alse ) for each instance i – with i ranging from 1 to the two decision components (dtrue i |I| – and select one from amongst them probabilistically using the following formula: P (dvi ) =
τ [dvi ] · η[dvi ]
τ [dtrue ] · η[dtrue ] + τ [dfi alse ] · η[dfi alse ] i i
(1)
where τ represents the amount of pheromone, η represents the amount of heuristic information associated with decision component dvi , and v can either be true (inclusion) or false (exclusion). In the present work, the heuristic value for dtrue decision components is preset at 0.66, and for df alse is preset at 0.33, which gives a modest bias towards including instances. Decision components are selected in this fashion and appended to the ant’s set until all instances have been processed, at which point the contents of the set represent the solution constructed by the ant. In order to evaluate the model built at the end of the algorithm, the test set accuracy is used instead of the training set, where accuracy is computed as the ratio of the number of correctly classified instances to the total number of instances. When it comes to pheromone deposit, only the ant with the best solution Rtbest in the current iteration t is allowed to deposit pheromone on the trail connecting the decision components chosen by it. The trail Ttbest selected by the iteration-best ant will have its (decision components’) pheromone values amplified by a factor equal to the quality of solution attained: τ [dvi ] = τ [dvi ] + (τ [dvi ] × Qtbest ) ∀dvi ∈ Ttbest
(2)
To simulate pheromone evaporation, normalization is then applied on each pair of solution components associated with each connection c in the construction graph. This keeps the total pheromone amount on each pair τ [dtrue ] and τ [dfi alse ] equal to 1, as follows: i τ [dvi ] =
5
τ [dvi ]
τ [dtrue ] + τ [dfi alse ] i
∀i ∈ I
(3)
Experimental Methodology and Results
The experimental evaluation was performed with all pairings of five well-known classification algorithms: Support Vector Machines, Naive Bayes Classifier, Nearest Neighbor Lazy Classifier, C4.5 Decision Tree Induction and the Ripper (Rip) Classification Rule Induction algorithm. We used the WEKA [17] implementations of these algorithms, namely SMO; Naïve-Bayes (NB); 1-NN; J48 and JRip, using WEKA’s default parameter settings for each. The experiments were carried out using the stratified 10-times ten-fold cross validation procedure against 37 publicly available datasets from the well-known University of California at Irvine (UCI) dataset repository. Following [2], the parameters max_iterations, colony_size, and conv_iterations were set to 1000, 10, and 10, respectively. 252
Instance Selection with ACO
Anwar, Salama and Abdelbar
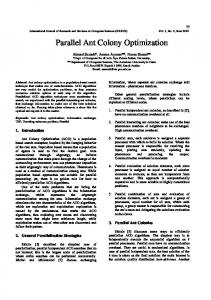
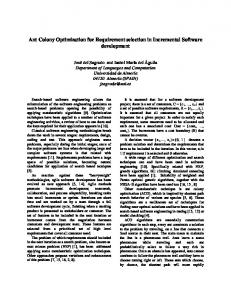
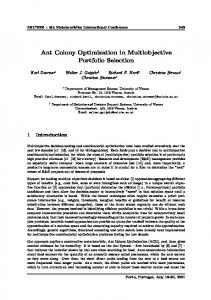
Table 1 reports the ADR-Miner test set predictive accuracy (%) result for each pairing of classification algorithms g and h (first line and the second line of the header row respectively) per dataset; for each algorithm g, the best accuracy is underlined, and the best accuracy in general for each dataset is shown in italics. Table 2 reports the average predictive accuracy rank of the 25 pairings of classification algorithms used with the ADR-Miner algorithm, as well as of the five base algorithms (without any data reduction)—-thus, 30 configurations are ranked in all. The average rank for a given entry (either ADR-Miner with a (g, h) classifier pair, or a base algorithm without data reduction) is obtained by first computing the rank of the entry on each dataset individually, with the best configuration being given a rank of 1 and the worst a rank of 30. The individual ranks are then averaged across all datasets to obtain the overall average rank. Note that the lower the rank, the better the algorithm. According to the ranking results, ADR-Miner with the SVM-SVM pairing obtained the best ranking, followed by SVM (without data reduction) in second place, ADR-Miner with 1NN-SVM in third place, C4.5-SVM in fourth place, and ADR-Miner with Rip-Rip in fifth place. We can observe from the results that using SVM to build the final model produces the best results. However, the user may prefer Rip or C4.5 to build the final model since they produce comprehensible classification models (i.e. rules and trees, respectively), in contrast to the “black box” classifier produced by an SVM. From the user perspective, the output of an SVM algorithm can hardly be interpreted by users, which is a disadvantage in many application domains [5]. Another observation is that, given classification algorithm h, ADR-Miner produces better results (with one or more classification algorithms g) via instance selection, compared to using the base classification algorithm h without any instance selection, with one exception. The exception is that the baseline C4.5 algorithm has a better ranking than all the ADR-Miner pairings using C4.5 as a final model builder. Table 3 reports the average size reduction percentage (i.e. how much of the training set was removed ) for each algorithm g. We observe that Naïve-Bayes produced the best average size reduction (23% reduction) when used in the first phase (as g) to evaluate the candidate solutions’ quality, followed by SVM (22% reduction), C4.5 (21.1% reduction), Rip (20.8% reduction), and 1-NN (19% reduction) respectively. Note that the reduction size is independent of algorithm h used to build the final model, since algorithm g is responsible for producing the best reduced instance set. Tables 4a and 4b provide a summarized view of which algorithm produced the best results when paired with another during the two phases of the ADR-Miner algorithm. Note that g refers to the classification algorithm used during the optimization phase to evaluate the candidate reduced sets, while h refers to the classification algorithm used to build the final model using the best produced reduced set. We note, from Table 4a, that there are three choices of g for which the best h is SVM; these are 1-NN, C4.5, and SVM itself. There are two choices for g for which the best h is Rip; these are Naïve-Bayes (NB) and Rip itself. From Table 4b, we observe that there are two choices of h for which the best g is SVM; these are SVM and 1-NN. Similarly, there are two choices of h for which the best g is NB; these are NB and C4.5. Finally, when h is chosen as Rip, the best choice of g is also Rip.
6
Concluding Remarks
In this paper, we have extended ADR-Miner, an algorithm which utilizes ant colony optimization to perform data reduction in order to improve the predictive accuracy of classification models. Our extension allows the use of two classifiers, one during the optimization phase of ADR-Miner to evaluate the candidate reduced sets, and the other to build the final classifier using the best 253
Instance Selection with ACO
Anwar, Salama and Abdelbar
reduced set, as opposed to only one algorithm for both phases in the original algorithm. From the results, we can observe that using a pair of two different classification algorithms, one for each phase of ADR-Miner, improved the predictive accuracy results in several cases. In addition, the user may want to balance between the size reduction and the predictive effectiveness of the produced model by selecting the most appropriate algorithm’s pairing, and may also take into consideration the interpretability of classification models produced by the algorithm used to produce the final model in the second phase. Potential future work includes approaching the problem as a multi-objective optimization problem, producing a set of solutions varying in predictive accuracy and reduction size.
References [1] D.W. Aha, D. Kibler, and M.K. Albert. Instance-based learning algorithms. Machine Learning, 6(1):37–66, 1991. [2] I.M. Anwar, K.M. Salama, and A.M. Abdelbar. ADR-Miner: An ant-based data reduction algorithm for classification. In Proceedings IEEE Congress on Evolutionary Computation (CEC’15), 2015, to appear. [3] H. Brighton and C Mellish. Advances in instance selection for instance-based learning algorithms. Data Mining and Knowledge Discovery, 6:153–172, 2002. [4] M. Dorigo and T. Stützle. Ant Colony Optimization. MIT Press, Cambridge, MA, 2004. [5] A.A. Freitas. Comprehensible classification models: A position paper. ACM SIGKDD Explorations, 15(1):1–10, 2013. [6] T. Liao, K. Socha, M. Montes de Oca, T. Stuetzle, and M. Dorigo. Ant colony optimization for mixed-variable optimization problems. IEEE Transactions on Evolutionary Computation, 18(4):503–518, 2014. [7] F.E. Otero, A.A. Freitas, and C.G Johnson. A new sequential covering strategy for inducing classification rules with ant colony algorithms. IEEE Transactions on Evolutionary Computation, 17(1):64–74, 2013. [8] K.M. Salama and A.M. Abdelbar. A novel ant colony algorithm for building neural network topologies. In Proceedings ANTS’14, pages 1–12. Springer, 2014. [9] K.M. Salama, A.M. Abdelbar, and A.A. Freitas. Multiple pheromone types and other extensions to the Ant-Miner classification rule discovery algorithm. Swarm Intelligence, 5(3-4):149–182, 2011. [10] K.M. Salama and A.A. Freitas. Learning Bayesian network classifiers using ant colony optimization. Swarm Intelligence, 7(2-3):229–254, 2013. [11] K.M. Salama and A.A. Freitas. Ant colony algorithms for constructing Bayesian multi-net classifiers. Intelligent Data Analysis, 19(2):233–257, 2015. [12] K.M. Salama and F.E.B. Otero. Learning multi-tree classification models with ant colony optimization. In Proceedings ECTA’14. Springer, 2014. [13] T. Stützle and H. Hoos. MAX-MIN ant system. Future Generation Computer Systems, 16:889–914, 2000. [14] I. Tomek. An experiment with the edited nearest-neighbor rule. IEEE Transactions on Systems, Man, and Cybernetics, 6(6):448–452, 1976. [15] D. Wilson. Asymptotic properties of nearest neighbor rules using edited data. IEEE Transactions on Systems, Man, and Cybernetics, 2(3):408–421, 1972. [16] D. Wilson and T.R. Martinez. Reduction techniques for instance-based learning algorithms. Machine Learning, 38(3):257–286, 2000. [17] I.H. Witten, E. Frank, and M.A. Hall. Data Mining: Practical Machine Learning Tools and Techniques. Morgan Kaufmann, San Francisco, 2010.
254
Dataset
1-NN 1-NN
NB
Rip
NB C4.5
SVM
1-NN
NB
Rip
Rip C4.5
SVM
1-NN
NB
Rip
C4.5 C4.5
SVM
1-NN
NB
Rip
SVM C4.5
SVM
1-NN
NB
Rip
C4.5
SVM
255
Anwar, Salama and Abdelbar
annealing 94.41 77.73 93.93 91.90 85.74 94.18 88.71 93.83 91.43 84.38 93.49 79.20 94.97 90.65 85.97 93.95 76.69 94.16 94.98 85.98 93.95 79.56 94.06 92.02 89.86 audiology 80.83 85.00 78.33 78.33 88.33 77.50 85.00 79.17 83.33 90.83 80.83 84.17 84.17 82.50 90.00 77.50 79.17 75.83 85.83 89.17 80.83 82.50 80.83 84.17 90.83 automobile 73.64 57.52 71.71 80.57 71.21 69.26 61.93 71.24 77.98 68.24 72.62 58.05 76.12 77.05 66.69 72.19 56.05 72.76 84.33 65.31 72.71 57.57 71.79 76.14 72.64 breast-p 69.16 67.13 73.68 73.21 76.29 67.71 68.68 69.61 69.13 76.29 67.16 66.13 69.21 72.16 76.29 67.16 64.63 73.24 61.00 76.29 67.68 66.13 71.24 64.50 74.76 breast-tissue 67.18 66.18 58.82 62.27 58.73 67.27 65.45 62.18 58.55 57.73 68.27 67.27 63.45 62.36 58.82 68.09 64.36 55.82 66.36 55.82 67.00 64.36 59.45 62.18 60.64 breast-w 95.79 93.33 93.15 95.79 97.54 95.79 93.86 92.62 92.44 97.37 94.91 93.51 94.20 91.91 97.02 96.14 93.33 93.32 93.67 97.54 95.26 92.80 93.32 94.03 97.72 car 63.33 86.26 83.51 92.05 92.81 62.98 87.54 85.20 91.81 93.10 63.27 85.38 89.59 91.11 92.63 63.22 86.43 84.97 92.87 93.33 63.27 86.61 83.92 91.75 93.39 chess 86.04 87.86 99.06 99.21 95.69 85.38 88.96 99.09 99.18 95.53 85.19 87.67 99.18 99.37 95.22 85.85 87.99 98.84 99.43 95.22 85.72 87.96 99.21 99.21 96.70 credit-a 80.58 77.10 86.09 85.51 84.78 81.30 77.68 83.77 85.51 84.78 80.72 76.67 85.65 85.51 84.64 81.16 77.83 85.22 85.07 85.51 78.84 76.96 86.96 86.09 84.78 credit-g 69.00 74.90 73.60 71.60 74.60 70.60 74.80 73.80 71.90 73.20 69.50 74.50 70.40 70.60 73.50 69.90 75.10 70.00 70.70 73.90 68.70 73.70 71.10 70.60 74.10 cylinder 68.19 66.32 67.10 73.79 72.11 67.26 70.60 67.82 73.79 74.34 68.94 67.64 73.25 71.90 72.48 68.75 66.51 69.87 71.37 72.48 67.82 69.30 65.60 71.55 73.96 dermatology 94.26 97.81 87.95 94.26 95.88 93.45 97.26 88.57 92.91 96.45 93.45 98.09 91.30 93.97 97.55 94.26 98.09 88.27 93.99 97.27 93.99 98.36 87.71 93.98 97.27 83.36 83.06 80.44 85.78 79.80 81.60 81.86 79.79 84.27 82.16 81.89 82.75 82.79 85.18 80.98 82.78 84.21 82.18 85.80 77.11 78.96 86.04 ecoli 80.72 84.87 81.86 glass 68.92 48.57 67.00 70.79 56.58 68.86 59.37 65.14 70.34 51.75 66.04 47.95 70.34 68.41 56.01 69.33 48.94 65.55 68.82 55.15 66.06 47.77 61.91 72.18 62.27 63.08 78.46 62.31 76.92 82.31 65.38 77.69 58.46 69.23 74.62 66.92 77.69 62.31 71.54 75.38 62.31 77.69 60.00 73.08 81.54 67.69 74.62 hay 63.08 68.46 79.23 heart-c 53.83 56.77 55.48 53.83 55.77 52.81 56.44 54.47 57.08 55.76 52.84 56.74 51.52 51.51 56.78 52.52 56.40 54.47 51.44 56.75 51.86 56.76 54.48 50.85 56.75 66.76 48.57 66.04 62.31 66.42 67.10 46.51 63.30 64.74 66.13 65.41 51.42 65.37 64.07 66.67 68.12 48.53 65.69 65.78 67.07 69.12 heart-h 62.43 66.05 63.01 67.06 hepatitis 82.46 83.17 78.75 79.33 83.83 81.88 86.29 80.67 79.38 82.54 80.58 82.58 85.79 81.96 84.46 83.17 83.21 81.25 80.71 83.17 84.50 83.21 82.58 79.38 83.21 horse 78.46 78.53 86.44 84.15 80.99 79.34 79.96 84.11 84.42 81.78 79.04 79.41 85.03 84.74 83.30 79.69 78.54 83.30 83.60 80.73 81.67 79.14 84.48 84.17 79.56 iris 95.33 94.67 94.00 92.67 96.00 96.00 96.00 90.00 91.33 96.67 95.33 96.00 94.67 95.33 94.67 94.67 96.00 92.00 94.00 96.00 96.00 96.00 92.67 93.33 96.00 liver 62.62 54.74 69.58 65.50 58.28 61.72 64.02 67.82 64.04 58.56 61.13 54.46 68.08 63.99 57.70 61.15 54.71 65.45 64.88 57.98 61.72 54.77 61.43 64.71 58.56 lymphography 83.76 82.48 79.76 77.10 83.10 77.81 84.48 75.86 77.14 79.81 79.05 82.48 78.43 79.86 85.19 79.10 81.14 79.14 77.90 85.86 79.14 81.90 73.05 70.33 81.19 monks 57.09 61.09 57.09 58.73 62.55 57.64 63.45 62.18 58.91 63.64 56.73 61.27 60.00 59.64 63.45 57.45 61.27 60.18 54.55 63.64 57.64 58.91 60.73 58.73 64.00 mushrooms 100.00 95.38 99.96 100.00 100.00 100.00 96.02 99.96 100.00 100.00 100.00 95.24 100.00 100.00 100.00 100.00 95.29 99.96 100.00 100.00 100.00 95.52 99.98 100.00 100.00 nursery 42.91 90.40 96.45 96.57 93.08 43.28 91.00 96.40 96.51 93.01 98.50 94.40 98.50 97.30 97.30 43.13 90.34 96.41 96.78 93.05 43.36 90.44 96.58 96.36 93.33 parkinsons 94.89 71.68 82.11 81.89 85.08 92.34 74.29 84.61 81.00 84.61 93.39 71.18 85.61 83.11 87.18 95.42 71.18 86.11 86.16 86.13 95.34 70.11 87.16 84.08 87.68 pop 70.00 68.75 73.75 75.00 70.00 71.25 68.75 75.00 75.00 71.25 71.25 68.75 72.50 72.50 72.50 68.75 72.50 70.00 66.25 70.00 70.00 71.25 73.75 72.50 70.00 s-heart 74.07 84.44 77.78 77.04 84.44 74.07 83.70 77.04 77.78 83.33 75.56 84.07 78.52 75.19 84.81 74.81 83.70 77.78 76.30 85.19 74.81 84.44 79.26 78.89 82.59 soybean 90.00 88.28 83.79 83.79 90.00 86.21 88.62 81.38 85.86 88.62 86.55 87.59 83.79 83.10 89.31 88.62 88.62 84.14 84.48 90.00 86.90 89.31 83.79 83.10 88.62 91.60 87.03 93.96 96.69 93.01 93.44 87.01 95.78 96.71 90.69 93.48 88.42 94.87 97.64 92.10 92.14 88.44 95.78 97.16 92.06 91.15 88.87 thyroid 93.96 96.71 92.53 transfusion 62.22 70.26 73.99 73.91 71.74 62.74 71.49 72.89 72.29 71.74 63.53 70.05 72.82 72.41 71.94 62.08 69.48 73.79 71.82 71.74 64.55 69.20 73.65 72.04 72.31 ttt 67.37 69.16 97.37 83.26 98.42 67.58 72.63 97.79 84.95 98.42 67.58 69.89 96.95 82.74 98.42 67.37 70.74 97.37 85.79 98.42 67.89 71.37 98.21 82.32 98.42 vehicle 67.73 45.04 70.58 69.39 74.94 69.26 50.95 67.51 72.11 74.23 68.08 44.69 71.15 71.99 73.99 70.09 45.04 69.86 72.35 73.88 67.72 45.14 69.98 71.87 73.88 vertebral-2c 80.32 78.06 80.65 81.94 73.55 77.74 77.74 80.00 81.29 71.29 77.10 78.39 80.65 80.32 78.39 76.77 78.71 78.71 82.26 76.77 80.97 78.39 82.58 80.97 83.55 vertebral-3c 79.68 81.94 79.68 81.29 80.65 80.32 82.58 80.32 79.35 76.45 78.39 82.90 79.68 80.32 75.81 78.71 82.26 78.71 80.65 74.19 80.32 82.58 77.42 80.32 83.23 voting 88.99 85.94 92.89 94.48 94.26 88.64 85.98 93.68 93.68 93.91 89.41 85.98 95.55 94.25 93.63 88.03 85.63 93.96 94.88 93.82 89.06 85.94 92.89 93.77 95.46 zoo 98.75 93.75 97.50 98.75 98.75 98.75 96.25 91.25 98.75 96.25 98.75 96.25 93.75 97.50 96.25 98.75 93.75 85.00 96.25 98.75 98.75 93.75 91.25 97.50 98.75
Instance Selection with ACO
Table 1: Pairing-based test set predictive accuracy (%) results for ADR-Miner.
Instance Selection with ACO
Anwar, Salama and Abdelbar
Table 2: Overall average test set predictive accuracy ranking of ADR-Miner with different (g, h) classifier pairings, and of the base algorithms (without data reduction). Entry
Rank Entry
Rank Entry
Rank
SVM-SVM SVM 1-NN-SVM C4.5-SVM Rip-Rip C4.5 Rip-SVM 1-NN-C4.5 NB-SVM Rip
9.58 10.66 12.16 12.19 12.36 12.47 12.96 13.15 13.91 14.04
14.38 14.38 14.51 14.89 15.66 15.93 16.24 17.31 17.59 17.66
17.69 17.76 18.05 18.34 18.38 18.51 18.73 18.84 19.23 19.42
NB-C4.5 C4.5-C4.5 Rip-C4.5 NB-NB SVM-C4.5 1-NN-Rip SVM-Rip NB-Rip C4.5-Rip SVM-NB
SVM-1-NN 1-NN-1-NN Rip-NB C4.5-NB NB 1-NN-NB C4.5-1-NN 1-NN NB-1-NN Rip-1-NN
Table 3: Size reduction (%) results. Dataset
NB
Rip
C4.5
SVM
annealing 19.93 20.57 audiology 14.73 16.60 automobile 14.53 18.54 breast-p 15.88 24.47 breast-tissue 15.00 19.54 breast-w 22.96 26.66 car 16.49 20.20 chess 18.58 20.80 credit-a 16.36 22.35 credit-g 16.20 19.06 cylinder 17.35 18.40 dermatology 22.89 27.23 ecoli 16.90 19.81 glass 13.97 19.02 hay 22.81 26.78 heart-c 12.73 17.42 heart-h 16.98 18.77 hepatitis 18.13 23.60 horse 16.89 20.29 iris 29.98 25.90 liver-disorders 14.75 20.64 lymphography 16.81 22.89 monks 16.48 32.98 mushrooms 33.50 33.37 nursery 17.28 19.87 parkinsons 28.27 27.41 pop 21.10 27.29 s-heart 16.21 21.36 soybean 20.18 20.57 thyroid 28.37 24.45 transfusion 16.25 25.38 ttt 16.20 34.17 vehicle 15.85 17.21 vertebral-2c 16.74 18.17 vertebral-3c 15.70 21.18 voting 20.99 24.33 zoo 31.49 30.25
21.13 15.16 17.94 17.12 17.75 21.19 18.84 19.58 18.76 19.98 19.62 21.07 18.55 16.37 30.01 18.34 18.65 21.15 19.66 30.72 18.50 19.97 17.59 33.64 23.50 20.74 32.74 19.30 16.75 19.69 21.02 21.08 17.89 17.71 20.14 25.32 21.78
21.79 18.88 18.05 18.58 16.59 22.30 19.01 25.88 20.08 18.02 17.62 23.86 18.35 16.16 26.66 16.21 16.72 16.92 29.18 30.51 17.68 18.02 17.93 33.09 19.32 21.25 31.55 18.35 18.57 23.56 20.59 19.19 17.98 20.39 17.89 29.08 25.47
19.18 16.28 18.10 20.60 23.98 28.63 19.04 19.99 20.79 19.31 18.07 26.32 21.33 17.58 23.52 17.45 20.20 22.44 21.22 32.94 17.55 25.15 19.04 19.46 19.67 26.10 21.89 22.06 21.88 31.21 21.88 18.92 17.00 23.30 20.18 28.42 33.51
20.78
21.12
22.01
Average
1-NN
19.07 22.91
Algorithm 1 ADR-Miner Extended. 1: 2: 3: 4: 5: 6: 7: 8: 9: 10: 11:
begin g ← classification_algorithm_1 h ← classification_algorithm_2 I ← training_set; T ← testing_set; InitializeP heromones(); repeat for a ← 1 to colony_size do Ra ← anta .CreateSolution(I); Ma ← ConstructM odel(g, Ra ); Qa ← EvaluateM odelQuality(Ma , I);
12: if Qa > Qtbest then 13: Qtbest ← Qa ; 14: Rtbest ← Ra ; 15: U pdateP heromones(Rtbest ); 16: if Qtbest > Qbsf then 17: Qbsf ← Qbest ; 18: Rbsf ← Rtbest ; 19: t ← t + 1; 20: until t = max_iterations Convergence(conv_iterations) 21: Mf inal ← ConstructM odel(h, Rbsf ) 22: return Mf inal ; 23: end
Algorithm 2 Solution Construction. 1: 2: 3: 4: 5: 6: 7: 8: 9: 10:
begin Ta ← φ; /* ant trail */ Ra ← φ; /* reduced dataset */ for i ← 1 to |I| do dvi ← SelectDecisionComponent(); Ta ← Ta ∪ dvi T rue then if dx i = di Ra ← Ra ∪ Ii return Ra end
Table 4: Best performing combinations of classifiers. g 1-NN NB Rip C4.5 SVM
Best h SVM C4.5 Rip SVM SVM
(a) Best for g
256
or
h 1-NN NB Rip C4.5 SVM
Best g SVM NB Rip NB SVM
(b) Best for h