INSTANTANEOUS NONLINEAR TEAGER ENERGY OPERATOR FOR ROBUST VOICED – UNVOICED SPEECH CLASSIFICATION Nithya Sundaram, Brett Y. Smolenski, and Robert E. Yantorno Speech Processing Lab, Temple University, 12th and Norris Street, Philadelphia, PA – 19122 Email:
[email protected],
[email protected],
[email protected] http://www.temple.edu/speech_lab ABSTRACT The Teager Energy Operator (TEO) is used for computing the energy of the signal in a nonlinear manner which provides an advantage over conventional Fourier analysis methods in capturing the characteristics of nonlinear systems. The nonlinear operator measures the energy in the system that generated the signal rather than the energy of the signal itself. This idea was exploited in building a robust voiced/unvoiced speech classifier. The TEO classifier was tested for clean speech as well as speech with two different types of added noise. The TEO based voiced/unvoiced classifier resulted in 89% correct detection and 26% false detection for voiced speech and 71% correct detection and 10% false detection for unvoiced speech. These results are the average of clean speech and speech with added noise. Further, the unvoiced speech and silence (noise) is differentiated with the help of a model order estimator Minimum Description Length where the idea is to exploit the concept of obtaining different model orders for the two groups i.e., unvoiced speech and silence (noise).
1. INTRODUCTION It is known that the speech system has nonlinearities, and due to the inability of linear speech processing tools to capture the characteristics of these systems, a nonlinear analysis approach is required. The fine structure of speech, within a glottal cycle, is often not captured by conventional linear Fourier analysis methods. This limitation is the cause for the development of the nonlinear Teager Energy Operator [1] [2]. The nonlinear operator measures the energy in the system that generated the signal rather than the energy of the signal itself. In this nonlinear method, the energy required by a system to generate a signal at high frequencies is
expected to be much higher than the energy required by the system to generate a signal at low frequencies. Since we know that voiced speech and unvoiced speech have energy in different frequency ranges, we can expect two different ranges for the energy operator and hence good classification of voiced and unvoiced speech is expected. 2. BACKGROUND 2.1. Teager Energy Operator Extensive research by Teager resulted in a nonlinear approach to computing the energy of a signal [1]. A simple nonlinear energy-tracking operator for speech signal is given by the following equation [2].
T [ x(t )] =
d x(t ) dt
2
− x(t )
d2 x(t ) dt 2
(1)
This energy-tracking operator can be understood when considering sinusoidal oscillations that occur with a simple harmonic oscillator. In this case, the total energy in the system, i.e., the sum of the potential and kinetic energy, is proportional to the product of frequency and amplitude squared which is nothing but the true energy required to generate the signal [3]. TEO is widely used for various applications in speech. Hypernasal speech is indicative of an underlying problem that results from a dysfunctional nervous system. A noninvasive system is proposed to classify speech as normal or hypernasal based on the nonlinear TEO [4]. A framework for extracting knowledge concerning environmental noise from an input audio sequence was designed to detect, classify and track acoustic environmental conditions using TEO [5].
2.2. Merits of TEO An important property of TEO, in discrete-time, is that it is nearly instantaneous. This is because only three samples are required for the energy computation at each time instant. This excellent time resolution provides us with ability to capture the energy fluctuations (the squared product of amplitude and frequency). The resulting nonlinear dynamical system is capable of robust AM-FM estimation in noisy environment. An important property of the energy separation algorithm is that the “short” window required by the algorithm implies excellent temporal resolution and thus is useful in instantaneously adapting during speech transitions.
voiced speech and unvoiced speech for 12 male files and 13 female files was generated and is shown in Figure 2. Notice from top panel of Figure 2, a threshold of “1” can provide for good classification of voiced and unvoiced speech. Following the experiments with clean speech, experiments with white noise and pink noise were performed at SNR of 15 dB. Another histogram was generated to determine the threshold of 1.5 for voiced and unvoiced speech classification in presence of 15dB pink noise and is shown in bottom panel of Figure 2. It is to be noted that a threshold was chosen based on the measure values which was found to be the best for both clean speech and speech with added noise.
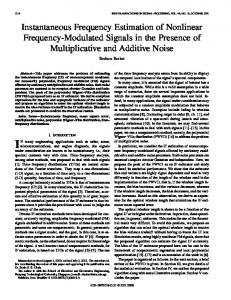
The instantaneous frequency of an arbitrary AM-FM signal was separated based on a discrete time energy separation algorithm and is the feature that is used to classify voiced and unvoiced speech [3] [6] [7]. We expect different FM component levels for the high frequency signals (unvoiced speech, noise) versus the low frequency signals (voiced speech). The FM component was smoothened using a median filter of order 80 with an overlap of 1 point. Figure 1 shows a portion of a speech segment, which displays the TEO and FM components with and without median filtering.
2
5
0.12 0.1 0.08 0.06 0.04 0.02 0
0
0.5
1
1.5
2
2.5
3
Voiced Univoiced Distance Measure
Voiced, Unvoiced Probability Study - 21-Oct-2003 Voiced Probability Unvoiced Probability
0.12
5
0x 10 1000
2000
3000
4000
5000
6000
7000
8000
9000 10000
Teager Energy Operator
1 0
0.14
0.14
0 -1000
Voiced Unvoiced
0.16
Voiced & Unvoiced Speech
1000
Voiced Univoiced Probability Study - 21-Oct-2003
0.16
Probability of Occurance of Measure
3. EXPERIMENTS
Probability of Occurance of Measure
0.18
0.1
0.08
0
1000
2000
3000
4000
5000
6000
7000
8000
9000 10000
FM Component
0.06 0.04
0 4
0
1000
2000
3000
5000
6000
7000
8000
9000 10000
Median Filtered FM Component
2 0
4000
0
1000
2000
3000
4000
5000
6000
7000
8000
9000 10000
Figure 1: Voiced, Unvoiced and Silence speech with SNR 20dB (top panel), Teager Energy Operator (second panel), FM component (third panel), and median filtered FM component (bottom panel) It is observed from Figure 1 that the FM components for unvoiced speech have higher values when compared to the FM components of voiced speech. A histogram was generated to determine the threshold for voiced and unvoiced speech classification. The histogram for the
0.02 0
0
0.5
1
1.5
2
2.5
TEO FM Components for Voiced Unvoiced
3
Figure 2: FM component for voiced speech (black bars), FM component for unvoiced speech (gray bars) with 1.10 minutes of voiced speech and 25 sec of unvoiced speech. Top panel – histogram for clean speech, bottom panel – histogram for speech with added pink noise at 15dB SNR
An algorithm was developed based on median filtered FM components extracted from Teager energy measure values and a decision threshold was decided based on the above histogram. The frame of speech is declared as “voiced” if the median filtered FM component has a value less than 1 and “unvoiced” otherwise. The percentage correct detection and percentage false detection for voiced and unvoiced data were calculated. Speech comprising of 12 utterances of male speakers and 13 utterances of female speakers was tested using the TEO algorithm and the rules mentioned above. The percent correct detection and false detection using the entire male and female database are averaged and displayed as bar charts in Figure 3. Figure 3 (top panel) shows the results of voiced speech and Figure 3 (bottom panel) shows the results of unvoiced speech for white and pink noise at 15dB SNR. In both cases, we can observe good classification rate and so we can say that the approach is robust even at reasonably high noise levels.
Experiments using FM components of TEO features give good results with voiced /unvoiced classification. However the robustness of algorithm needs to be tested in presence of very high SNR levels like 5dB SNR. An experiment on 15 female speaker files is shown in Figure 4. The portions that were detected “voiced” is shown by a value “1” and portions that were detected “unvoiced” is shown by value “0.5”. Current research has shown that experiments using nonlinear features results in good voiced speech classification. The challenging next step in speech classification is to design a robust algorithm to differentiate unvoiced speech from background. Voiced/Unvoiced Decision from TEO
1.2 1 0.8 0.6
Amplitude
4. RESULTS
0.4 0.2 0 -0.2
Voiced Speech Detection
-0.4
% Detection
1 - Voiced 0.5 - Unvoiced
-0.6
100
0.2
75
0.4
0.6
0.8
1
1.2
1.4
1.6
1.8
Time
2
2.2 4
x 10
Figure 4: Detection Results Using TEO, Voiced Speech (black), Unvoiced Speech (gray), black rectangles: 1 = voiced speech detected, 0.5 – unvoiced speech detected
50 25 0
Clean Speech
15dB Pink Noise
Correct Detection
15dB White Noise
False Detection
Unvoiced Speech Detection
% Detection
100 75 50
5. UNVOICED - SILENCE CLASSIFICATION The order of the spectral shaping filter has to be optimum in order to model the vocal tract. In general, there should be a sufficient number of poles to represent all the formants and additional 2-4 poles to approximate possible zeros in the spectrum, as well as, general spectral shaping [7]. A special case of the prediction error is called the Minimum Description Length, and it was investigated. 5.1. Minimum Description length (MDL)
25 0
Cle a n S pe e c h
15 dB P ink Noise
Correct Detection
15 dB White Noise
False Detection
Figure 3: Voiced Speech Detection (top panel), Unvoiced Speech Detection (bottom panel), correct detection (black bars), and false detection (gray bars)
The unvoiced speech and silence could be differentiated with the help of a model order predictor MDL. The idea is to exploit the concept of obtaining different model orders for the two groups, i.e., unvoiced speech and silence (noise). The concept of MDL is such that for every frame of speech, the calculation of order is iteratively performed until the order at which the minimum prediction error is obtained. The MDL is given by:
MDL( p) = N log(σ 2 v ) + p log(N )
(2)
Where σ v is the estimated variance of the linear predicted error, i.e., prediction error power, MDL( p ) is 2
the minimum error at model order p and N is the frame size. The MDL for an utterance comprising of only unvoiced speech and silence is plotted in Figure 5. Unvoiced Speech & Noise - MDL Plot
MDL
6
of finding distances between classes is being studied for achieving segmental separation and is a preprocessing stage to increase the classification accuracy. ACKNOWLEDGEMENTS The Air Force Research Laboratory, Air Force Material Command, and USAF sponsored this effort, under agreement number F30602-02-2-0501. The U.S. Government is authorized to reproduce and distribute reprints for Government purposes notwithstanding any copyright annotation thereon.
4
DISCLAIMER
2
The views and conclusions contained herein are those of the authors and should not be interpreted as necessarily representing the official policies or endorsements, either expressed or implied, of Air Force Research Laboratory, or the U.S. Government.
0 -2
-4
7. REFERENCES
-6 0
1000
2000
3000
4000
5000
Sample Number
Figure 5: MDL and Speech, black rectangles – Model orders at which the MDL is a minimum. The initial experiments with clean speech using MDL resulted in 76% correct detection and 19.9% false detection for silence (noise). 6. CONCLUSIONS In this paper, we have presented a novel and robust method of performing voiced/unvoiced speech classification using an instantaneous nonlinear teager energy operator. Further, a model order estimator was tested on clean speech to discriminate unvoiced speech and background. The real challenge is to be able to differentiate unvoiced speech from background when the noise level is high, e.g., for 5dB SNR. A Linear Predictive Model may work well by producing two different vocal tract models for the two groups, i.e., unvoiced speech and silence (noise). Silence (noise) does not have any vocal tract information to be modeled and thus could be differentiated from unvoiced speech. 7. FURTHER RESEARCH A relatively common problem in areas of speech processing is the determination of the beginnings and endings of voiced segments. Facilitation of simple energy thresholds, coupled with zero crossings rate, for this purpose is satisfactory only at low noise levels. The idea
[1] J.F. Kaiser, “On a Simple Algorithm to Calculate the ‘Energy’ of a Signal,” Proceedings of IEEE International Conference on Acoustics, Speech, and Signal Processing, Albuquerque, NM, pp. 381-384, Apr. 1990. [2] J.F. Kaiser, “On Teager’s Energy Algorithm and its Generalization to Continuous Signals,” Proceedings of 4th IEEE Digital Signal Processing Workshop, Mohonk, NY, Sept. 1990. [3] P. Margos, J.F. Kaiser, and T.F. Quatieri, “Energy Separation in Signal Modulations with Applications to Speech Analysis,” IEEE Transaction on Signal Processing, vol. 41, no.10, pp. 3024-3051, Oct. 1993. [4] D. Cairns, J.H.L, Hansen, and J.E, Riski, “Detection of Hypernasal Speech Using a Nonlinear Operator,” Proceedings of the 16th Annual International Conference of the IEEE, vol. 1, pp. 253-254, Nov. 1994. [5] T.F, Quatieri, C.R., Jankowski, D.A, Reynolds, “Energy onset times for speaker identification,” Signal Processing Letters, IEEE, vol.1, pp-160-162, Nov.1994. [6] P. Margos, T.F. Quatieri, and J.F. Kaiser, “Speech Nonlinearities, Modulations, and Energy Operators,” Proceedings of IEEE International Conference on Acoustics, Speech, and Signal Processing, Canada, pp. 421-424, May 1991. [7] B.S. Atal, and S.L. Hanauer, “Speech Analysis and Synthesis by Linear Prediction of the Speech Wave,” Journal of Acoustical Society of America vol. 50, pp. 637-655, 1971.