crawler computer is based on PC/104 modules in connection with a standard industrial field bus system (Interbus) for data acquisition and control. The software used in the sand mining system consists of the process visualisation software in ...
Instrumentation and Control System of a Sand Mining System for Shallow Water E. Schulte, H. Grebe, R. Handschuh, J. Panthel, B. Wenzlawski, W. Schwarz Institut für Konstruktions- und Fördertechnik, Fachbereich 11, Universität Siegen, Paul Bonatz Str. 9 – 11, 57068 Siegen, Germany, (http://www.uni-siegen.de)
M. A. Atmanand, C. R. Deepak, R. Jeyamani, M. A. Shajahan, M. Ravindran National Institute of Ocean Technology, NIOT Campus, Chennai 601 302 (Madras), India, (http://www.niot.ernet.in)
ABSTRACT
THE SAND MINING SYSTEM
The functions of the crawler for mining and driving are all remotely controlled from the control computers on the ship. Various sensors allow comprehensive monitoring of the performance of the crawler. The crawler computer is based on PC/104 modules in connection with a standard industrial field bus system (Interbus) for data acquisition and control. The software used in the sand mining system consists of the process visualisation software in the control room, the control software for development and implementation of the main control program, and the operating systems of the crawler computer and the control computers.
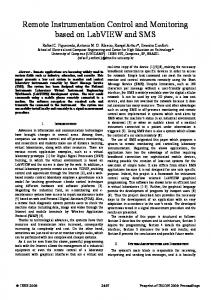
In order to illustrate the system functions and their implications regarding the instrumentation and control system, the sand mining system is briefly outlined in this paragraph. The sand mining system consists of the crawler, the flexible riser system and the ship. The crawler is connected to the ship by the flexible riser system, which consists of a steel armoured cable, a slurry hose and buoyancy packages. The flexible riser system has an S-shaped form in order to minimise the drag forces being applied to the crawler. The steel armoured cable carries the weight and transmits electrical power to the crawler. Mechanically the cable is connected to the crawler by a cardanic joint which allows free angular movement between crawler and cable and thus avoids bending of the cable. Furthermore the communication between crawler computer and ship computers is realised with fibre optic lines, that are also integrated into the cable. Figure 1 shows the crawler.
Key words: Underwater Control, Sensors, Instrumentation, Process Visualisation, Programmable Logic Controller
INTRODUCTION In the beginning of 1998, the “Institut für Konstruktion Siegen”, Germany (IKS) and the National Institute of Ocean Technology, India (NIOT) entered into a joint collaborative programme for the development of technology in the field of deep-sea mining. The programme is divided into three phases. During the first phase of the project, the development, realisation and demonstration of a system for sand mining from water depths up to 500 meters was carried out. For that, a crawler with rubber tracks, which was developed, built and tested at IKS (Schwarz et al., 1992; Rehorn, 1994), was equipped with a manipulator, a cutting device, a flexible riser system with pump and a suitably developed instrumentation and control system. The hydraulic system of the crawler was adapted according to the requirements of the first project phase. The first project phase has been completed successfully in the end of the year 2000. The purpose of this paper is to give an idea of the functions and components of the control system of the sand mining system including detailed technical information. The intention of the authors is to form a basis for discussion with other experts working in the field of sub sea instrumentation and control.
OMS-01-MT-15
Figure 1:
Launching of crawler for driving trials in September 2000 off Tuticorin coast, India
Page 1 of 7
During sand mining, a rotating cutting device, which is mounted at the tip of a manipulator is brought to the sea floor and is loosening the sandy soil. Trough a suction opening in the cutter, a positive displacement slurry pump, mounted on the crawler, takes in the slurry and pumps it to the ship through the flexible hose. The volume flow generated by the piston pump can be adjusted continuously from 0 to 45 m3/h. The manipulator can slew and move up and down to reach a sand volume of approximately 2 m3 per crawler position. The drive force is generated by two hydraulic motors, which are located in the front drums of both crawler track belts. The motors for the slurry pump and the hydraulic system operate at a voltage of 3000 V AC. The actuators of the system are either switched electrically or they are controlled by hydraulic valves (on/off, proportional). Various sensors allow monitoring of the system parameters necessary for launching and retrieval, mining and driving of the crawler. The gross energy consumption of the crawler during mining was approximately 50 to 60 kW.
THE CONTROL SYSTEM FUNCTIONS OF CONTROL SYSTEM The control system is the overall system that combines and sets into operation the functions of the components of the sand mining system. It has to transmit and to save control commands and measurement data. The main functions of the sand mining system are mining, driving, launching and retrieval.
SENSORS AND ACTUATORS In the following the term sensor is used for sensors, transducers and entire measurement systems (e.g. acoustic velocity measurement system). The actuators carry out the commands given by the operators. The sensors and actuators can be assigned to the main functions. The technical information given is taken from the literature of the concerned manufacturers and is not cited explicitly. For the determination of the position of the cutter with respect to the ground, linear variable differential transformers (LVDT) for position measurement are mounted in the two hydraulic cylinders of the manipulator. A potentiometer is used for slewing angle measurement of the manipulator. All movements of the manipulator as well as the rotation of the cutter are controlled hydraulically by on/off valves. For the determination of the concentration of the slurry in the hose, a gamma ray based slurry concentration measurement system is implemented on the crawler. The volume flow of the slurry can be adjusted continuously with a proportional control valve that is controlled by a proportional amplifier. A conventional power sensor using two potential transformers and one current transformer measures the true power consumption (kW) of the slurry pump motor during the mining process. After the mining process is completed, remaining water has to be drained from the slurry hose for coiling up during retrieval. To allow the water to flow out of the slurry hose there is a hydraulically activated ball valve mounted at the connecting tube between slurry pump and slurry hose, which is opened after mining.
OMS-01-MT-15
The slurry pump motor, the motor of the hydraulic system, and two cameras with lights are electrically switched with relays. Resistance temperature detectors (RTD) for measuring the temperature of the hydraulic oil in the hydraulic tank and in the slurry pump motor give information about the system health condition. For safe driving operation, the position of the crawler with respect to the ship, the crawler heading and inclination, the velocity of the crawler over ground and the track belt velocities are measured. Furthermore the angles between crawler and cable are measured. For system health condition monitoring there is an absolute pressure sensor connected to the pressure line of the hydraulic system. The ship’s position is determined by the global positioning system (GPS). The position of the crawler is measured with an acoustic positioning system making use of the ultra short base line technique (USBL). The X and Y co-ordinates with respect to the ship are given by this system. The accuracy of the system is 0.25% full scale. On the crawler and at the highest point of the S-shaped part of the flexible riser two beacons are installed. By using the beacon on the flexible riser, any entanglement of riser and ship’s propellers could be avoided. The heading of the crawler is measured with an electronic compass, that uses magneto-resistive sensing elements to measure the earth magnetic field. The “magneto-resistive sensing elements comprise a Wheatstone bridge arrangement of a material, whose resistance changes with the incident angle of a magnetic field” (TSS Ltd., 1998). Compensation of magnetic influences from the mining machine is done in hardware by current straps around the sensing elements and by software calibrating routines adapting the compass to the crawler. The inclination of the crawler (pitch, roll) is measured by means of three orthogonal linear accelerometers. For the measurement of the crawler velocity over ground, a dual axis Doppler log is used. It continuously transmits acoustic energy into the water from all the four transducers at a frequency of 750kHz. When there is relative motion between the Doppler log and sea bed, the frequency of the reflected signal is shifted (Doppler shift) proportionally to the velocity. Additionally to the absolute velocity measurement, the velocities of the track belts of the crawler are calculated from the measurement of the rpm of left and right drive drum by inductive pickups. The measurement of both, the absolute and the track velocity, is used for calculating the slip of the crawler track belts. The slip is controlled in a closed loop system implemented in the control software on the crawler computer. For controlling the driving operation the left and right track speed can be adjusted continuously by proportional control valves for adjustment of crawler speed. This is done either manually by joysticks, or in the automatic driving mode by giving a set value in the visualisation screen, which is described in detail later and shown in Figure 5.
LAUNCHING AND RETRIEVAL For the launching process the touchdown of the crawler on the sea bed is one of the most critical actions during operation. For this action, the measurement of the height of the crawler over the sea bed and the measurement of the force in the cable is most important. The height of the crawler over the sea bed is directly measured with an altimeter, based on ultrasonic run-time measurement. A strain gauge load cell is used for the cable force measurement. For soft touchdown, the cable force measurement gave very good information for the manual winch
Page 2 of 7
control. The speed of the winch is adjusted manually by hydraulic valve operation in the range of 0 – 0.5 m/s.
voltages for amplifiers of the proportional hydraulic valves and switching of relays).
A camera with lights, mounted in the back of the crawler allows visual inspection of the sea bed as long as there is no plume in the water. From ambient pressure measurement, the diving depth of the crawler could be calculated with an error of ±3m. Furthermore the comparison between the reeled-out cable length and the measurement of water depth with the ship’s echo sounder gives information about the height of the crawler over the sea bed. During launching, the heading of the crawler with respect to the ship has to be kept constant to avoid twisting of the slurry hose. For this purpose, a thruster mounted at the manipulator is used (Figure 1). It is operated manually by a joystick integrated in the operator’s console.
The main advantages of the Interbus structure is, that it is easily upgradable and easy to handle due to the modular structure. Furthermore the configuration of the modules can be done remotely by software. Each module has got features for the indication of its power supply and for the actual status of the Interbus. These features have proven to be very helpful during the start-up and testing phase of the sand mining system.
Relays
Interbus Modules for Digital I/O and Analog I/O
Interbus Counter Modules
Aluminium Housing
All operations during launching and retrieval, when the crawler is brought to or from the water, are monitored from the control container by three cameras suitably mounted on the ship. In the measurement system some redundancies are built in. One example is the measurement of the crawler height over the sea bed described above. Despite of temporary malfunction of the altimeter it was possible to let the crawler touch down softly on the sea bed.
Figure 2:
Electronics with Interbus modules for digital and analog I/O, Interbus counter modules and relays
CONTROL SOFTWARE CONTROL HARDWARE ON SHIP AND CRAWLER The hardware of the control system on the ship is all built in a movable container, installed on the ship’s deck during the sea trials. Main components are three pentium based control PCs and monitors for the process visualisation, interfaced by data acquisition cards to switches and joysticks, monitors for the camera pictures from the ship’s deck and from the crawler, and remote control facilities for winch operation and the control part of the acoustic positioning system. All the components are mounted in the operators console. Two of the control PCs are used during operation of the sand mining system, the third is a standby PC, which can be put into operation instead of either of the two used control computers within two minutes. The control data and video signals are converted by fibre optic modems and are sent through the winch into the main cable. The electronic hardware on the crawler is mounted in four pressure proof tubes. Two tubes contain the control electronics, in a third tube the low voltage power supply for sensors and actuators is mounted (24 V DC and 220 V AC) and a fourth tube contains the power measurement of the slurry pump and the high voltage vacuum relay for switching of the 3000 V AC. To avoid condensation inside the housings, Silicagel was inserted before closing the tubes to keep the relative moisture content of the air in the housings at 40%. All tubes are connected through underwater cables. In case of damage of the underwater cables and subsequent short circuiting, fuses are provided to prevent the entire control system from serious damage. In order to minimise the space requirements in the tubes, the control computer on the crawler is built with PC/104 modules. The control computer is equipped with a pentium CPU, an Ethernet card with fibre optic modems for communication with the ship’s control PCs and an Interbus card as interface to Interbus data acquisition and control modules. The Interbus modules are used for all analog and digital inputs from the sensors (including counting of impulses speed sensors with counter modules) as well as for the analog and digital outputs (control
OMS-01-MT-15
The control software consists of a system of programs shown in Figure 3. Ship PC 1 (Server) Operators Console (Joysticks, Switches,...)
Dasylab I/O-Card Driver
Process Visualisation Development Environment (Dasylab) Soft PLC Development OCI (Open Com Interface) Environment (Multiprog)
Ship PC 2 Ship PC 3 (Client 1) (Client 2, Standby) Process Process Visualisation Visualisation (Dasylab) (Dasylab) Operating System (Windows NT)
Operating System (Windows NT)
Operating System (Windows NT)
Ship
TCP / IP Crawler PC (Client 3) Realtime Operating System (QNX) Soft PLC Kernel (Multiprog Kernel [Interpreter])
Interface Driver
Interbus 2 Digital I/O, Analog I/O Analog Signals of Transducers
Soft PLC Application (Multiprog Application) Interface Driver to Interbus Interface Driver
Mining Machine
Interbus 1 Digital I/O, Analog I/O,...
Control Elements Analog Signals of Transducers
Sensors
Control Elements
File: SoftcompISOPE.dsf
Figure 3:
Software configuration of the sand mining system
The computers used in the ship run with Windows NT as operating systems. The computers form a network using the network protocol TCP/IP (Transmission Control Protocol / Internet Protocol). TCP/IP is a network protocol to connect hosts on the internet or on local networks. The data transmission rate is 10 Mbit/s. The computer on the crawler is equipped with QNX, a real time operating system.
Page 3 of 7
On Ship PC 1 (Server) the developer environment of a soft PLC (Programmable Logic Controller, Multiprog) is installed. The soft PLC application generated and maintained here, is downloaded to the crawler computer and is there interpreted by the PLC Kernel. Through interface drivers the PLC application communicates with the Interbus modules. The crawler PC boots up automatically after being energised. Furthermore, on ship PC 1, a developer environment of the process visualisation software is running. The developer version supplies all features to change the visualisation screens according to the requirements during the testing and start up phase. Ship PC 2 and PC 3 use the according runtime version. For the operation of the crawler, the application of the visualisation software run on PC 1 and PC 2 and communicate with each other via the network. Process visualisation software and the soft PLC application are linked through the Open Com Interface (OCI). The OCI translates the data format of PLC data into the data format of the process visualisation and the other way round, and enables communication between both programs.
VISUALISATION SOFTWARE During mining system operation, all the measured parameters have to be made available to the operators in a clear way. For the analysis of the performance, all important data have to be stored. The visualisation software has to be easy to use and should contain comprehensive help functions for quick reference. For this task, the process visualisation and data acquisition software DASYLab 5.0 Net has been chosen. For setting up the application, symbolised function units (modules) are arranged like in a circuit diagram according to the requirements of the sand mining system. The modules are taken from the module library which contains all modules necessary for the application. The modules are linked by lines. Figure 4 shows an example of data input and processing in the application for the sand mining system on ship PC 1. The module “R_PLC_REAL” makes available the data in Dasylab, which are sent from the PLC through the OCI. Some of the data are sent to display modules (hydrpressure, Density&Mass), and the length measurement data from the LVDTs of the manipulator are converted into angles in the module “Length-Angle”. The module “Send Real” sends the data to ship PC 2 where they are visualised. The display of the module “hydrpressure” can be seen in the crawler operation screen (Figure 5, “hydraulic pressure”). For the sand mining system there are four visualisation screens. On ship PC 1 the screens for crawler operation (Figure 5) and for the launching and retrieval process are available. The other two screens, available on Ship PC 2, are for the control of the mining process and for system health condition monitoring. The screen for system health condition monitoring shows the status of the measurement system. There are warning lamps for malfunction of the connections to the sensors as well as there are warning lamps that show whether predefined limits of measurement values are exceeded (e.g. inclination of crawler more than 12 degrees). Special attention was paid to keeping the screens as simple and clear as possible.
OMS-01-MT-15
Figure 4:
Example of data input and processing in the application of the process visualisation for the sand mining system
Page 4 of 7
(language similar to Pascal), Function Block Diagram, Ladder Diagram and Sequential Function Chart. For the control program of the crawler mainly Function Block Diagram language in combination with structured text is used. In the folder Physical Hardware all the information about the connection of the specific hardware to the IEC1131 PLC is given. This is for example the processor type, the hardware specific driver, adjustment of specific PLC type supported by the hardware and the assignment of the variables to the absolute hardware addresses. Some of the important advantages of an IEC1131 soft PLC are: · The soft PLC supplies standard function blocks adapted to control tasks. · Efficient online debugging options are available. · The PLC is an open system as any customised source code can be integrated in Structured Text language. · 5 Different standardised ways of programming are available. · Task organisation is predefined by the PLC. · IEC1131 standard makes it easier for personnel familiar with any IEC1131 PLC to get acquainted with the application. · Predefined structures save a lot of time and money for search of errors.
Figure 5:
Visualisation screen for crawler operation
MAIN CONTROL SOFTWARE The main control program is a software implementation of a programmable logic controller (soft PLC, Multiprog) according to the IEC1131 standard. All soft PLCs that are certified according to the IEC1131 standard have got the same program structure (Figure 6). PROJECT (Application Name: Crawler) Libraries Data Types Logical Program Organisation Units (POUs) Physical Hardware
Figure 6:
Components of IEC1131 software projects (Klöpper und Wiege, 1998)
The PROJECT consists of Libraries, Data types, Logical POUs and Physical Hardware. The Library includes already existing projects which can be re-used for the generation of the new application. The folder Data Types contains the data types that are user defined. These data types can be assigned to the variables of the program like the elementary data types (e.g. Bool, Word) readily available. In the Folder Logical Program Organisation Units the source code of the project is stored in different POUs. The IEC1131 defines five different standardised programming languages: Instruction List, Structured Text
OMS-01-MT-15
Figure 7:
Calculation of driving distance of crawler with Function Block Diagram language
Page 5 of 7
Figure 7 shows an example of the calculation of the driving distance of the crawler on the sea bed with Function Block Diagram language. The average of the two track belt speeds (0_VIR03, 0_VIR04) is calculated. This value is passed to the integrator block (INTEGRAL_1) if the values of the speed over ground, measured by the Doppler log (0_VIR07, 0_VIR08), are bigger than 0.05 m/s. In the integrator, the driving distance is calculated and passed on to the process visualisation.
CLOSED LOOP CONTROL
Heading Control
Calculation of relative Slip and Output of bigger Value relative Slip
Slip Control
-
Right speed control
-
-
-
Boundary conditions Left speed control
Set signal left track belt
Set signal right track belt
Figure 9 shows the automatic adjustment of the actual crawler heading to the set heading value during driving in the automatic mode. Good performance can be seen with a maximum error of 4 degrees during stationary set direction.
The values for the crawler speed and the crawler heading can be set online by the operators on the ship. The real time performance of the operating system QNX is especially important for the correct timing of updating of measured and calculated values for the closed loop calculations. The cycle times in the application are 100 and 200 milliseconds for updating of values. The measurement values fed back into the closed loops are the actual heading measured by the magnetic compass, the belt speeds obtained by the inductive pickups counting the
Set Heading and Actual Heading of Crawler in Degree
Speed of left track belt over Ground
Left track belt speed
Actual Heading
Closed loop control diagram of crawler (Herzog, 2000)
OMS-01-MT-15
For the heading control loop an error signal is calculated out of the set heading value and the actual heading. A proportional-plus-derivative controller is generating a compensation signal which is added to the set speed signal. The combination of the speed and heading closed loops forms a cascade control loop system.
The closed loops are implemented as Function Block Diagram in the soft PLC, mostly using standard function blocks that are predefined in the function block library. For the speed controllers, the heading controller and the slip controller, customised function blocks were generated as proportional-plus-integral-plus-derivative controllers. The logic of the controllers is written in structured text language. All important controller parameters (proportional factors, time constants) are easily accessible in the function block diagram.
File: closeloopisope.dsf
Figure 8:
For each track belt there is a separate speed control loop. Two error signals for speed are generated (for left and right track) by subtracting the corresponding speed of the track over ground from the set speed. From the error signals two compensation signals are generated by the proportional-plus-integral controllers of left and right track belt. The compensation signals are added to the speed values of the track belts over ground and the sum of these is fed into the proportional amplifiers of the hydraulic drives (disturbance variable compensation).
For slip control, the slip of the left and right track belt is calculated separately. Both slips are continuously compared and the bigger slip value is passed to the slip controller. The compensation signal generated by the slip controller is finally subtracted from the set speed values for the speed closed loop.
Crawler
Right track belt speed
Speed of right track belt over Ground
Set Heading
Set Speed
On the crawler computer there are closed loops implemented for speed control, heading control and slip control. The concept of the closed loops is shown in Figure 8 (Herzog, 2000).
rpm of the drive drums and the speeds of the tracks over ground, which are obtained by the Doppler log velocity measurement.
200 Set Heading Actual Heading 180
160
120 08:29:46
Figure 9:
End of closed loop control (8:34:20)
Start of closed loop control (8:30:14)
140
08:31:12
08:32:38 Time
08:34:05
Automatic adjustment of the actual crawler heading during closed loop heading control during driving trials in September 2000 off Tuticorin coast, India
Page 6 of 7
RESULTS AND OUTLOOK The paper gives a detailed report of the instrumentation and control system of the sand mining system for shallow waters as a demonstration of the feasibility of this mining concept. The first project phase is a preliminary stage for the development of a manganese nodule mining system for 6000 m. The trials conducted successfully have proven the suitability of the instrumentation and control system and of the entire sand mining system. The details of the trials are reported in a separate paper also presented at the ISOPE in September of 2001. The control system is modularised in software and hardware and is therefore capable of being upgraded. As the main difference of a future manganese nodule mining system with respect to other industrial systems is the large distance between the complex moving crawler and the ship, time consuming launching and retrieval procedures should be reduced to a minimum. In a commercial manganese nodule mining system, the configuration of the software of the instrumentation and control system should be possible remotely without retrieval of the crawler, including the access to all complex measurement systems. An upgrading of the instrumentation could include an obstacle avoidance sonar as well as the logic for moving on predefined patterns in connection with a transponder grid being positioned on the ocean floor at the mining site. Apart from the successful demonstration of the mining concept, this first project phase has stimulated the development of deep sea instrumentation, for example the development of an ultrasonic concentration measurement system, which is capable of measuring mixtures of crushed nodules and water under deep sea conditions.
REFERENCES Herzog, (2000). “Entwicklung einer Antriebs-Schlupf-Regelung für ein Tiefsee-Raupenfahrzeug”, Dissertation, University of Siegen, Publisher: Verlag Shaker, 152 p. Klöpper und Wiege, (1998). “MULTIPROG wt Handbuch”, Klöpper und Wiege Software GmbH, 229 p. Rehorn (1994). “Entwicklung eines Tiefseeraupenfahrzeuges und Untersuchung seiner inneren Fahrwiderstände”, Dissertation, University of Siegen, Publisher: Verlag Shaker, 202 p. Schwarz, Freitag, Grebe, Hoffmann, Rehorn, (1992). “Tiefseemaschinen für die Manganknollengewinnung”, Foerdertechnik und Konstruktion, University of Siegen, 41 p. TSS Ltd., (1998). “1000 Metre Depth Rated Heading Capable Sensor Unit”, Technical Note, p. 23.
OMS-01-MT-15
Page 7 of 7