Available online at www.sciencedirect.com
ScienceDirect Procedia Engineering 107 (2015) 100 – 109
Humanitarian Technology: Science, Systems and Global Impact 2015, HumTech2015
Integrating and Applying Technology in Response to the Super Typhoon Bopha Disaster Michael Rossa *, Joy Santiagob and Alfredo Mahar Lagmayb a The Louis Berger Group, Inc., 412 Mount Kemble Ave., Morristown, NJ 07960 – 6654 National Institute of Geological Science, University of the Philippines, Diliman, Quezon City, 1101 Philippines
b
Abstract The Philippines is recognized as one of the most natural hazard prone country in the world. The December 4, 2012 Super Typhoon Bopha (referred is the Philippines as Typhoon Pablo) and the November 8, 2013 Super Typhoon Haiyan (Yolanda) are recent major disasters which The Louis Berger Group (Louis Berger) was requested by the U.S. Agency for International Development (USAID) to rapidly respond to. Louis Berger quickly identified partners and appropriate technologies, which it applied during these post-disaster recovery activities, strengthening the requested response and building local capacity and preparedness for future natural disasters and responses. This paper is based on the vulnerability assessment (VA) component of the Louis Berger’s contracted role in responding to the Typhoon Pablo event. The major USAID-funded Louis Berger response to Typhoon Yolanda is on-going with current contract completion scheduled in June 2016. © Published by Elsevier Ltd. This is an open access article under the CC BY-NC-ND license ©2015 2015The TheAuthors. Authors. Published by Elsevier Ltd. (http://creativecommons.org/licenses/by-nc-nd/4.0/). Peer-review under responsibility of the Organizing Committee of HumTech2015. Peer-review under responsibility of the Organizing Committee of HumTech2015
Keywords: post-disaster recovery; climate change vulnerability assessment; application of vulnerability assessment findings; mitigation measures; adaptation measures; Philippines; Typhoon Bopha; Typhoon Pablo
1. Introduction
* Corresponding author. E-mail address:
[email protected]
1877-7058 © 2015 The Authors. Published by Elsevier Ltd. This is an open access article under the CC BY-NC-ND license
(http://creativecommons.org/licenses/by-nc-nd/4.0/). Peer-review under responsibility of the Organizing Committee of HumTech2015
doi:10.1016/j.proeng.2015.06.063
Michael Ross et al. / Procedia Engineering 107 (2015) 100 – 109
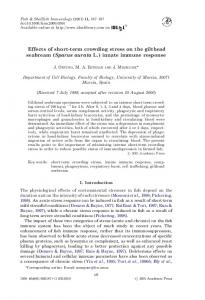
The provinces of Compostela Valley and Davao Oriental are located in the southeastern portion of Mindanao, Philippines – an area of the country traditionally referred to as “typhoon-free.” Both of these provinces sustained heavy damage to population centers, infrastructure, forest, upland, and coastal ecosystems due to the onslaught of Typhoon Pablo (international name “Bopha”), including over 1,067 fatalities and 834 missing [1]. This Category 5 super typhoon provinces, which made landfall on December 4, 2012 and passed directly through these two provinces, represented the most southerly Category 5 typhoon to have occurred in the northern hemisphere to date [2].
Figure 1. Geographical and Administrative Map with Typhoon Pablo Storm Path: Compostela Valley and Davao Orental.
To help address such extreme weather events, USAID funded a Rapid Climate Change Vulnerability Assessment (VA) for the two provinces as part of a broader post-disaster reconstruction and recovery program of work for which Louis Berger was contracted (Table 1). The 8 municipalities within these 2 provinces that were most seriously affected by Typhoon Pablo were chosen as the VA study sites (Figure 1). Following reviews and approvals by USAID, the VA study was conducted between April and September 2013. Follow-on activities included community awareness, capacity assessment and capacity building activities.
101
102
Michael Ross et al. / Procedia Engineering 107 (2015) 100 – 109 Table 1. Report Outline: Rapid Climate Change Vulnerability Assessment. _____________________________________________________________________________ BACKGROUND: Scope of Work; Existing Assessments and Resources RESULTS OF VULNERABILITY ASSESSMENT: Summary of Climate Change Projections; Special Hazards in the Study Area; Methodology Applied for Vulnerability Assessment; Assessment of Adaptive Capacities and Sensitivities; Application of VA Results: Proposed Infrastructure Projects; Projected Susceptibility to 100-Year Flood Hazard; Projected Susceptibility to Storm Surge; Sensitivities RECOMMENDATIONS: Mitigation Measures – Design Features of the Proposed Infrastructure Projects; Adaptation Measures / Strategies; Special Adaptation Measures for Most Vulnerable Groups (MVGs); Institutional / Local Government Adaptation Initiatives and Identified Gaps; Recommended Follow-On Activities _____________________________________________________________________________
The VA study was conducted by Louis Berger in partnership with the University of the Philippines’ National Institute of Geological Sciences (UP-NIGS). The UP-NIGS study activities was led by one of the co-authors, Dr. Alfredo Mahar Lagmay. This study provided a rapid assessment of the potential impacts of current climate change projections in the area, focusing on increased rainfall, flooding, landslide, debris flow and storm surge events, such as experienced during Typhoon Pablo. Focus was further placed on the 16 community infrastructure reconstruction projects that were proposed for USAID funding. These infrastructure reconstruction projects were identified and prioritized by the Louis Berger team based on recommendations of local and national government agencies. The selected infrastructure projects included the reconstruction of small-scale bridge structures that could serve as evacuation routes during future events. The design of the VA study reflected the UN Hyogo Framework for climate change vulnerability and the key components of hazards, exposure and capacity [3]. The study design was also in line with Strategic Objective 2 of USAID’s Climate Change and Development Strategy, to increase the resilience of people, places, and livelihoods to changing climate. The study incorporated relevant work completed to date for assessing climate change vulnerability in the study areas, with the results and recommendations directly shared with the local communities, institutions and government agencies. 2. Results of Vulnerability Assessment The Philippines ranks third in the list of countries most vulnerable to climate change according to a study conducted by the UN University’s Institute for Environmental and Human Security [4]. In the UN report, the risk index was analyzed using each country’s exposure to natural disasters such as storms, floods, earthquakes, droughts and sea level rise. Because of man-made factors (e.g. land conversion, deforestation, and small-scale mining activities) the risk has a potential multiplier effect to climate change effects on future natural disasters. In addition to high winds up to 185 kph, intense heavy rainfall and storm surges, Typhoon Pablo also generated a massive debris flow in the municipality of New Bataan[5]. This debris flow accounted for many of the Pablo victims, who died inside a public school building that was used as an evacuation center. Storm-generated debris flows, among the world’s most destructive natural phenomena, are fast-moving slurries of water and rock fragments, soil, and mud [6, 7, 8, 9]. The New Bataan debris-flows that overwhelmed 550 refugees in the evacuation center had an estimated volume of about 25-30 million m3 meters based on the analysis of satellite and post-Pablo LiDAR imagery and field measurements. 2.1. Methodology Light Detection and Ranging (LiDAR) was one of the major tools used in the VA study. The technology was used for contour mapping to develop a more precise base map for flood simulations. High-resolution Digital
Michael Ross et al. / Procedia Engineering 107 (2015) 100 – 109
Elevation Models (DEMs) with 1 m postings were resampled to 15-meter postings to generate two-dimensional flood simulations of the floodplains using FLO-2D [10]. Areas with no available LiDAR coverage were simulated for flood hazards using the Shuttle Radar Topography Mission (SRTM) 2000, 90-meter elevation dataset. A 1/100-year Rainfall Intensity Duration Frequency (RIDF) was used for the flood simulations and is based on data provided by Philippine Atmospheric, Geophysical and Astronomical Services Administration (PAGASA). The RIDF value used has a maximum rain value of 199.9 mm of rain measured over a span of 24 hours and was calculated based on historical records taken from the nearest PAGASA weather station, located in Davao City (Figure 2). This station is approximately 90 km away from the southern boundary of the VA study area. In addition, a 5-meter pixel resolution post-Pablo disaster spot satellite image (dated December 12, 2012, or 8 days after the Typhoon Pablo event) was interpreted and compared with the results of the flood simulations using the spatial analytical tool of a Geographic Information System (GIS). Aerial images taken immediately following the typhoon event as well as available flood and landslide hazards maps sourced from the Philippine’s Mines and Geosciences Bureau (MGB) and the Philippine Institute of Volcanology and Seismology (Phivolcs), respectively, were also used as reference in the interpretation of hazards in the VA study area. The GIS layers developed and applied for the VA study include: Base maps (project sites and political boundaries); aerial images; LiDAR coverage (SRTM elevation data used in the absence of LiDAR data); contour lines; digitized SPOT satellite images; hazard maps generated from flood simulations; simulated flood depth maps; numerical models of flood flow velocities; flood and landslide hazard maps from MGB; and earthquake-induced landslide hazard maps from Phivolcs. The VA study team also conducted field surveys and interviewed local residents to validate the results of the simulations. Field surveys from other UP-NIGS activities in the area following the Pablo event complemented data used in the validation process.
Figure 2. Projected Rainfall Values per Return Period Compared to Recorded Typhoon Pablo Rainfall.
2.2. Findings 2.2.1. Projected Susceptibility to 100-year Flood Hazard The 100-year rain return period flood hazard maps generated during the VA study indicate that 12 - 28.5% of each of the 8 eight municipalities are susceptible to flooding, mostly involving existing residential, business and community centers. These hazard projections reflect the flooding events that followed Typhoon Pablo.
103
104
Michael Ross et al. / Procedia Engineering 107 (2015) 100 – 109
2.2.2. Projected Susceptibility to Storm Surge Storm surges may be associated with major typhoons and the vulnerability to storm surges is expected to increase with increasing coastal populations and rising sea levels. Based on local reports, a storm surge with a height of approximately one meter was experienced during Typhoon Pablo. This storm surge event reportedly reached 500 meters inland from the coastline. Using Typhoon Pablo’s best track path from the Japan Meteorological Agency (JMA) and the astronomical tide from WXTide software, a storm surge inundation map was generated using Flo2D to verify whether the project sites near coastal areas were affected by storm surges (Figure 3). The numerical scheme of the model is based on the shallow water equations and thus this model is two-dimensional [11]. Historical records from PAGASA shows a storm surge event of up to 3.66 meters in the city of Bislig, located about 60 km from the northern coastal boundary of the Davao Oriental province.
Figure 3. Sample Storm Surge projection including proposed sites of nearby infrastructure reconstruction projects (Legend in meters).
3. Application of the VA Findings 3.1. Mitigation Measures Based on the VA study findings, design modifications were identified and applied to the 16 infrastructure reconstruction projects. These design modifications included: increased hydraulic designs and elevations, strengthened structures and embankments, overflow capacity of several bridge structures, and recommended location changes. The project’s design engineers were directly involved during the VA study and were provided with details on the flood levels and velocities that were independently projected by the VA study team. The velocity and discharge measurements carried out using Flo-2D were used as a validation to the Rational Formula and Manning Equation[10] for open channel flow and then applied by the engineering design team. Additional freeboard was also
Michael Ross et al. / Procedia Engineering 107 (2015) 100 – 109
provided in the bridge designs to accommodate the high volume of forest and agricultural debris experienced during Typhoon Pablo (Figure 4). As a wind mitigation measure, the roofing design criteria for the roofing of proposed community trading centers was based on a wind load of 250 kph, which is higher than the maximum wind velocity of 185 kph recorded during Typhoon Pablo.
Figure 4. Competed footbridge project which replaced the former structure that was washed away during Pablo. As mitigation measures, the freeboard, approach elevations and embankment strength of the new structure were increased based on the VA study.
3.2. Adaptation Measures Complementing physical mitigation measures applied in facility designs, site-specific adaptation measures applicable to use and maintenance of the completed facilities were identified through the VA study. An example of such an adaptation measure is the recommended temporary closure of some bridge facilities, which were designed to overflow during periods of high floods. These adaptation measures included the preparation and placement of bilingual hazard awareness and warning signs (i.e. Tagalog and Bisaya) next to each of the constructed facilities. Examples of the site-specific mitigation and adaptation measures are provided in Table 2. Comprehensive adaptation measures were discussed during provincial conferences organized and conducted by the VA study team, concerned agencies and local institutions (Figure 5). These conferences involved the presentation and peer review of existing disaster risk reduction (DRR) plans of the local government units (LGUs), leading to recommended actions to improve the quality and effectiveness of these plans. These recommendations were guided by the Pablo experience and findings of the VA study. 4. Adaptive Capacities The Hyogo Framework recognizes adaptive capacities as a key response to the vulnerabilities created by potential climate changes. The Pablo event, in an area traditionally considered as “typhoon-free”, highlighted the importance of improving adaptive capacities to future events of affected LGUs and concerned government agencies. Adaptation measures supported by USAID under the VA study include:
105
106
Michael Ross et al. / Procedia Engineering 107 (2015) 100 – 109
1. Capacity assessment / building: Senior peer reviews of existing local DRR plans, including assessments of current organizational and operational capacities. These VA study activities included by training in the use of GPS and geo- referenced hazard maps activities; 2. Watershed management: Inter-agency and community consultations, resulting in approved work plans and budget commitments to help address complex upland management issues in 2 selected watersheds; 3. Communications and awareness: Improved communications and awareness materials and billboards, including distribution of updated, bi-lingual, multi-hazard maps to LGUs and national government agencies. Table 2. Applied VA Findings: Examples of Mitigation and Adaption Measures. (Note: all project sites are outside of identified landslide and storm surge hazard areas)
Project Name and Description
Results of VA: Extreme Flooding / Typhoon Winds
Proposed Mitigation / Adaptation Measures
1. Poblacion Baganga Market Building Construction (reconstruction of wind-damaged public market structure)
Projected that there is no future flood hazard based on a 100 year return flood scenario. The structure was not flooded during Typhoon Pablo.
Mitigation measures: Design is typhoon wind resistant. Floor elevation raised to prevent flooding of the structure during heavy rains. Drainage canal to be provided around the perimeter of the structure. Adaptation measures: Proper maintenance of the structure, roof and drainage canal.
2. Sitio Mahayahay Overflow Bridge Rehabilitation (reconstruction of retaining wall and rip-rap slope protection; concrete and gravel paving of bridge approach road; river clearing / desilting)
Projected 100-year flood level is 2 meters above the area near the bridge. The Pablo flood level was 0.5 meters above the top of overflow structure.
Mitigation measures: Bridge is designed to allow high flood levels to overflow the structure. Rip-rap slope and concrete pavement protection will improve resilience of the structure during such flood events. Existing horizontal railing will be removed to avoid obstruction of debris during overflow. River clearing / desilting will restore flow capacity of the channel and bridge. Adaptation measures: Temporarily close the bridge during high floods. Provide warning signs near bridge approaches. Adopt communication / evacuation plans which identify alternative routes when bridge is closed.
3. Purok Duranta Overflow Bridge Rehabilitation (concrete and gravel paving of bridge approach road; rip-rap slope protection; reconstruction of concrete wheel guards; channel clearing)
Projected 100-year flood level is 0.5 to 1 meter above the structure's surface. The Pablo flood was 1.2 meters above the top of the overflow structure.
Mitigation measures: Bridge is designed to allow high flood levels to overflow the structure. Rip-rap slope and concrete pavement protection will improve resilience of the structure during such flood events. River clearing / desilting will restore flow capacity of the channel and bridge. Adaptation measures: See Project 2 – Sitio Mahayahay Overflow Bridge Rehabilitation.
4. Sitio Santol Overflow Bridge Rehabilitation (concrete paving of bridge approach roads; concrete slope protection; concrete wheel guards constructed)
Projected 100-year flood level is up to 4 meters above the riverbank and 1 to 1.5 meters in nearby areas. The Pablo flood level was 0.4 meters above the top of the overflow bridge.
Mitigation measures: Bridge is designed to allow high flood levels to overflow the structure. Slope and pavement protection will improve resilience of the structure during such flood events. Adaptation measures: See Project 2 – Sitio Mahayahay Overflow Bridge Rehabilitation.
5. Ngan Overflow Bridge Rehabilitation (slope protection; retaining wall; concrete paving of the bridge approaches and road; cleaning and desilting of existing culverts; channel cleaning)
Projected 100-year flood level is 2 meters above the surface of the bridge structure. The Pablo flood level was 1.3 meters above the top of the overflow bridge.
Mitigation measures: Bridge is designed to allow high flood levels to overflow the structure. Slope and pavement protection will improve resilience of the structure during such flood events. Adaptation measures: See Project 2 – Sitio Mahayahay Overflow Bridge Rehabilitation.
(Table continues on next page)
Michael Ross et al. / Procedia Engineering 107 (2015) 100 – 109
Project Name and Description
Results of VA: Extreme Flooding / Typhoon Winds
6. Poblacion Compostela Trading Center Construction (construction of new structure with raised floor elevation; provide drainage canal)
Projected 100-year flood level of 0.5 meters and up to 1.5 meters in surrounding areas. The Pablo flood level was 0.15 meters above the trading center floor.
Mitigation measures: Design is typhoon wind resistant. Elevated floor will minimize / avoid future flooding; drainage canal to be constructed around structure. Adaptation measures: Provide proper maintenance of the structure, roof and drainage canal.
7. Lebanon-San Jose Barangay Bridge Construction (construction of concrete slab bridge to replace former culverts; concrete paving of bridge approach roads; riprap slope protection)
Projected 100-year flood level of up to 1 meter in the area of the structure. The Pablo flood level was 0.6 meters above the existing bridge’s gravel road.
Mitigation measures: Replacement of former culverts with slab bridge will increase channel opening and reduce clogging of debris during heavy rains; design elevation is well above maximum flood levels. Adaptation measures: Provide proper maintenance of bridge structure, including regular cleaning of debris and silt from channel; install warning signage.
8. San Jose Footbridge Construction (elevation of footbridge; riprap abutment protection; walling along approaches)
Projected that there is no flood hazard based on a 100-year return flood scenario. However, flood hazard is high in nearby areas, with projected flood level of up to 3 meters.
Mitigation measures: Raised elevation is well above maximum flood levels; abutment protection and approach walling will protect against debris and scouring. Adaptation measures: Provide proper maintenance of bridge structure; install appropriate warning signage.
9. Alegria Barangay Bridge Construction (construction of concrete slab bridge to replace former culverts; riprap slope protection; desilting)
Projected 100-year flood level is up to 1 meter. The Pablo flood level was 0.2 meters above the existing bridge gravel surface.
Mitigation and adaptation measures: See Project 7 – Lebanon-San Jose Barangay Bridge Construction.
10. Carmen Trading Center Construction (construction of new structure with raised floor elevation; improve drainage)
Projected 100-year flood level is 0.5 meters. The structure was not flooded during Pablo.
Mitigation and measures: See Project 6 – Poblacion Compostela Trading Center Construction.
11. Aguinaldo Trading Center Construction (construction of new structure with raised floor elevation; provide drainage canal)
Projected that there is no future flood hazard based on a 100 year return flood scenario. The structure was not flooded during Pablo.
Mitigation measures: See Project 7 – Poblacion Compostela Trading Center Construction.
12. Panag Barangay Bridge Construction (construction of concrete slab bridge to replace former culverts; riprap slope protection; desilting)
Projected 100-year flood level is up to 2.5 meters in the area of the structure. The Pablo flood level was about 0.4 meters above existing bridge pavement
Mitigation and adaptation measures: See Project 9 – Lebanon-San Jose Barangay Bridge Construction.
Proposed Mitigation / Adaptation Measures
4.1. Rapid Assessment of Adaptive Capacities and Sensitivities The rapid assessment of adaptive capacities and sensitivities employed qualitative Key Informant Interviews (KIIs). In partnership with a senior socio-anthropologist from the Central Mindanao University, 39 key informants were selected in the 8 municipalities based on their direct involvement in institutional adaptive capacity on climate change, including those from the fields of Environment and Natural Resources, Planning and development, Engineering and Agriculture, Social Welfare, Gender and Development, and Indigenous People / IP (the study area has a large indigenous population). The data generated through the KIIs were subjected to descriptive analysis. A thematic analysis was then employed where patterns and themes of the responses were determined and analyzed to support the overall VA study findings.
107
108
Michael Ross et al. / Procedia Engineering 107 (2015) 100 – 109
Figure 5. Conference in the project sites to build capacity of LGUs and agencies in disaster awareness and management, led by Dr. Mahar Lagmay, UP-NIGS.
5. Test of the VA Study Applications 5.1. Comparison to a Post-Pablo (2014) Tropical Depression Event Following reconstruction of these 16 community infrastructure projects, a Low Pressure Area (LPA) entered the Philippine Area of Responsibility (PAR) on January 10, 2014 and was upgraded to tropical depression (TD) status by PAGASA on January 17, 2014. It was locally named Agaton, the first tropical cyclone of 2014 [12]. Between January 10 - 17, this LPA caused heavy rainfall in the VA study area, with 1,168 mm cumulative rainfall measured by the U.S. National Aeronautics and Space Administration (NASA), using the TRRM (Tropical Rainfall Measuring Mission) Multi-Satellite Precipitation Analysis (TMPA) [13]. In comparison, the cumulative rainfall from Typhoon Pablo was only 240 mm between November 28 and December 5, 2012 [13]. Local residents reported that flooding events in the vicinity of the USAID-funded infrastructure projects were more severe during the LPA Agaton event than during Typhoon Pablo. The Philippine Department of Public Works and Highways (DPWH) also reported the same observations as reflected in the number of flood damaged bridges in Mindanao. Due to the heavy, prolonged rainfall brought by Agaton in Mindanao, flooding and landslide incidents were reported in several provinces, including both VA study provinces. Six municipalities in Davao Oriental provinces were placed under the state of calamity according to the National Disaster Risk Reduction and Management Council (NDRRMC) report on the event [14]. All facilities that were designed with inputs from the VA study and constructed under the USAID-funded project performed well, with only minor scouring damage to 3 bridge embankments. Few casualties resulted from the LPA Agaton event, which indicated a positive response to the overall disaster response and preparedness support provided by many, including USAID, following Typhoon Pablo. 6. Conclusions The innovative and integrated VA study approach applied by Louis Berger resulted in a rapid, cost-effective contribution to the USAID-funded response to the 2012 Typhoon Pablo natural disaster. This VA approach
Michael Ross et al. / Procedia Engineering 107 (2015) 100 – 109
109
integrated appropriate technologies, which were directly incorporated into the overall project with a high-level of local engagement. The overall cost of the 6-month VA study was in the range of 5% of the total project cost for Louis Berger’s contracted activities. The VA study was conducted while project locations and design criteria were still being established. The engagement of the design engineers with the VA study team allowed for the direct sharing and integration of the VA study findings into the final selection of facility locations, structural elevations and engineering designs. The concurrent timing and integration of the VA study supported the development of mitigation and adaptation measures responsive to the hazards projected by the study. The involvement and interaction with local institutions, experts and agencies was maximized during the study process to identify corresponding adaptive measures. The VA study team benefitted and utilized local information and observations from the Pablo events in confirming their projections and plans. Direct, hands-on engagement and capacity building of local government units and agencies was aided by the linkage to actual facilities being concurrently constructed in their respective areas under the USAID-funded project. These approaches and experiences gained are now being applied by Louis Berger under an on-going USAIDfunded reconstruction and recovery project, called Rebuild, which addresses the November 2013 Super Typhoon Haiyan (Yolanda) disaster. Acknowledgements This work was supported by USAID under Contract AID-492–C–00–08-00001 for the Growth with Equity in Mindanao (GEM) Program managed by Louis Berger. The authors would like to thank the following individuals who were directly involved in the design, conduct and/or review of the work described in this paper: Ma. Theresa S. Robielos (USAID); Dani Newcomb (USAID), Rodel Lasco (OML Center for Climate Change), Jerico E. Mendoza (UP-NIGS/GEOS), Eva Mendoza (Central Mindanao University), Jessica Salas (Philippine Watershed Management Coalition), Beverly Brebante (Philippine Mines and Geosciences Bureau). The authors would also like to thank key contributors to the VA study from Louis Berger: Marilou Sian, Caloy Tan, Charlie Fiebel, Nikki Meru, Vicky Reyes-Mondonedo and David Hoehner. References [1] Philippine National Disaster Risk Reduction and Management Council / NDRRMC: SitRep No.38 regarding Effects of Typhoon "PABLO" (Bopha), 2012. [2] http://modis.gsfc.nasa.gov/gallery/individual.php?db_date=2012-12-04. http://blog.metoffice.gov.uk/2012/12/03/typhoon-bopha-on-course-for-southern-philippines [3] International Strategy for Disaster Reduction: Hyogo Framework for Action 2005-2015. World Conference on Disaster Reduction, 2005. [4] United Nations University and The Nature Conservancy: World Risk Report, 2012. Berlin: Alliance Development Works. [5] Lagmay, A.M.F., Colmenares, E., Alconis, J., Mendoza, J., Santiago, J., Rodolfo, K., Minimo, L., Gonzales, L., Eco, R.N., Serrado Herrero. T.: How debris buried Compostela village. Philippine Daily Inquirer, February 9, 2013. [6] Takahashi, T.: ‘Debris flows.’ Annual Reviews of Fluid Mechanics. 13. (1981) pp. 57-77. [7] Hutter, K., B. Svendsen, and D. Rickenmann: ‘Debris flow modeling: A review.’ Continuum Mechanics and Thermodynamics. 8(1; 1994). pp. 1-35. [8] Iverson, R.M.: ‘The physics of debris flows.’ Reviews of Geophysics. 35(3; 1997). pp. 245–296. [9] Iverson, R. M., M. E. Reid and R. G. LaHusen: ‘Debris-flow mobilization from landslides.’ Annual Reviews of Earth and Planetary Sciences. 25 (1997). pp. 85-138. [10] FLO-2D Software, Inc.: FLO-2D Reference Manual. Nutrioso, Arizona, 2013. [11] Higaki, M., 2006. A Guide to Storm Surge Model. In Fourth Regional Workshop on Storm Surge and Wave Forecasting, 2006. Office of Marine Prediction, Japan Meteorological Agency [12] Philippine Atmospheric, Geophysical and Astronomical Services Administration: Weather Bulletin No. 1, Tropical Cyclone Warning: Tropical Depression "Agaton", 2014. [13] NASA: Typhoon Bopha (Western North Pacific Ocean), Dec. 6, 2012. http://www.nasa.gov/mission_pages/hurricanes/archives/2012/h2012_Bopha.html#13. [14] NDRRMC: SitRep No.8 re: Preparedness Measure and Effects of the Low Pressure Area (LPA), 2014.