this approach enables a high level of integration and inter-operability between different tools, while ... Pacific Symposium on Biocomputing 4:392-400 (1999) ...
Pacific Symposium on Biocomputing 4:392-400 (1999)
INTEGRATING COMPUTATION AND VISUALIZATION FOR BIOMOLECULAR ANALYSIS: AN EXAMPLE USING PYTHON AND AVS M. F. SANNER, B. S. DUNCAN, C. J.CARRILLO, and A. J. OLSON The Scripps Research Institute 10550 North Torrey Pines Road, La Jolla, CA-92037 One of the challenges in biocomputing is to enable the efficient use of a wide variety of fast-evolving computational methods to simulate, analyze, and understand the complex properties and interactions of molecular systems. Our laboratory investigates several areas including molecular visualization, protein-ligand docking, protein-protein docking, molecular surfaces, and the derivation of phenomenological potentials. In this paper we present an approach based on the Python programming language to achieve a high level of integration between these different computational methods and our primary visualization system, AVS. This approach removes many limitations of AVS while increasing dramatically the inter-operability of our computational tools. Several examples are shown to illustrate how this approach enables a high level of integration and inter-operability between different tools, while retaining modularity and avoiding the creation of a large monolithic package that is difficult to extend and maintain.
Introduction The number of programs available to perform computations to derive molecular properties and/or simulate their behavior is large and growing rapidly. Not only are there many different computational techniques (e.g., molecular dynamics, conformational analysis, quantum mechanics, distance geometry, docking methods, ab-initio methods), but they also come in many flavors and variations, using different force fields, search techniques, algorithmic details (e.g., continuous space vs. discrete, Cartesian vs. torsional). Even though some have a clear advantage over others for a specific problem, this is not the general case, and one has to apply several methods to determine which works best for a given problem. Sometimes it is necessary to modify methods or use several in conjunction to obtain the desired results. For most of these computational methods, visualization plays a key role for setting initial parameters, analyzing results, and even steering the computation itself. Here again, there is a plethora of tools available such as Rasmol [1], Midas+ [2], Insight (MSI), Sybyl (TRIPOS), AVS [3], Data Explorer (IBM), VMD [4] each with its own strengths and weaknesses. On top of this already complicated situation is the software developed in-house that should work together with all these tools. This situation is so complex that most scientists settle for a limited set of tools that they get to work
Pacific Symposium on Biocomputing 4:392-400 (1999)
together to some extent, mainly by creating filters allowing them to pass data from one program to another. This suppresses a lot of creativity and provides only the most basic level of tool inter-operability. Another approach is to use a commercial package like Sybyl or Insight that provides a number of computational tools and specialized visualization capabilities. However, these packages do a limited set of tasks. Again, this reduces the number of computational pathways available to solve a problem, and these packages usually offer limited support for the integration of new methods and do not inter-operate well with other packages. One can also merge packages for which the source code is available, adding for instance, visualization capability to a computational method. This approach can provide tight integration, however it often requires significant programming effort and the resulting packages usually become large and difficult to extend and maintain. In this paper, we present an approach based on an object-oriented, interpreted language to create an interactive execution environment with the following properties: (1) extensibility, i.e., new methods can be added easily, (2) tight integration, i.e., computational methods can work together to solve a problem, (3) modularity, i.e., the different methods have to remain independent to create a system that can grow and still be easy to maintain. We present an example based on the interpreted, object-oriented language Python [5,6] and show how this language enabled us to make our computational tools inter-operable among themselves and with our primary visualization environment, AVS. Here, we discuss the dataflow AVS environment and the Python programming language. We explain how we embedded a Python interpreter into an AVS module, and give a number of examples illustrating different advantages offered by this approach. Finally, we discuss the choice of Python over other interpreted languages and the benefits gained from embedding a Python interpreter into an AVS module. 1
AVS: A dataflow computation and visualization environment
Over the last ten years, our laboratory has been using AVS to address some of the challenges posed by biomolecular computing and visualization [7]. AVS comes with a large number of processing modules for a wide variety of operations such as: data input, image processing, surface and volume rendering, etc. These modules can be linked together graphically using a network editor. Once an output port of a module has been connected to an input port of another module, the first module can send data through this connection and trigger the execution of the module receiving the data. These networks define a processing stream for a particular visualization or computation. This visual programming/ dataflow environment also offers a mechanism for adding custom-designed
Pacific Symposium on Biocomputing 4:392-400 (1999)
modules for new computational methods. One major advantage of AVS is the flexibility and extensibility that it provides to a significant number of scientists willing to modify existing networks or create new ones. AVS users roughly fall into three classes distributed in a pyramid. At the high end is the module programmer, typically writing C programs and making this code available as AVS modules. The second, and larger class of users, are those who produce their own networks using existing modules. Although networks do not have constructs for loops or conditional execution, many visualizations can be done at this level without writing a single line of code. The third, and largest class of users, are those who use their own data with an existing network. Molecular modeling and biomolecular visualization pose many challenging problems for dataflow environments. Molecules have high level of internal structure which must frequently be reproduced in the programs operating on them. This is not always compatible with the simple data-types typically available in these environments. Molecular modeling uses many different types of data, such as atom coordinates, atom types, charges, and other properties, bond connectivity, molecular surfaces, electron density maps, electrostatic potentials, etc. Molecular data include information of various dimensions such as scalar (e.g., charges, hydrophobicity), vectors (e.g., force fields, electric fields, normal mode vectors), or tensors (e.g., anisotropic temperature factors). The spatial location of these data may be at isolated points, on a two-dimensional surface, or within a three-dimensional volume. Moreover, these data can change with time. These needs have been addressed by several commercial and academic molecular modeling packages. However, most of these packages are monolithic programs providing only limited options for altering the style of the visualization or extending the program to accept new types of data or do new computations. Since they do provide a good environment for many well-defined tasks in molecular modeling, they are appropriate for the routine needs of many molecular modelers. However, part of the mission of the Olson laboratory at The Scripps Research Institute is to develop new methods for biomolecular visualization. For this purpose we have been using AVS for over ten years for analyses for which there are no well-suited packages. These include rapid prototyping, and visualization to support the development of new molecular computational approaches. Several programs developed in the Olson laboratory (e.g., AutoDock, Harmony, SURFDOCK), use AVS as an important tool to aid in software development. This approach has provided us with a high level of code re-usability achieved through a careful design of modules added to the basic modules available in AVS. One of the key advantages of AVS is that it provides an extensive set of tools for the analysis of three-dimensional data. Also, its rendering capability is of very high quality, allowing us to concentrate on other aspects of the visualiza-
Pacific Symposium on Biocomputing 4:392-400 (1999)
tion process. However, we have run into several limitations. The first, and perhaps the most important, is the relatively simple data types that can be passed between modules. Except for the geometry data type, which is a special case, these data are essentially self-describing arrays of numbers. This problem has been addressed in a new visualization product, AVS Express (AVS Inc.) where references to objects are passed between modules. This approach also prevents the duplication of data in each module. Unfortunately, AVS doesn’t provide high level functions handling these arrays in a uniform manner. Another AVS limitation is its lack of programmability. Most interaction with AVS is done using its graphical user interface (GUI); with the mouse, users select options, construct networks, transform objects, etc. Although AVS provides a command line interpreter (CLI) where the user can type commands to AVS, it is not a complete interpreter and does not have facilities for expressions, variable assignments, loop control, or functions. We have also found that turning computational methods into an AVS modules (wrapping) was only accessible to highly skilled programmers and was cumbersome because: (1) a computational method to be run in an AVS module has to be wrapped on every platform on which AVS is used; (2) the method, once wrapped, is “frozen” in the module and must be re-compiled for every platform every time the methods is modified, (3) and most importantly, the wrapped method can only be used within the AVS environment. 2
The Python programming language
Python is an object-oriented, interpreted, high-level language that became available in 1990. This simple, yet powerful language borrows features from several languages mainly ABC, C, Modula-3, and Icon. Its author put a large emphasis on readability, extensibility, and ease of programming and maintenance. The result is an elegant, concise, and easy-to-learn language that can be used by non-professional programmers for scripting purposes, and simplifies the design of large, well-structured, object-oriented applications. Like Java, Python uses a platform-independent byte code that can be executed on almost any computer. In fact, we and others [8] have experienced a higher degree of platform independence with Python than with Java. The source code and binaries for a wide variety of computers are available for free. The dynamic aspect of Python along with its ease of extension (in Python, C or C++) makes it a tool of choice for rapid prototyping. This is especially important for scientific research code where many rapidly evolving computational methods need to work together to solve a given problem. The fact that the language was designed from the beginning for extending and embedding in other applications is a crucial feature. A
Pacific Symposium on Biocomputing 4:392-400 (1999)
Python tutorial and detailed description are available on-line [6]. Python comes with a diverse library of standard extensions (some written in Python, others in C or C++) for operations ranging from string manipulations and Perl-like regular expression matching, to Graphical User Interface (GUI) generators and web-related utilities. In addition to these “standard” modules, which are part of the official distribution, there are other packages made available [6] by Python users including GADFLY, an SQL database manager written in Python; PIL, the Python imaging library; FNORB and OmniBorker, CORBA compliant Object Request Brokers (ORB) written in Python; Gendoc, an automated documentation tool; and Numeric Python. These extensions can be loaded interactively into the interpreter. Numeric Python is an extension module for efficient storage and manipulation of numeric data, and is a key element in maintaining reasonable performance in an interpreted environment. SWIG (http:// www.swig.org), (Simple Wrapper Interface Generator) is a tool to interface C and C++ libraries to Python and other interpreted languages like TCL, Perl and Guile. We call this process “wrapping” a library or a method. Using SWIG, we have wrapped a wide variety of computational tools from the molecular modeling field as well as others, such as computational geometry. In this process most of these tools gained in flexibility, but more importantly, they became inter-operable. This is important because it dramatically increases the number of computational pathways and method combinations we can apply for solving a problem while promoting code re-usability. Indeed, rather than making N tools compatible with each other, which requires N2 interfaces, we create an interface to Python for each of them, and once a tool is interfaced with Python it becomes inter-operable with other tools available in Python. Our extensions include methods for: ligand-receptor and protein-protein docking, molecular surface computation, spherical harmonic approximations of these surfaces, molecular mechanics and dynamics, electrostatic calculations, protein engineering, computational geometry tools, as well as several general-purpose extensions for I/O, manipulating and visualizing molecules, and building complex molecular assemblies. Some of these tools are based on programs that were developed within our laboratory, but others were obtained from other researchers. 3
The AVS-Python module
Python can be embedded into an application and used as an extension language, in the same way that Lisp can be used to extend the Emacs text editor. We have embedded a Python interpreter into an AVS module, thus enabling the use of AVS’s powerful dataflow environment to visualize and analyze results generated using our Python-based tools. This AVS module is unique because it does not
Pacific Symposium on Biocomputing 4:392-400 (1999)
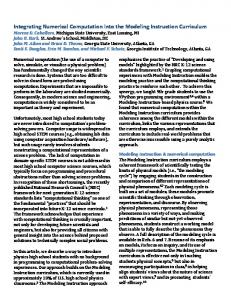
perform any particular task, but can be customized interactively to perform almost any task. The AVS-Python module contains a Python interpreter that has been extended to enable access to AVS’s C-API. Every time this module executes it will run a user-specified Python script. This script can be created with a text editor or the built-in, Tk-based [9] script editor (Fig 1). The module has a number of input and output ports for the data types supported by AVS. These ports can be made visible either programmatically or by using the module’s panel. Most of the functions of the AVS C-API are available from within the interpreter allowing Python scripts to read data from input ports, write data to output ports, check input ports for new data, construct AVS geometries, send CLI commands to the AVS kernel, show and hide parameters ports, customize widgets such as dials and sliders, and bind them to the module’s parameter. In addition to the AVS C-API, we have included a high level Python interface to the C-API, thus facilitating the development of Python scripts for the AVSpython module. 3.1
A simple example: A Field selection module
Let us illustrate how to create a new AVS module using the AVS-Python module. This module will extract from a field of data the elements specified by a field of integers, (e.g., the coordinates for a Cα-trace or the triangles of a partial surface) (Fig 1). To create this module we perform the following steps: 1 - Add an AVS-Python module to the network. 2 - Activate two input field ports (one for the data, one for the selection indices) and an output field port (for the result). This can be done using the IField1, IField2 and OField1 check-buttons in the module’s panel (Fig. 1). 3 - Create the Python script that will: (a) read the data and the selection indices from the two input ports, (b) extract the selected members of the data array, (c) send the result to the output port. Such a Python script is shown in Figure 1. The first line imports the “take” function from the Numeric Python extension. This function extracts from a Numeric array the members whose indices appear in the array given as the second argument. Lines 2 and 3 read the data from the “Field” input ports number 1 and 2. The GetField function is defined in the AVS-Python extension which is loaded automatically when the module is initialized. This function returns a numeric array of the shape (dimension) and type (e.g., double, float, int, short), of the incoming field. Line 4 performs the selection creating a new array which is sent to the first output field. Once this script is created and stored in a file, “select_field.py” for instance, this file can be bound to this module using the file browser. The module can then be packaged as an AVS macro-module named by the user and added to an AVS
Pacific Symposium on Biocomputing 4:392-400 (1999)
Module File
Input Ports Script Editor
Output Ports
Fig. 1: The AVS-Python module
module library. This new module was generated interactively, did not require any compilation, and will run on any platform for which the AVS-Python module is available. Moreover, a user can look at the Python script to see how it operates, modify it, or use it as a template to create a new module with a slightly different function. For instance, it would be trivial to add an integer parameter N defining the maximum length of the output array. This parameter could be connected to a widget like a dial or a slider in the macro’s panel allowing users to interactively change the value of N. 3.2
Integration of new computational methods
3.2.1 RAPID: efficient interference detection between 3D models RAPID, (Robust and Accurate Polygon Interference Detection), is a library to perform collision detection between triangulated objects [10]. This algorithm
Pacific Symposium on Biocomputing 4:392-400 (1999)
has direct applications in molecular modeling. For example, it can be used in interactive docking to detect bad contacts, or to monitor overlap during a conformational search). The RAPID API has two functions: one to build a model, and one to check for collisions between two models. These functions were wrapped with SWIG in a matter of minutes. Our first script only reported pairs of intersecting triangles. In order to visually verify the correctness of the result, we ran the same script in an AVS-Python module using AVS to highlight the intersecting triangles. In this case, AVS was used as a debugging tool. This method is now part of our toolkit and can be used in stand-alone Python-based applications as well as in AVS. We plan to use this method to implement simple CSG operations to compute volumes of objects’ overlaps, etc. 3.2.2 Interactive molecular surface reconstruction: MSMS, a program to efficiently compute molecular surfaces [11], was the first program that we interfaced to Python. Recently the MSMS library was extended with functions to recompute molecular surfaces interactively for moving molecular fragments [12]. A one-page Python script demonstrated graphically this capability in AVS. 3.2.3 A module for atom-based property iso-contours on a molecular surface: Several viewing programs have been written by various people in our laboratory, for instance to help debug MSMS and to visualize molecular surfaces together with the underlying moleFig. 2: surface subdivided according to cules. However, these prothe underlying amino acids grams all ended up being frozen with a set of functions that were never completely satisfactory. AVS has helped in this area, but exploring some new methods of visualization was often considered too difficult or just too much work. This is especially true in AVS for visualizations that require complex data structures that are present in different modules. A good example of this problem
Pacific Symposium on Biocomputing 4:392-400 (1999)
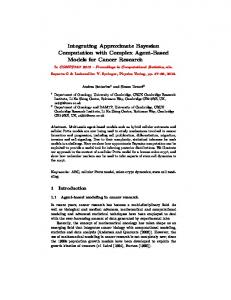
occurred for an idea of a representation to enhance a molecular surface by drawing outlines for the underlying residues (Fig 2). This requires knowledge of the molecule, the molecular surface, and the primitives used to display the surface. Using the AVS-Python module and the different extensions we have added to Python for reading molecules and computing surfaces, it was possible to prototype this type of visualization in a couple of hours. While doing this we realized the general usefulness of this operation and decided to transform this algorithm into a method of our surface class to extract iso-contours of vertex properties on arbitrary surfaces. We find that this type of representation helps understand a molecular surface without cluttering the image with too many graphics primitives. 3.2.4 Surface Decimation: simplified representation of molecular surfaces In our laboratory we have an interest in modeling molecular assemblies and other large systems such as viruses or even cellular environments. This requires simple geometric models to keep the number of triangles low enough to enable real time rendering. However, the objects in the scene should be recognizable. To achieve this task we use several techniques such as location-based texture mapping on coarse triangulated surfaces and spherical harmonic representations. Surface simplification is another technique to simplify geometric models while retaining their characteristic features. These features, however, are different for different simplification algorithms; some retain the overall shape better, losing high frequency details, while others retain critical features such as cusps. (Fig 3). The development of simplification algorithms is a field of active research Simplified
Original
Fig. 3
[13,14]. We obtained two programs implementing different simplification methods that are freely available on the Web, and wrapped them into Python, thus adding this functionality to our environment. These libraries have been wrapped
Pacific Symposium on Biocomputing 4:392-400 (1999)
using SWIG, meaning that new versions, if they use the same API, will be wrapped and compiled into a new shared object (dynamically loadable library) in a matter of minutes. This shared object is loaded into Python when these functions are needed. Therefore, all of our applications using these methods will automatically use the new versions by loading the new shared object. Figure 3 shows the solvent excluded surface of a small protein, crambin, (right) and the same surface after decimation (left) using the algorithm described in [13]. The original surface is made of 3219 vertices and 6434 triangles. The decimated surface is represented using only 1449 vertices and 2894 triangles. This corresponds a reduction of 55% of the number of geometric primitives with a minimal loss in accuracy. 3.2.5 TMV (tobacco mosaic virus): MD with symmetry constraints We are collaborating on a project to investigate the effect of mutations on the structure of the TMV helix. In order to simulate TMV, we chose to take into account the symmetry of the packing of TMV where every monomer interacts with 8 neighbors (Fig 4). In other words, every time an atom moves in TMV, the equivalent atom in the 8 neighbors has to do the same relative motion before energy is evaluated. We w e r e a b l e t o a c h i eve this using a mechanism we refer to as the callback mechanism. Basically, by adding a few lines of C-code to the inner loop of our molecular dynamics code we added the capability to register a Python function that will be called during the dynamics. We created a call-back function in Fig. 4: helical packing of 50 Python that is called TMV coat proteins after atoms assume new positions but before the energy and forces are evaluated in the molecular dynamics inner loop. This call-back function replicates the conformation of the central TMV monomer in its 8 neighbors, allowing us to introduce the symmetry constraint into the computation. Since the call-back function can be any Python function, it can be used to perform any kind of calculation, such as sta-
7
8
9
6
1
2
3
4
5
Pacific Symposium on Biocomputing 4:392-400 (1999)
tistics over ranges of atom motions, without having to modify the molecular dynamics program implemented in C. We found this feature extremely useful, and strive to add support for call-back functions to our Python extensions that have a CPU-intensive loop. The challenges here are to pick strategic locations for the call-back functions and their appropriate arguments. 4
Python versus other languages
One concern with interpreted languages is performance. We have found that for our applications, the CPU intensive part is in general a small portion of the code, usually just a few functions. The bulk of the code is for I/O, user interaction, setting up the computation, etc., which are not time-critical. Python is convenient for implementing these parts of an application, and the CPU intensive functions can be implemented in C or C++. A good example for this is our OpenGL 3D geometry viewer that is implemented in Python with the exception of a few key functions and the OpenGL extension module which are written in C. Our early experiments with interpreted languages used TCL and Perl. We feel that Python has advantages over these languages for achieving the level of software integration and re-use we are striving for. TCL’s most serious problem is its restricted set of data types. Also, we find its syntax awkward and difficult to remember. Perl is a powerful tool for writing use-once scripts, but its syntax is terse and does not prevent obfuscation. The simple and natural syntax of Python helps to make code readable by others: an important requirement for building large applications. Moreover, Python was designed from the beginning as an object-oriented language, unlike Perl and TCL. Finally, we feel that the fact that Python was not designed for specific application is an advantage because it is less likely to run into limitations due to a specific design. This is our main concern about approaches like MOE [15] based on a language (SVL) that was designed specifically for molecular modeling. Perhaps the major problem with interpreted languages comes from their dynamic nature which makes it difficult to anticipate all the ways and contexts in which a program will be used. Although one can write Python programs almost as easily as writing shell scripts, care must be taken to ensure that Python programs will work together properly. Conclusion We have presented an approach to extend the use of AVS for biomolecular computing and visualization using the Python language. Not only does this approach
Pacific Symposium on Biocomputing 4:392-400 (1999)
allow interactive generation and modification of platform-independent modules, but also creates a new class of AVS users who can create new modules without becoming expert programmers. Most computational chemists and biologists have some experience with scripting languages which is about the level of skill required to create or modify an AVS-Python script. Another key advantage of this approach is the high level of code re-use that is promoted by Python in general, and is extended to AVS through the AVS-Python module. Every computational method that is developed using Python or wrapped for Python becomes automatically available for use in the AVS environment, our tool of choice for visualization over the last ten years. High level of code re-use has enabled us to perform calculations and visualizations we wouldn’t have tried previously because they required too much code development. This approach has helped us merge our computation and visualization environments without creating a large monolithic program that would be difficult to maintain and extend. Acknowledgments The authors thank the Python Software Activity (PSA) for their support, and Dr. Garrett M. Morris for careful reading of the manuscript. This work was supported by grants NIH NCBR RR08065 and NSF CAACI-9619020. This is publication number 11785-MB from The Scripps Research Institute. References 1. 2. 3. 4. 5. 6. 7. 8. 9. 10. 11. 12. 13. 14. 15.
The RASMOL home page. http://www.umass.edu/microbio/rasmol MidasPlus. http://www.cgl.ucsf.edu/midasplus.html C. Upson et al. IEEE Comput. Graphics Appl. 9(4), 30-42. (1989). Visual Molecular Dynamics. http://www.ks.uiuc.edu/Research/vmd M. Lutz. Programming Python. O’Reilly & Assoc. (1996). The Python home page. http://www.python.org B. Duncan, T. Macke and A. Olson. J. Mol. Graphics. 13:271-282, 1995 SunWorld Online, February 1998, http://www.sunworld.com/swol-02-1998/swol-02python.html J. Osterhout. TCL and the Tk Toolkit. Addison-Wesley. (1994) Robust and Accurate Polygon Interference Detection. http://www.cs.unc.edu/~geom/OBB/OBBT.html M. Sanner, A. Olson and JC. Spehner. Biopolymers, 38:305-320 (1996) M. Sanner and A. Olson. PSB 1997. 385-396 (1997) M. Garland and P. Heckbert. SIGGRAPH Proc. 1997. 209-216. (1997) J. Cohen, et al. SigGraph Proc. 1996. 119-128. (1996) MOE. http://www.ioc.ac.ru/Chemistry/Soft/MOPERENV.en.html