Integrating Dynamic Pricing and Replenishment Decisions under Supply Capacity Uncertainty Qi Feng McCombs School of Business, The University of Texas at Austin, Austin, TX 78712
[email protected]
Last Revised: July 22, 2010
This paper examines an integrated decision-making process regarding pricing for uncertain demand and sourcing from uncertain supply, which are often studied separately in the literature. Our analysis of the integrated system suggests that the base stock list price policy fails to achieve optimality even under deterministic demand. Instead, the optimal policy is characterized by two critical values: a reorder point and a target safety stock. Under this policy, a positive order is issued if and only if the inventory level is below the reorder point. When this happens, the optimal order and price are coordinated to achieve a constant target safety stock, which aims at hedging the demand uncertainty. We further investigate the profit improvement obtained from deploying dynamic pricing, as opposed to static pricing. Our results indicate that either supply limit or supply uncertainty may induce a significant benefit from dynamic pricing, and the compound effect of supply limit and uncertainty can be much more pronounced than the individual effects. Whether or not the supply capacity is limited has a major implication on the value of dynamic pricing. Under unlimited supply, dynamic pricing is more valuable when procurement cost is high or when demand is more sensitive to price. With limited supply, however, the capacity restriction tends to be relaxed, reducing the value of dynamic pricing.
Electronic copy available at: http://ssrn.com/abstract=1652003
1
Introduction
The delicate balance of demand and supply to achieve profitability continues to be a pressing issue facing managers. Firms realize that pricing and inventory decisions are inextricably connected in influencing the dynamics of demand and supply. For example, a low price in the case of overstock typically allows for faster inventory turnover and reduced holding costs, and a high price in the case of stockout often alleviates the pressure of backlogging. Coordinating pricing and inventory decisions has become a major strategy for many firms, including Dell, Amazon, FairMarket, Land’s End, J. C. Penney, MSN Auction, and Grainger (Elmaghraby and Keskinocak 2003, Chan et al. 2005). New technologies also enable these firms to enjoy the benefit of dynamically adjusting prices to shape the market demand based on available stock. Nevertheless, it is commonly agreed that the deployment of a dynamic pricing strategy should be carefully justified against the increased cost and complexity in marketing-operation integration. Previous studies show that a fixed or static pricing policy performs efficiently in a stationary system with unlimited and reliable supply if the planning horizon is long, the inventory cost is low, or the demand is not highly variable (e.g., Federgruen and Heching 1999, Chan et al. 2005, Gimpl-Heersin et al. 2008). In an attempt to explain this phenomenon, economists have argued that holding and adjusting inventories help to absorb demand shocks, leading to price rigidity (e.g., Amihud and Mendelson 1983, Ashley and Orr 1985). These observations provide helpful guidance to managers to understand the economic implications of dynamic pricing, as opposed to static pricing, based on factors including cost structure, demand uncertainty, service level, and planning horizon. In practice, possible supply restrictions and risks are also essential considerations when formulating procurement policies. However, their impact has been overlooked in the analysis of combined pricing and procurement decisions. In recent years, there has been an increasing concern about supply uncertainty. The seemingly relentless force of globalization presents managers with extended supply chains and compounded supply risks. Managing supply uncertainty has become as important as managing demand uncertainty (Dada et al. 2007). The supply process is an immediate determinant of firms’ ability to maintain stock availability and capture market demand. Hence, supply uncertainty should be reflected not only in the procurement policy, but also in the pricing policy. Understanding the interconnections between pricing and replenishment decisions in the presence of supply uncertainty would provide valuable insights to practice. There are critical questions yet to be answered in this regard: How should pricing and procurement decisions be coordinated in systems with significant supply uncertainty? How should the integrated strategy be formulated according to system characteristics? How does
1 Electronic copy available at: http://ssrn.com/abstract=1652003
supply uncertainty influence the benefit of integrating pricing and procurement strategies? In the research community, issues concerning dynamic pricing and supply uncertainty have been extensively studied, but in separate contexts. We combine them in a multiperiod pricing and replenishment model with supply uncertainty. Specifically, we analyze a single item, periodic-review model. At the beginning of each period, the inventory level is reviewed. The manager needs to determine the replenishment order and the selling price for the current period before demand and supply uncertainties are resolved. The delivery quantity at the end of the period may turn out to be less than the order quantity due to supply uncertainty. Upon demand realization, leftover inventory is carried over to the next period, and unmet demand is fully backlogged. We capture the supply uncertainty using random capacity that represents the variable resource availability in the supply process. The consideration of capacity uncertainty leads to a major technical challenge of analyzing a dynamic program involving a multidimensional nonconcave objective function. A critical development from our analysis is to show the concavity of the optimal profit function obtained by simultaneously optimizing the price and quantity decisions. We also demonstrate that system optimality cannot be achieved by following a base-stock policy even in the special case of deterministic demand. This represents a distinct feature of our model compared to the ones studied previously. Note that a (modified) base-stock policy is optimal when the supply capacity becomes certain (Federgruen and Heching 1999, Chao et al. 2008) or when the price becomes exogenous (Ciarallo et al. 1994). We demonstrate that the optimal price and quantity decisions depend closely on the inventory level. A procurement order is triggered if and only if the inventory level is below a reorder point. Unlike the case of reliable supply (with unlimited or limited capacity), it is not always optimal to order up to the reorder point in the case of random supply. Instead, the optimal order-up-to level is lower than the reorder point whenever an order is issued. This is due to an attempt to reduce the uncertainty of the delivery quantity caused by supply uncertainty. Moreover, whenever the inventory level is below the reorder point, the optimal order quantity and price should be coordinated to achieve a constant target safety stock. This policy, representing a generalization of the base stock list price policy, appears new. We further extend a number of results obtained from previous studies by exploring the properties of the optimal policy with respect to system characteristics. In particular, we prove that a higher reorder point and a higher safety stock should be maintained in an earlier period than in a later period. Reducing the supply capacity impacts the optimal decisions the same way decreasing the holding cost or increasing the shortage cost does. It results in increased price and safety stock, and may lead to an increased or decreased order quantity. The effect of lowering the procurement cost resembles that 2
of increasing the potential market size or decreasing the price sensitivity of the demand. It induces increased order quantity and average demand, and may call for an increased or decreased safety stock. Understanding the optimal policy allows us to further investigate the value of deploying dynamic pricing, as opposed to static pricing, in our model. When supply is unlimited and reliable, a desired stock level can be maintained via a procurement order in each period. In this case, the optimal price is fairly rigid over time. When supply is limited or unreliable, however, it is not always possible to balance the inventory level over time via replenishment. The supply restriction constantly induces the risk of stockout, which can be mitigated by dynamically adjusting the price. As a result, dynamic pricing can yield a significant benefit especially when backordering demand is expensive or holding inventory is cheap. Whether the supply is limited or unlimited has a major impact on the pattern of price adjustment. The value of dynamic pricing diminishes over time under unlimited supply, while it accumulates over time under limited supply. We also find that when procurement cost is higher or demand is more sensitive to price, dynamic pricing yields a larger profit improvement over static pricing under unlimited supply. When supply is limited, however, these factors also lead to smaller order quantities, which in turn relax the capacity restriction and reduce the uncertainty of the delivery quantity. This means that the optimal procurement decision may successfully bring the stock level close to the desired level and thus balance the inventory level over time. As a result, the value of dynamic pricing becomes small. The remainder of the paper is organized as follows. In §2, we review the related literature and discuss our contributions. In §3, we formulate the dynamic program and analyze the optimal value function. In §4, we characterize the optimal policy and the impacts of model inputs on the policy behaviors. In §5, we examine the value of dynamic pricing under supply uncertainty. Finally, we conclude the study in §6 by summarizing our findings and pointing out future research directions. Proofs of formal results are relegated to the appendices.
2
Literature Review
This paper is related to two streams of literature. One stream deals with the coordination of pricing and inventory decisions under reliable supply, which dates back to Whitin (1955). Excellent surveys are provided by Elmaghraby and Keskinocak (2003), Yano and Gilbert (2003), and Chan et al. (2005). In this line of research, the demand model considered is either additive (in which the price only affects the location of the demand distribution) or multiplicative (in which the price only affects the scale of the demand distribution). For single-period problems, the discussions center around comparing
3
the optimal price to the riskless price, the optimal price when no uncertainty is present, under risk neutrality (Karlin and Carr 1962, Young 1978, Petruzzi and Dada 1999) or risk aversion (Agrawal and Seshadri 2000). For periodic-review systems, a base stock list price policy is shown to be optimal under a linear ordering cost (Federgruen and Heching 1999). When a fixed ordering cost is considered, Chen and Simchi-Levi (2004a, 2004b, 2006) prove that an (𝑠, 𝑆, 𝑝) or (𝑠, 𝑆, 𝐴, 𝑝) policy is optimal. Recently, Huh and Janakiraman (2008) identify an alternative set of conditions to establish the optimality of an (𝑠, 𝑆)-type policy for joint inventory-pricing problems. All of these studies consider unlimited and reliable supply. In contrast, we examine random supply capacity. A new policy is derived for our model, which represents a generalization of the base stock list price policy. It is worth mentioning that researchers have been interested in explaining price inflexibility, which suggests a fairly rigid price over time despite system changes. Several authors have shown that price inflexibility can be a result of profit-maximizing production and sales strategies. For example, Amihud and Mendelson (1983) study a model involving an additive demand noise and an additive production noise. They demonstrate that inventory adjustments can absorb variations in demand and supply processes, leading to the price smoothing effect. In particular, the range of optimal prices is smaller than that of feasible prices, and the optimal price response to the available inventory is milder than that implied by the demand function. They conclude that the existence of inventories dampens price fluctuations. In a related study, Ashley and Orr (1985) consider a variation of Amihud and Mendelson’s model with deterministic demand and lost sales. They also find that production smoothing can bring about price smoothing. A key difference between our model and theirs is that we capture supply uncertainty using a random capacity instead of an additive noise. Our results indicate that capacity limit and capacity uncertainty may restrict the firm’s procurement ability and induce significant price fluctuations over time. The second body of research related to our paper focuses on procurement strategies under unreliable supply. Most of these studies examine quality-related supply uncertainty, which is typically modeled as a stochastically proportional yield (Yano and Lee 1995). For periodic-review inventory systems with random yields, a well-known result is that the optimal order quantity is nonincreasing in the inventory level. Therefore, it is optimal to follow a reorder point policy (Henig and Gerchak 1990, Wang and Gerchak 1996). There are relatively few papers analyzing random supply capacity. When the price is exogenous, the presence of capacity uncertainty does not affect the optimality of a base-stock policy (Ciarallo et al. 1994). This is consistent with the observations from other inventory models in that incorporating capacity consideration does not have a fundamental impact on the structure of the optimal policy (see, e.g, Federgruen and Zipkin 1986𝑎, 1986𝑏). Our model is an exception because the base stock 4
list price policy stops being optimal due to the presence of random capacity. The papers by Li and Zheng (2006) and Chao et al. (2008) are the only ones considering both the pricing decision and supply uncertainty. They analyze the optimal policies for additive demand models without quantifying the value of pricing. Our study, in contrast, provides economic justification for incorporating dynamic pricing into procurement systems facing demand and supply uncertainties. Li and Zheng study a random yield model. They point out that firms should order more conservatively and price higher under random yield than under fixed yield. Very different observations are obtained from our random capacity model. We show that the optimal policy is monotone with respect to the average capacity level but not with respect to the variability of the capacity. Chao et al. (2008) consider a Markov-modulated capacity, which is observed before placing the corresponding order. They derive monotone properties of the optimal base stock and list price with respect to the inventory level and the observed capacity. Our analysis suggests that a different policy should be deployed when the capacity is observed only upon delivery.
3
Model Development and Analysis
In this section we present a dynamic programming formulation for the profit maximization problem that simultaneously optimizes the pricing and inventory decisions under both supply and demand uncertainties. We develop the model in §3.1 and present the analysis in §3.2. An important result established in this section is the concavity of the optimal value function, given that the objective function is not concave in the decision variables. This result allows us to derive analytical expressions of the optimal decisions, as well as to explore their structural properties in §4.
3.1
Problem Description
The manager faces a 𝑇 -period planning problem. To simplify the notation, we consider a system with stationary parameters over time. It should be noted that the results derived in this paper can be easily extended to nonstationary parameters (see Remark B.1 in Appendix B). At the beginning of period 𝑡, the (net) inventory level 𝐼𝑡 is reviewed. The manager needs to replenish for an uncertain demand 𝒟(𝑝𝑡 ), where 𝑝𝑡 is the unit selling price to be determined. The supply capacity 𝑘𝑡 is random with the distribution 𝐺(⋅). Due to the uncertainty associated with 𝑘𝑡 , if an order of 𝑞𝑡 = 𝑦𝑡 − 𝐼𝑡 is placed (where 𝑦𝑡 is the order-up-to level), the actual amount delivered is random. Both the price 𝑝𝑡 and the order 𝑞𝑡 must be determined before demand and supply uncertainties are resolved. The unmet demand is backordered and the leftover inventory is carried over to the next period.
5
The uncertain capacity, 𝑘𝑡 , represents the random resource availability level for providing the product. For example, the machines and equipment deployed for production may break down from time to time or deteriorate over time. The productivity level may fluctuate due to variations in worker skills or operating conditions. In the case of external sourcing, there may be a lack of information about the supplier’s production capability and workforce level. Even if the information is shared, the supplier is typically reluctant to reveal other buyers’ orders, which often have a major influence on the available supply capacity of the system under consideration. The manager pays 𝑐 dollars for each unit received. He also pays a surplus/shortage cost 𝐻(⋅) upon demand realization. We assume that 𝐻(⋅) ≥ 0 is continuous and convex. (Thus, 𝐻(⋅) has at most a finite number of non-differentiable points.) Also, 𝐻(0) = 0, lim𝑥→±∞ 𝐻(𝑥) = ∞, and ∣𝐻(𝑥1 ) − 𝐻(𝑥2 )∣ ≤ 𝑐𝐻 ∣𝑥1 − 𝑥2 ∣ for some positive and finite 𝑐𝐻 . A common example of 𝐻(⋅) in the literature is: 𝐻(𝑥) = ℎ𝑥+ + 𝑠𝑥− ,
(1)
where 𝑥+ = max{0, 𝑥} and 𝑥− = max{0, −𝑥}. For our subsequent analysis, we do not assume any specific form of 𝐻(⋅). The customer pays the current price 𝑝𝑡 upon the demand realization in period 𝑡. This price may not be the same as the price quoted at the time when he actually obtains the product if the demand is backordered. In other words, the delay in filling the demand does not affect the price charged directly. Instead, the manager pays a penalty cost for the backorder via 𝐻(⋅), which includes the loss of goodwill and compensation to the customer. Such a pricing scheme is widely used in examining joint pricing and replenishment decisions; see, e.g., Federgruen and Heching (1999) and Chen and Simchi-Levi (2004a, 2004b). For practical applications of this pricing scheme, refer to the discussions in Li and Zheng (2006). We consider an additive demand model, where the demand uncertainty is represented by an additive random noise 𝜔𝑡 : 𝒟𝑡 (𝑝𝑡 ) = 𝐷(𝑝𝑡 ) + 𝜔𝑡 , 𝑝𝑡 ∈ [𝑝, 𝑝].
(2)
We assume that 𝜔𝑡 has mean zero and support [𝜔, 𝜔]. For any feasible choice of 𝑝𝑡 ∈ [𝑝, 𝑝], the demand is positive with probability one and the average demand 𝐷(𝑝𝑡 ) is finite. The average demand 𝐷(𝑝𝑡 ) ≥ 0, 𝑝𝑡 ∈ [𝑝, 𝑝], has an inverse 𝑝(𝑑) that is decreasing over [𝑑, 𝑑], where 𝑑 = 𝐷(𝑝) and 𝑑 = 𝐷(𝑝).1 Thus, choosing an average demand 𝑑 is equivalent to charging a price 𝑝(𝑑). We shall impose 𝑝 = 𝑝(𝑑) > 𝑐 so that it is profitable to procure and sell the product for some feasible selling price. 1
Throughout this paper, we mean increasing and decreasing in the weak sense.
6
We also require the revenue 𝑅(𝑑) = 𝑑𝑝(𝑑) to be finite and concave for 𝑑 ∈ [𝑑, 𝑑]. This demand model has been discussed intensively in the context of pricing and procurement under reliable supply (e.g., Chen and Simchi-Levi 2004𝑎, 2004𝑏, 2006). We assume that {𝑘𝑡 } and {𝜔𝑡 } are independent sequences of independent and identically distributed random variables. Denote 𝑘 and 𝜔 to be the generic random components that have the same distributions as 𝑘𝑡 and 𝜔𝑡 , respectively. Now we can write the inventory dynamics for our problem, 𝐼𝑡+1 = 𝐼𝑡 + (𝑦𝑡 − 𝐼𝑡 ) ∧ 𝑘 − 𝑑 − 𝜔,
(3)
where 𝑎 ∧ 𝑏 = min{𝑎, 𝑏}. Let 𝑉𝑡 (𝐼) be the optimal profit function in period 𝑡 when the inventory level is 𝐼. Then, the optimality equation is given by 𝑉𝑡 (𝐼) =
max 𝑦≥𝐼,𝑑≤𝑑≤𝑑
𝐽𝑡 (𝐼; 𝑦, 𝑑) + 𝑐𝐼,
(4)
where 𝐽𝑡 (𝐼; 𝑦, 𝑑) = 𝑅(𝑑) − 𝑐E[(𝐼 + 𝑘) ∧ 𝑦] + E𝐿𝑡 ((𝐼 + 𝑘) ∧ 𝑦 − 𝑑), 𝐿𝑡 (Δ) = −E𝐻(Δ − 𝜔) + 𝛼E𝑉𝑡+1 (Δ − 𝜔),
(5) (6)
and 𝛼 ∈ [0, 1] is the discount factor. Without loss of generality, we also define a terminal condition 𝑉𝑇 +1 (𝐼) = 0 for finite horizon problems. Note that the analysis in this paper can be easily extended to infinite horizon problems, i.e., with 𝑇 = ∞. A standard dynamic programming argument suggests the existence of an optimal solution (see Theorem A.1 in Appendix A). We use 𝑞𝑡∗ (𝐼), 𝑦𝑡∗ (𝐼), 𝑑∗𝑡 (𝐼), and 𝑝∗𝑡 (𝐼) to denote, respectively, the optimal order quantity, order-up-to level, average demand, and price. Before characterizing the optimal policy, we need to explore some properties of the dynamic programming equation. This is done in the next subsection.
3.2
Concavity of the Optimal Profit Function
Ciarallo et al. (1994) consider a special case of our model in which 𝑝 is exogenously given so that 𝐷(𝑝) = 𝑑 = 𝑑 = 𝑑 is fixed. They demonstrate that the objective function is not concave in 𝑦 due to the consideration of random capacity. This implies that 𝐽𝑡 (𝐼; 𝑦, 𝑑) in (5) is not concave in (𝐼, 𝑦, 𝑑) in general. Therefore, the model defined in (4)-(6) is a two-decision, nonconcave dynamic optimization problem. 7
Theorem 1 The optimal profit function 𝑉𝑡 (𝐼) is concave in 𝐼 for each 𝑡. Theorem 1 is an important result that allows for further analytical exploration of the problem. Even though the objective function 𝐽𝑡 is not jointly concave, the optimal value function obtained by optimizing the procurement and pricing decisions is concave in the inventory level. In establishing Theorem 1, we first note that for a fixed 𝑑, the optimal order-up-to level2 𝑦˜𝑡 (𝑑) is independent of the inventory level 𝐼 (see Lemma A.1 in Appendix A). Furthermore, we recognize that the derived profit function 𝐽𝑡 (𝐼; 𝑦˜𝑡 (𝑑) ∨ 𝐼, 𝑑) is jointly concave in (𝐼, 𝑑) under the optimal inventory decision 𝑦˜𝑡 (𝑑) ∨ 𝐼, where 𝑎 ∨ 𝑏 = max{𝑎, 𝑏} (see Lemma A.2 in Appendix A). The concavity of 𝑉𝑡 (𝐼) then follows by an inductive argument. The derivation of Theorem 1 is very different from its counterpart in Ciarallo et al. (1994). In their model, the price is fixed and an optimal base-stock policy is derived immediately from the observation that 𝑦˜𝑡 (𝑑) does not depend on 𝐼. Subsequently, the concavity of the optimal value function follows in view of the simple decision structure. In an essential contrast, Theorem 1 is established without much knowledge of the optimal policy. We should also point out a major difference between our model and the one studied by Chao et al. (2008). They assume that the capacity is observed at the time of ordering. This assumption implies that the objective function in their model is jointly concave in the inventory level, the ordering quantity, and the price. Since the proof of Theorem 1 can be easily extended to the case when the capacity process is Markov modulated (see Remark B.1 in Appendix B), our result generalizes theirs in the sense that we allow the capacity to be random upon ordering. In the next section, we show that the modified base stock list price policy derived in their model is not always optimal in our model.
4
The Optimal Policy
In this section, we characterize the structure of the optimal policy and discuss its properties with respect to model parameters. This analysis also facilitates an understanding of the observations from our numerical experiments in §5.
4.1
Characterization of the Policy
When the supply capacity is fixed, a modified base stock list price policy is known to be optimal (Chao et al. 2008). However, it is not so for our problem involving random capacity in general. Before we characterize the optimal policy, it is helpful to understand whether the suboptimality of the base stock list price policy stems from supply uncertainty, demand uncertainty, or the combination of both. 2
We always choose the smallest optimizer if multiple exist.
8
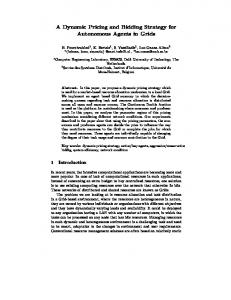
For that we consider a one-period example with deterministic demand in Figure 1. The case of fixed capacity (the dotted line) serves as a benchmark. In this case, it is optimal to order at the capacity level of 30 or up to the base-stock level of 32, depending on whether or not the capacity limit is reached. Thus, 32 is the ideal stock level if no supply restriction is imposed. Now we consider a random 𝑘 that may be 20 or 40 with equal probability (the solid line). In this case, the optimal policy is not always to order up to 32 or the maximum capacity 40. Instead, there are multiple order-up-to levels. Specifically, for 𝐼 ∈ (−24, 12), the optimal order quantity is less than 40 and the optimal order-up-to level is lower than 32. To see the intuition, we note that the delivery quantity, 𝜛(𝑞) = 𝑘 ∧ 𝑞, is random because of the random capacity, 𝑘. Reducing 𝑞 leads to a decreased of 𝜛(𝑞) in the dispersive order,3 which, in particular, suggests a decreased variance of 𝜛(𝑞). In other words, a lower 𝑞 induces smaller variability in the postdelivery stock level 𝐼 + 𝜛(𝑞). In the example in Figure 1, when an order of 𝑞 ∈ (20, 40) is placed, the delivery quantity is either 20 or 𝑞. The possible variation of the postdelivery stock level imposes a challenge to determining the appropriate price and leads to a reduced expected profit. It is thus desirable to keep 𝑞 closer to 20. (In the extreme case when 𝑞 = 20, the delivery quantity becomes deterministic.) As a result, the optimal order-up-to level for 𝐼 ∈ (−24, 12) is lower than 32. This example suggests that the base stock list price policy stops being optimal due to supply uncertainty.
k = 30 Pr{k = 20}= Pr{k=40}=0.5
Order 40
Order up to 16
Order 20
Order up to 32
Parameters: 𝑇 = 1, 𝑐 = 3, ℎ = 0.5, 𝑠 = 35, 𝐷(𝑝) = 70 − 2𝑝, and 𝜔 = 0.
Figure 1: The optimal decisions under deterministic demand. 3
Let 𝜛1 and 𝜛2 be two random variables with distributions Π1 (⋅) and Π2 (⋅), respectively. Let Π−1 and Π−1 denote 1 2 the right-continuous inverses of Π1 and Π2 , respectively. Then, 𝜛1 is said to be less than 𝜛2 in the dispersive order if −1 −1 −1 Π−1 1 (𝑏) − Π1 (𝑎) ≤ Π2 (𝑏) − Π2 (𝑎) whenever 0 < 𝑎 ≤ 𝑏 < 1. This also implies that 𝜛1 − E(𝜛1 ) is less than 𝜛2 − E(𝜛2 ) in the convex order, and thus the variance of 𝜛2 is higher than that of 𝜛1 .
9
For our problem, a new policy is needed to achieve optimality. Our task is then to identify the optimal policy. The fundamental principle of dynamic inventory management is to hedge the demand uncertainty via a proper trade-off between the overage and underage. An important measure reflecting this trade-off is the (projected) safety stock defined as Δ𝑡 = 𝑦𝑡 − 𝑑𝑡 . The quantity Δ𝑡 is the amount of inventory prepared in addition to the average demand. This additional amount of stock is intended to cover demand uncertainty. We note from (2) that the demand uncertainty is fully represented by 𝜔, which is independent of the procurement and pricing decisions. This implies that the corresponding safety stock should also be independent of the order quantity and the average demand. Define ˜ 𝑡 ≡ arg max{−𝑐Δ + 𝐿𝑡 (Δ)}. Δ Δ
(7)
˜𝑡 If the supply capacity were unlimited, it is easily seen that the optimal order-up-to level is 𝑑𝑡 + Δ ˜ 𝑡 represents the target safety stock. With an uncertain for any given average demand 𝑑𝑡 . Hence, Δ ˜ 𝑡 is projected because the post-delivery inventory level may be lower than capacity, the safety stock Δ the order-up-to level. We also define 𝑑˜ ≡ arg max {𝑅(𝑑) − 𝑐𝑑}.
(8)
𝑑∈[𝑑,𝑑]
If the demand is deterministic and the supply is unlimited, then it is optimal to purchase and sell 𝑑˜ ˜ is termed the riskless price in the literature. It units in every period. The corresponding price, 𝑝(𝑑), turns out that for our problem involving both demand and supply uncertainties, the optimal ordering ˜ 𝑡 and 𝑑˜ as indicated in the next Theorem. decision depends closely on Δ Theorem 2 In each period 𝑡, the optimal order quantity satisfies { > 0 if 𝐼 < 𝐼𝑡∗ 𝑞𝑡∗ (𝐼) = 0 if 𝐼 ≥ 𝐼𝑡∗ , ˜ 𝑡 is the optimal reorder point. where 𝐼𝑡∗ = 𝑑˜ + Δ Theorem 2 states that there is a single threshold, called a reorder point, that determines whether or not a positive order is issued. This observation suggests a simple order-triggering strategy that is easy to implement in practice. The optimal reorder point represents the ideal stock level, which ˜ 𝑡 prepared for the demand uncertainty. covers the riskless demand 𝑑˜ and the target safety stock Δ 10
The threshold policy is derived in Theorem 2 without specifying how the optimal order quantity responds to changes in the inventory level. Intuitively, when the inventory level increases, the order quantity should be reduced. This is formally stated in the next theorem. Theorem 3 The following relations hold for a small enough positive 𝛿. i) −𝛿 ≤ 𝑞𝑡∗ (𝐼) − 𝑞𝑡∗ (𝐼 − 𝛿) ≤ 0. ii) 0 ≤ 𝑦𝑡∗ (𝐼) − 𝑦𝑡∗ (𝐼 − 𝛿) ≤ 𝛿. iii) 0 ≤ 𝑑∗𝑡 (𝐼) − 𝑑∗𝑡 (𝐼 − 𝛿) ≤ 𝛿. ˜ 𝑡 when 𝐼 < 𝐼 ∗ , and 0 ≤ Δ∗ (𝐼) − Δ∗ (𝐼 − 𝛿) ≤ 𝛿 when 𝐼 ≥ 𝐼 ∗ (𝐼). iv) Δ∗𝑡 (𝐼) = Δ 𝑡 𝑡 𝑡 𝑡 Theorem 3 suggests how to coordinate the procurement and price decisions to achieve system optimality. When the inventory level increases, both the order-up-to level and the average demand should be increased at a magnitude smaller than the change of the inventory level. In particular, the optimal order-up-to level is lower than the reorder point (i.e., 𝑦𝑡∗ (𝐼) ≤ 𝑦𝑡∗ (𝐼𝑡∗ ) = 𝐼𝑡∗ for 𝐼 ≤ 𝐼𝑡∗ ). This is consistent with our observation in Figure 1. Also, the optimal average demand is lower than the riskless demand (i.e., 𝑑∗𝑡 (𝐼) ≤ 𝑑∗𝑡 (𝐼𝑡∗ ) = 𝑑˜ for 𝐼 ≤ 𝐼𝑡∗ ). This implies that the procurement risk is passed on to the customer via a high price. Furthermore, whenever an order is issued, the order quantity ˜ 𝑡. should be coordinated with the price to achieve the target safety stock, Δ The optimal policy described in Theorems 2 and 3 represents a generalization of the base stock list price policy (Federgruen and Heching 1999, Chao et al. 2008). When we set 𝑘 = ∞ in our model, the reorder point, 𝐼𝑡∗ , becomes the optimal base-stock level and the corresponding price, ˜ is the optimal list price. When the supply capacity is uncertain, a constant safety 𝑝∗𝑡 (𝐼𝑡∗ ) = 𝑝(𝑑), ˜ 𝑡 = 𝐼𝑡∗ − 𝑑˜ = 𝑦𝑡∗ (𝐼) − 𝑑∗𝑡 (𝐼), is preserved for inventory levels below the reorder point. However, stock, Δ the decisions 𝑦𝑡∗ (𝐼) and 𝑑∗𝑡 (𝐼) depend on the inventory level 𝐼, as demonstrated in Figure 1. In summary, we reiterate that the presence of capacity uncertainty has a fundamental impact on the optimal policy. When the supply is perfectly reliable, it is always optimal to follow a (modified) base-stock policy with (Federgruen and Heching 1999) or without (Federgruen and Zipkin 1986𝑎, 1986𝑏) the pricing decision. It is the supply uncertainty that induces the dependence of the optimal policy on the inventory level, because the base stock list price policy is not optimal even under deterministic demand (recall Figure 1).
4.2
Impact of Model Inputs
To obtain additional insights into the optimal policy, we analyze the responses of the optimal decisions to the changes of planning horizon, supply capacity, cost structure, and demand-price relation. 11
This analysis provides guidance regarding how the integrated pricing and inventory policy should be formulated according to system characteristics. For technical convenience, we impose two additional assumptions in this subsection. A1. The revenue function 𝑅(𝑑) is differentiable. A2. The random variable 𝜔 has a continuous distribution. Assumptions A1-2, together with 𝐻(⋅) being continuous and convex, ensure that the objective function of the dynamic programming equation is differentiable in the decision variables (Lemma B.1 in Appendix B). This allows us to derive the first-order conditions for the optimal decisions (Lemma B.2 in Appendix B). Theorem 4 The optimal policy satisfies the following relations. ′ (𝐼) for 𝐼 ≤ 𝐼 ∗ . i) 𝑉𝑡′ (𝐼) ≥ 𝑉𝑡+1 𝑡 ∗ ˜𝑡 ≤ Δ ˜ 𝑡−1 . and Δ ii) 𝐼𝑡∗ ≤ 𝐼𝑡−1
iii) 𝑑∗𝑡 (𝐼) ≥ 𝑑∗𝑡−1 (𝐼) for 𝐼 ≤ 𝐼𝑡∗ . When the supply is reliable and the price is exogenous, it is well known that the optimal basestock level decreases over time (see, e.g., Heyman and Sobel 1984, Federgruen and Zipkin 1986b). The premise is that a unit acquired in an earlier period has a better chance of being sold than one obtained in a later period. Theorem 4 represents a generalization of this result to problems involving uncertain supply and price-dependent demand. In particular, the marginal value of inventory in the current period is higher than that in the next period whenever replenishment is needed in the current period. This induces a higher reorder point and a higher safety stock in an earlier period than in a later period. For the same reason, the optimal policy tends to keep a lower demand in the earlier stage of the planning horizon. The next theorem generalizes another result obtained by Federgruen and Zipkin (1986a, 1986b), who find that the base-stock level decreases in capacity under deterministic supply and price-insensitive demand. Theorem 5 Consider two otherwise identical systems with 𝑘𝑎 smaller than 𝑘𝑏 in the stochastic order. The following relations hold. i) 𝑉𝑡𝑎′ (𝐼) ≥ 𝑉𝑡𝑏′ (𝐼). ii) 𝐼𝑡𝑎∗ ≥ 𝐼𝑡𝑏∗ . In particular, 𝐼𝑇𝑎∗ = 𝐼𝑇𝑏∗ . 12
𝑏∗ iii) 𝑑𝑎∗ 𝑡 (𝐼) ≤ 𝑑𝑡 (𝐼). 𝑏∗ iv) Δ𝑎∗ 𝑡 (𝐼) ≥ Δ𝑡 (𝐼).
When the capacity becomes lower in the stochastic sense, the marginal value of inventory increases. This is because the on-hand inventory becomes more valuable when the supply is more restricted. As a result, the reorder point becomes higher so that an order is more likely to be placed to hedge against possible future stockouts. Moreover, the average demand becomes lower and thus the customer pays a high price for supply scarcity. The supply capacity has an important implication on the inventory dynamics. To see that, we compute the inventory at the end of period 𝑡, ˜ 𝑡 ∧ (𝐼 + 𝑘 − 𝑑∗𝑡 (𝐼)) − 𝜔. 𝐼 + 𝑞𝑡∗ (𝐼) ∧ 𝑘 − 𝑑∗𝑡 (𝐼) − 𝜔 = Δ
(9)
The actual amount of stock available (the first term on the right-hand side) to cover the demand ˜ 𝑡 due to the supply capacity. A lower supply uncertainty (𝜔) is lower than the target safety stock Δ capacity induces a smaller surplus and a larger shortage in (9). This implies that the effect of reducing supply capacity is similar to that of decreasing surplus cost or increasing shortage cost, as stated in the next theorem. Theorem 6 Suppose that 𝐻(⋅) is given by (1). The following relations hold for two otherwise identical systems with ℎ𝑎 < ℎ𝑏 or 𝑠𝑎 > 𝑠𝑏 . i) 𝑉𝑡𝑎′ (𝐼) ≥ 𝑉𝑡𝑏′ (𝐼). ii) 𝐼𝑡𝑎∗ ≥ 𝐼𝑡𝑏∗ . 𝑏∗ iii) 𝑑𝑎∗ 𝑡 (𝐼) ≤ 𝑑𝑡 (𝐼). 𝑏∗ iv) Δ𝑎∗ 𝑡 (𝐼) ≥ Δ𝑡 (𝐼).
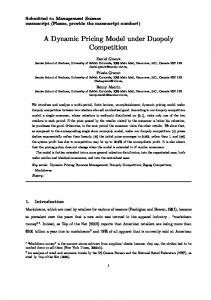
When ℎ increases or 𝑠 decreases, carrying inventory becomes relatively expensive compared to backordering demand. This, in turn, alleviates the capacity restriction, because stockouts due to limited capacity are less costly. As a result, a lower safety stock is maintained. Theorem 6 further suggests that a reduction of the safety stock is achieved by increasing the average demand rather than decreasing the order quantity. In fact, the order quantity may not change monotonically with respect to ℎ or 𝑠 as it does in models without capacity considerations. This is demonstrated via examples in Figure 2. When the inventory level is close to the reorder point (i.e., 𝐼 ∈ [30, 40]), a higher shortage cost leads to a larger 13
order quantity as intuition may suggest. We note that in this case, the order quantity is lower than the minimum capacity level of 10 so that the supply capacity is not a concern. For a lower inventory level (i.e., 𝐼 < 30), however, we observe a contrary result that the order quantity is smaller for a higher shortage cost. In this case, the order quantity is larger than 10 and the delivery quantity may be lower than the order quantity due to the random supply capacity. Recall from (9) that a capacity restriction induces stockout risk. When the shortage cost 𝑠 increases, it is desired to reduce the order quantity. This helps to keep the post-delivery stock level, 𝐼 + 𝑞𝑡∗ (𝐼) ∧ 𝑘, closer to the order-up-to level, 𝐼 + 𝑞𝑡∗ (𝐼), and thus reduce the stockout risk resulting from capacity restriction. q* ( I )
d * (I )
s=3 s=3 s =8 s =8
Parameters: 𝑇 = 1, 𝑐 = 2, ℎ = 1, 𝐷(𝑝) = 100 − 10𝑝, 𝜔 ∼ Normal(0, 1), 𝑃 𝑟{𝑘 = 10} = 0.6, 𝑃 𝑟{𝑘 = 20} = 0.3, and 𝑃 𝑟{𝑘 = 50} = 0.1.
Figure 2: The optimal decisions with respect to the shortage cost 𝑠. Compared to the shortage and surplus costs, the procurement cost impacts the optimal ordering decision in a different manner. This is stated in the next theorem. Theorem 7 The following relations hold for two otherwise identical systems with 𝑐𝑎 < 𝑐𝑏 : i) 0 ≤ 𝑉𝑡𝑏′ (𝐼) − 𝑉𝑡𝑎′ (𝐼) ≤ 𝑐𝑏 − 𝑐𝑎 . ii) 𝑞𝑡𝑎∗ (𝐼) ≥ 𝑞𝑡𝑏∗ (𝐼). 𝑏∗ 𝑎∗ 𝑏∗ iii) 𝑝𝑎∗ 𝑡 (𝐼) ≤ 𝑝𝑡 (𝐼) and 𝑑𝑡 (𝐼) ≥ 𝑑𝑡 (𝐼). 𝑎∗ 𝑏∗ 𝑎∗ 𝑏∗ 𝑏∗ iv) Δ𝑎∗ 𝑡 (𝐼) ≥ Δ𝑡 (𝐼) for 𝐼 ≤ 𝐼𝑡 and Δ𝑡 (𝐼) ≤ Δ𝑡 (𝐼) for 𝐼 ≥ 𝐼𝑡 .
The marginal value of inventory increases in the procurement cost 𝑐. This is because the on-hand inventory becomes more valuable when external sourcing is more expensive. As a result, the optimal order quantity and average demand decrease. However, their difference (i.e., the optimal safety stock) may increase or decrease. For a low inventory level, a positive order is issued. It is desirable to reduce 𝑏∗ ˜𝑖 the target safety stock (Δ𝑖∗ 𝑡 (𝐼) = Δ𝑡 , 𝑖 = 𝑎, 𝑏, for 𝐼 ≤ 𝐼𝑡 ) to avoid large orders, because procurement
14
is more expensive. When the inventory level becomes too high to order, the optimal safety stock 𝑎∗ 𝑖∗ (Δ𝑖∗ 𝑡 (𝐼) = 𝐼 − 𝑑𝑡 (𝐼), 𝑖 = 𝑎, 𝑏, for 𝐼 ≥ 𝐼𝑡 ) increases because the demand decreases as the selling price
is driven up by the increased cost. If the price is exogenous, the effect of an increased procurement cost resembles that of a decreased selling price. Such a connection can be generalized to the case of an endogenously determined price. For illustration, we consider a linear demand function widely studied in the literature. Theorem 8 Assume a linear demand function, i.e., 𝐷(𝑝) = 𝜍 − 𝛽𝑝 with 𝜍 > 0 and 𝛽 ≥ 0. The following relations hold for two otherwise identical systems with 𝜍 𝑎 > 𝜍 𝑏 or 𝛽 𝑎 < 𝛽 𝑏 . i) 𝑉𝑡𝑎′ (𝐼) ≥ 𝑉𝑡𝑏′ (𝐼). ii) 𝑞𝑡𝑎∗ (𝐼) ≥ 𝑞𝑡𝑏∗ (𝐼). 𝑏∗ 𝑎∗ 𝑏∗ iii) 𝑝𝑎∗ 𝑡 (𝐼) ≥ 𝑝𝑡 (𝐼) and 𝑑𝑡 (𝐼) ≥ 𝑑𝑡 (𝐼). 𝑎∗ 𝑏∗ 𝑎∗ 𝑏∗ 𝑏∗ iv) Δ𝑎∗ 𝑡 (𝐼) ≥ Δ𝑡 (𝐼) for 𝐼 ≤ 𝐼𝑡 and Δ𝑡 (𝐼) ≤ Δ𝑡 (𝐼) for 𝐼 ≥ 𝐼𝑡 .
Reducing the potential market size 𝜍 and increasing the price sensitivity 𝛽 reveal two similar effects on pricing. First, both indicate a reduced average demand 𝐷(𝑝) for any given price 𝑝. Second, both imply a stronger influence of the price on the market demand. The first effect leads to a decreased optimal price. Price reduction, similar to procurement cost increase, results in decreased order quantity, target safety stock, and average demand. The second effect implies an enhanced ability to adjust price, which, in turn, leads to a reduced marginal value of inventory.
5
Dynamic Pricing under Supply Uncertainty
A primary concern of integrating pricing and procurement decisions is whether the benefit is significant enough to justify the added complexity and intra-organizational coordination efforts. In this section, we quantify the value of dynamic pricing using our model. The goal of this analysis is twofold. First, we study the impact of random capacity on the benefit of deploying dynamic, as opposed to static pricing. Second, we attempt to understand the pattern of dynamic pricing with respect to system characteristics. In particular, we evaluate the percentage profit improvement, 𝜆=
𝑉𝑑−𝑉𝑠 × 100%, 𝑉𝑠
by comparing the optimal profits under dynamic (𝑉 𝑑 ) and static (𝑉 𝑠 ) pricing. The profit 𝑉 𝑑 is obtained by solving the dynamic program (4)-(6). To evaluate 𝑉 𝑠 , we first compute the long-term 15
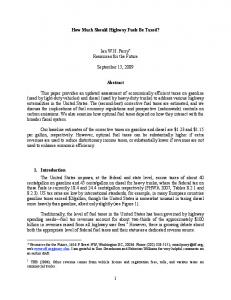
profit from the dynamic program (4)-(6) with any fixed 𝑑 for each 𝑡. This dynamic program is exactly the one solved by Ciarallo et al. (1994). Then, we optimize the long-term profit by choosing a proper value of 𝑑. It is straightforward to show that the long-term profit is concave in 𝑑 and thus the optimal static price can be uniquely determined. Previous studies suggest that a static pricing policy can efficiently manage a system with stationary parameters, low demand variability, or a long planning cycle (e.g., Amihud and Mendelson 1983, Deng and Yano 2006, Gimpl-Heersin et al. 2008). For example, Federgruen and Heching (1999) report a profit improvement of 0.46 − 2.24% under a five-period stationary setting when the coefficient of variation for demand is 0.75 − 1.4 and the supply is unlimited and reliable. They also point out that the improvement becomes very marginal as the planning horizon increases. To focus on the effects of random capacity, we consider stationary systems with a long planning horizon (𝑇 = 20) and a low demand uncertainty. We take 𝐻(𝑥) = ℎ𝑥+ + 𝑠𝑥− and 𝐷(𝑝) = 𝜍 − 𝛽𝑝 and set 𝜍 = 80, 𝛽 = 2, 𝛼 = 0.95, 𝑐 = 3, ℎ = 1, and 𝑠 = 15. The initial inventory is assumed to be zero. The demand component 𝜔 follows a normal distribution with mean zero and standard deviation 𝜎𝜔 = 4. (Correspondingly, the coefficient of variation of demand is approximately 0.108 when 𝑑𝑡 = 𝑑˜ = 37.) To ensure a nonnegative demand, we truncate the distribution of 𝜔 over the range [−4𝜎𝜔 , 4𝜎𝜔 ] and require the price to satisfy 0 = 𝑝 ≤ 𝑝𝑡 ≤ 𝑝 = (𝜍 − 4𝜎𝜔 )/𝛽. Effect of the capacity limit and uncertainty. In Figure 3, we plot the value of dynamic pricing against the maximum capacity limit 𝑘. The left panel depicts examples of all-or-nothing supply with a probability of no delivery being 𝑝𝑙 . In this case, 𝑝𝑙 represents the degree of supply unreliability. The right panel provides examples when the capacity follows a symmetric beta distribution. A common observation from Figure 3 is that the value of dynamic pricing first increases and then decreases as the maximum capacity 𝑘 increases. On the one hand, an extremely limited supply induces a very high price that can be very close to the maximum price 𝑝. This leaves little room for price adjustment and thus the value of dynamic pricing becomes negligible. With an ample capacity, on the other hand, there is a good chance to bring the stock level close to the desired level and thus the benefit of price adjustment may not be significant. We further note that in the case of fixed capacity (i.e., 𝑝𝑙 = 0), 𝜆 becomes zero when the capacity is large enough. In contrast, under random capacity, 𝜆 converges to some strictly positive value as 𝑘 becomes significantly large. Thus, both supply limit and supply uncertainty may significantly increase the value of dynamic pricing. Intuitively, the benefit from dynamic price adjustment would be increased by a less certain supply (i.e., when 𝑝𝑙 of the all-or-nothing capacity is closer to 0.5 or the variance of the beta capacity is 16
All-or-nothing capacity
Beta capacity a = b = 0.5
λ
λ
pl = 0.4
variance = 0.125
pl = 0.2
a = b =1
pl = 0
a = b = 1.5
variance = 0.083 variance = 0.0625
k
k
Parameters: 𝑇 = 1, 𝑐 = 3, ℎ = 0.5, 𝑠 = 15, 𝐷(𝑝) = 80 − 2𝑝, and 𝜔 ∼ 𝑁 𝑜𝑟𝑚𝑎𝑙(0, 4). For the all-or-nothing capacity, ∫ 𝑃 𝑟{𝑘 = 0} = 𝑝𝑙 = 1 − 𝑃 𝑟{𝑘 = ∞}. For the beta capacity, the density of 𝑘 is 𝑔(𝑘) = (𝑘 − 𝑘)𝑎−1 (𝑘 − 𝑘)𝑏−1 / 𝑘𝑘 (𝜅 − 𝑘)𝑎−1 (𝑘 − 𝜅)𝑏−1 d𝜅, 0 = 𝑘 ≤ 𝑘 ≤ 𝑘. The case of 𝑎 = 𝑏 = 1 corresponds to the uniform distribution. The density 𝑔(𝑘) is symmetrically convex when 0 < 𝑎 = 𝑏 < 1 and symmetrically concave when 𝑎 = 𝑏 > 1.
Figure 3: The impact of capacity limit on the value of dynamic pricing. larger). This is because the available stock level becomes more uncertain (recall our earlier discussion of Figure 1), and thus price adjustment becomes more useful to balance the inventory and maintain the target safety stock over time. While this is true in most situations, we observe exceptions under the all-or-nothing supply with a low maximum capacity. A low maximum capacity indicates a high price that can be very close to 𝑝, suggesting little room for price adjustment. Because the all-ornothing distribution is asymmetric (in contrast to the symmetric beta distributions), a decrease in supply reliability (i.e., an increase of 𝑝𝑙 ) leads to a decreased capacity (in the stochastic sense). This further drives the price up even closer to 𝑝. As a result, price adjustment becomes less flexible and dynamic pricing becomes less valuable for a larger 𝑝𝑙 . To derive further insights, we analyze the value and pattern of dynamic pricing with respect to system characteristics. Observations from Figure 3 suggest that we consider the following capacity specifications to isolate the effects of capacity limit and capacity uncertainty in our comparisons.4 ∙ Unlimited and unreliable capacity. When an order of 𝑞 is placed, the delivery quantity is 0 with probability 𝑝𝑙 = 0.4 and 𝑞 with probability 1 − 𝑝𝑙 . In this case, 𝑘 = ∞ and E𝑘 = ∞. ∙ Limited and reliable capacity. In this case, 𝑘 = 𝑘 = 𝑘 = 40. ∙ Limited and unreliable capacity. We choose a uniform distribution with 𝑘 = 0 and 𝑘 = 40. 4 Since the value of dynamic pricing is small for an extremely low or extremely high 𝑘, we focus on the intermediate range for the case of limited supply. In particular, we set 𝑘 = 40, which is slightly higher than the riskless demand 𝑑˜ = 37.
17
Major observations do not change when we use other distributions with finite mean. We also remark that when the capacity is unlimited and reliable, the value of dynamic pricing is negligible (recall Figure 3). Effect of the planning horizon. Under unlimited and reliable supply, the benefit of dynamic pricing quickly vanishes as the planning horizon extends (Federgruen and Heching 1999, Gimpl-Heersin et al. 2008) because the optimal base stock and list price converge to constants. This is confirmed by our earlier observation in Figure 3 that the value of dynamic pricing becomes zero in our experiments with a horizon of 𝑇 = 20 periods. In contrast, a system involving supply uncertainty may enjoy a long-term benefit of dynamic pricing as we observe from Table 1. Table 1: Impact of the planning horizon on the value of dynamic pricing. 𝑇 10 20 30 40 50
𝜆 1.48 1.21 1.13 1.09 1.07
𝑇 10 20 30 40 50
𝜆 0.12 0.13 0.13 0.13 0.13
𝑇 10 20 30 40 50
𝜆 14.9 16.6 16.9 17.0 17.1
𝑃 𝑟{𝑘 = 0} = 0.4 = 1 − 𝑃 𝑟{𝑘 = ∞} E𝑞𝑡∗ E𝑝∗𝑡 E𝛿𝑝∗𝑡 𝑛 %𝑛𝑢𝑝 % 54.9 23.58 1.41 9.0 56.3 % % 55.4 23.37 1.37 9.7 54.7 % % 55.6 23.30 1.35 11.4 54.9 % % 55.7 23.26 1.35 12.4 55.0 % % 55.8 23.24 1.34 13.1 55.0 %
% % % % %
E𝑞𝑡∗ 37.0 36.9 36.8 36.8 36.8
% % % % %
𝑘 E𝑞𝑡∗ 37.7 38.8 39.2 39.4 39.5
𝑘 = 40 E𝑝∗𝑡 E𝛿𝑝∗𝑡 21.71 0.24 21.67 0.23 21.66 0.23 21.66 0.22 21.66 0.22
𝑛 2.4 2.4 2.4 2.4 2.4
%𝑛𝑢𝑝 25.0 % 25.1 % 25.1 % 25.1 % 25.1 %
∼ 𝑈 𝑛𝑖𝑓 𝑜𝑟𝑚[0, 40] E𝑝∗𝑡 E𝛿𝑝∗𝑡 𝑛 30.24 1.69 4.5 30.13 1.63 7.3 30.09 1.62 9.2 30.07 1.61 10.5 30.05 1.60 11.3
%𝑛𝑢𝑝 39.5 % 45.2 % 47.1 % 48.0 % 48.5 %
E𝑞𝑡∗ = expected order quantity per period, E𝑝∗𝑡 = expected price over the planning horizon, E𝛿𝑝∗𝑡 = expected (absolute) price change per period, 𝑛(𝑛𝑢𝑝 ) = expected number of (upward) price adjustments.
In the case when the supply is unlimited and unreliable, the benefit of dynamic pricing decreases over time as in the case of unlimited and reliable supply. This is because a shortage experienced in an earlier period can be leveraged by large orders in later periods when the supply is unlimited. In contrast, a limited capacity (fixed or random) increases the value of dynamic pricing over time. The capacity restriction leads to the possibility of not being able to bring stocks to the desired level in each 18
period. When this happens, it is beneficial to adjust the price based on the stock level in that period. As a result, the value of dynamic pricing increases over time. Furthermore, we observe from Table 1 that a limited and unreliable capacity leads to a much higher value of 𝜆 than the other two types of capacities do. In other words, the compound effects of capacity limit and capacity uncertainty can be much more pronounced than their individual effects. A common observation from Table 1 is that the average price decreases and the average order quantity increases in the planning horizon. This is consistent with our discussion of Theorem 4 that a unit obtained earlier has a better chance to be sold. Furthermore, the frequency (i.e., 𝑛/(𝑇 − 1)) and the magnitude (i.e., E𝛿𝑝∗𝑡 ) of price adjustments decrease as 𝑇 increases. This implies that the optimal price should be adjusted more frequently and more dramatically when getting closer to the end of the horizon. Another interesting observation is that the capacity limit has a major impact on the direction of price adjustment. In particular, when the capacity is unlimited, the price is more likely to increase than to decrease (i.e., %𝑛𝑢𝑝 > 0.5). A limited capacity, however, calls for a higher frequency of price cut than price increase (i.e., %𝑛𝑢𝑝 < 0.5). Effect of the cost structure. Without considering supply capacity, Amihud and Mendelson (1983)5 demonstrate that the optimal price becomes less sensitive to the inventory level when the ability to replenish, hold inventory, or backorder demand increases. This, in turn, implies less price fluctuations over time. In our model with unlimited and reliable supply, the price smoothing effect is extremely strong, leading to a constant optimal list price. As a result, price fluctuations are completely eliminated for a long enough planning horizon. When the supply capacity is limited or uncertain, however, price fluctuations cannot be avoided and responses to cost-structure changes are very different from those observed by Amihud and Mendelson (see Table 2). When the procurement cost 𝑐 increases, the profit improvement 𝜆 and the magnitude of price adjustment E𝛿𝑝∗ increase under unlimited supply, while they decrease under limited supply. The intuition is as follows. When the order quantity is not restricted by a capacity limit, an increased procurement cost dampens the firm’s ability to replenish inventory. Price revision, in turn, becomes more useful. This is also consistent with the observation by Federgruen and Heching (1999) that inventory adjustment and price adjustment can substitute each other to achieve a high profit. Under 5
While they also consider supply uncertainty, their model is fundamentally different from ours. They include an additive random shock in production; that is, the delivery quantity is 𝑞 + 𝜖 for some random 𝜖. Since 𝜖 does not interact with the order quantity 𝑞, one can combine supply and demand shocks as 𝜔 − 𝜖 in the resulting inventory dynamics; that is, 𝐼𝑡+1 = 𝐼𝑡 + 𝑞 − 𝑑 − (𝜔 − 𝜖). In contrast, such a combination is not possible in our model because the random capacity 𝑘 restricts the delivery quantity.
19
limited supply, however, an increase in procurement cost leads to decreased order quantities (recall Theorem 7). This relaxes the capacity restriction and enhances procurement flexibility. Consequently, price adjustment is less useful. Table 2 further suggests that the pattern of price change is fairly consistent across the three scenarios. In particular, an increased procurement cost leads to a reduced frequency of price adjustment and a decreased likelihood of price increase. Table 2: Impact of the cost parameters on the value of dynamic pricing.
†
𝑐 1 2 3 4 5
𝑃 𝑟{𝑘 𝜆 1.08 % 1.15 % 1.21 % 1.28 % 1.35 %
= 0} = 0.4 = 1 − 𝑃 𝑟{𝑘 = ∞} E𝑞𝑡∗ E𝑝∗𝑡 E𝛿𝑝∗𝑡 𝑛 %𝑛𝑢𝑝 59.2 22.3 1.33 9.8 54.8 % 57.3 22.8 1.35 9.8 54.8 % 55.4 23.4 1.37 9.7 54.7 % 53.6 23.9 1.38 9.2 54.7 % 51.8 24.4 1.39 9.0 54.5 %
𝑐 1 2 3 4 5
𝜆 0.35 0.22 0.13 0.07 0.03
𝑐 1 2 3 4 5
𝜆 16.59 16.61 16.60 16.55 16.45
𝜋=
𝑘 = 40 E𝑝∗𝑡 E𝛿𝑝∗𝑡 20.9 0.45 21.3 0.34 21.7 0.23 22.1 0.15 22.6 0.09
𝜋† 0.8 0.85 0.9 0.95 0.99
𝑃 𝑟{𝑘 = 0} = 0.4 = 1 − 𝑃 𝑟{𝑘 = ∞} 𝜆 E𝑞𝑡∗ E𝑝∗𝑡 E𝛿𝑝∗𝑡 𝑛 %𝑛𝑢𝑝 0.2 % 57.6 22.6 0.61 7.0 52.9 % 0.3 % 57.0 22.8 0.81 6.4 52.9 % 0.6 % 56.3 23.1 1.09 9.7 54.8 % 2.6 % 54.2 23.8 1.71 10.2 53.7 % 46.0 % 52.2 24.4 2.24 10.3 54.9 %
% % % % %
E𝑞𝑡∗ 38.4 37.7 36.9 36.0 35.0
𝑛 4.9 3.3 2.4 1.7 1.4
%𝑛𝑢𝑝 33.9 % 29.4 % 25.1 % 20.8 % 16.1 %
𝜋 0.8 0.85 0.9 0.95 0.99
𝜆 0.07 0.08 0.10 0.17 0.50
% % % % %
𝑘 ∼ 𝑈 𝑛𝑖𝑓 𝑜𝑟𝑚[0, 40] E𝑞𝑡∗ E𝑝∗𝑡 E𝛿𝑝∗𝑡 𝑛 39.0 30.1 1.65 7.3 38.9 30.1 1.64 7.3 38.8 30.1 1.63 7.3 38.8 30.1 1.63 7.3 38.7 30.1 1.62 7.3
%𝑛𝑢𝑝 45.2 % 45.2 % 45.2 % 45.2 % 45.2 %
𝜋 0.8 0.85 0.9 0.95 0.99
𝜆 7.9 % 10.0 % 13.4 % 20.1 % 32.5 %
𝑠−(1−𝛼)𝑐 . ℎ+𝑠
% % % % %
E𝑞𝑡∗ 36.9 36.9 36.9 36.8 36.7
𝑘 = 40 E𝑝∗𝑡 E𝛿𝑝∗𝑡 21.6 0.17 21.6 0.19 21.7 0.22 21.7 0.24 21.8 0.32
𝑛 2.2 2.2 2.3 2.4 2.5
%𝑛𝑢𝑝 30.1 % 28.2 % 26.8 % 24.3 % 20.5 %
𝑘 ∼ 𝑈 𝑛𝑖𝑓 𝑜𝑟𝑚[0, 40] E𝑞𝑡∗ E𝑝∗𝑡 E𝛿𝑝∗𝑡 𝑛 39.1 30.0 1.41 14.6 39.0 30.0 1.51 13.2 38.9 30.1 1.61 11.6 38.8 30.2 1.64 5.8 38.3 30.3 1.58 1.2
%𝑛𝑢𝑝 49.0 % 48.2 % 47.0 % 44.7 % 42.8 %
We change 𝑠 with ℎ and 𝑐 fixed. The results are similar when we change ℎ with 𝑐 and 𝑠 fixed.
The ratio 𝜋 represents the optimal service level (i.e., the probability of meeting demand) of a system with unlimited and reliable supply. A larger value of 𝜋 indicates that backlogging demand is more expensive and carrying inventory is less costly. We observe from Table 2 that the average order quantity decreases and the average price increases in 𝜋. This is consistent with our earlier discussions of Theorem 6 and Figure 2. We further note from Figure 2 that the decrease of average demand due to an increased shortage cost is smaller for a higher inventory level. This is because the concern for shortage is reduced as the inventory level increases. As a result, the average demand (and thus the price) is more sensitive to the inventory level as backordering demand becomes more costly. In other words, adjusting price based on stock level is more useful for a larger 𝜋. Table 2 also suggests that the value of dynamic pricing increases dramatically as 𝜋 approaches one. In other words, firms offering high service levels should dynamically coordinate price and inventory decisions.
20
Effect of the price-demand relation. Intuitively, it would be more beneficial to implement a dynamic pricing policy when the demand is more price sensitive (i.e., 𝛽 is larger). This is confirmed by Federgruen and Heching (1999) in their study of systems with unlimited and reliable supply. To our surprise, this is not always true when the supply is limited. From Table 3, we observe that 𝜆 may decrease in 𝛽 when the capacity is fixed at 40. Such a phenomenon is explained by the fact that both the order quantity and the average demand decrease in 𝛽 (recall Theorem 8). In other words, an increased 𝛽 relaxes capacity restrictions. The optimal base-stock level is more likely to be reached via a procurement order and thus the need to adjust the price is reduced. Table 3: Impact of the price-demand relation on the value of dynamic pricing. 𝛽 1 2 3 4 5
𝑃 𝑟{𝑘 = 0} = 0.4 = 1 − 𝑃 𝑟{𝑘 = ∞} 𝜆 E𝑞𝑡∗ E𝑝∗𝑡 E𝛿𝑝∗𝑡 𝑛 %𝑛𝑢𝑝 0.3 % 61.0 43.4 1.46 9.6 54.9 % 1.2 % 55.4 23.4 1.37 9.7 54.7 % 3.2 % 50.0 16.7 1.32 9.7 52.0 % 7.2 % 44.5 13.3 1.30 10.6 52.4 % 13.7 % 40.4 11.1 1.12 8.4 53.3 %
𝜁 50 60 70 80 90
𝑃 𝑟{𝑘 = 0} = 0.4 = 1 − 𝑃 𝑟{𝑘 = ∞} 𝜆 E𝑞𝑡∗ E𝑝∗𝑡 E𝛿𝑝∗𝑡 𝑛 %𝑛𝑢𝑝 3.80 % 30.9 15.7 1.26 8.6 53.9 % 2.40 % 38.9 18.3 1.34 9.5 54.6 % 1.65 % 47.2 20.9 1.35 9.6 54.7 % 1.21 % 55.4 23.4 1.37 9.7 54.7 % 0.93 % 63.9 25.9 1.38 9.6 55.0 %
𝛽 1 2 3 4 5
𝜆 0.17 0.13 0.07 0.03 0.01
𝑘 = 40 E𝑝∗𝑡 E𝛿𝑝∗𝑡 42.1 0.61 21.7 0.23 14.9 0.09 11.5 0.03 9.5 0.01
𝛽 1 2 3 4 5
𝜆 10.5 16.6 20.3 22.1 22.2
𝑘 = 40 E𝑝∗𝑡 E𝛿𝑝∗𝑡 14.0 – 16.5 – 19.0 – 21.7 0.23 25.3 0.79
% % % % %
E𝑞𝑡∗ 38.2 36.9 35.5 34.1 32.5
𝑛 4.5 2.4 1.5 1.2 0.1
%𝑛𝑢𝑝 32.7 % 25.1 % 17.7 % 12.0 % 49.9 %
𝜁 50 60 70 80 90
𝜆 0% 0% 0% 0.13 % 0.84 %
E𝑞𝑡∗ 22.1 27.2 32.2 36.9 39.7
𝑛 – – – 2.4 15.4
%𝑛𝑢𝑝 – – – 25.1 % 44.4 %
% % % % %
𝑘 ∼ 𝑈 𝑛𝑖𝑓 𝑜𝑟𝑚[0, 40] E𝑞𝑡∗ E𝑝∗𝑡 E𝛿𝑝∗𝑡 𝑛 39.1 60.2 2.89 12.8 38.8 30.1 1.63 7.3 38.6 20.1 1.16 5.9 38.1 15.1 0.91 5.1 36.9 12.1 0.75 4.6
%𝑛𝑢𝑝 46.9 % 45.2 % 45.3 % 45.5 % 46.0 %
𝜁 50 60 70 80 90
𝜆 8.8 % 13.7 % 15.9 % 16.6 % 16.5 %
𝑘 ∼ 𝑈 𝑛𝑖𝑓 𝑜𝑟𝑚[0, 40] E𝑞𝑡∗ E𝑝∗𝑡 E𝛿𝑝∗𝑡 𝑛 29.0 16.3 0.97 6.2 36.0 20.5 1.31 6.8 38.3 25.2 1.51 7.1 38.8 30.1 1.63 7.3 39.1 35.1 1.73 7.5
%𝑛𝑢𝑝 48.3 % 46.1 % 45.2 % 45.2 % 45.3 %
When the market expands (i.e., 𝜁 increases), a certain degree of price change has a reduced impact on the market demand. This explains a decreased value of dynamic pricing under unlimited supply observed from Table 3. A limited supply, however, becomes more stringent for a larger market because of the need for larger orders (recall Theorem 8). Price adjustment, in turn, becomes more useful. This is also reflected by the observation that the average price E𝑝∗𝑡 and the magnitude of price change E𝛿𝑝∗𝑡 are more sensitive to 𝜍 under limited supply than under unlimited supply. The average order quantity E𝑞𝑡∗ , however, is more sensitive to 𝜍 under unlimited supply than under limited supply. In other words, the capacity restriction dampens the ability to adjust inventory in response to the expanded market size. Consequently, the value of dynamic pricing may increase in 𝜍 under limited 21
supply. The pattern of price change with respect to an increased 𝛽 or a decreased 𝜍 is fairly consistent across the three scenarios. In particular, the magnitude of price adjustments decreases because the influence of price adjustment on the demand is enhanced.
6
Concluding Remarks
This paper examines a dynamic price-inventory planning problem under supply uncertainty. Our model illustrates how the interaction between pricing and quantity decisions impacts system performance. From a theoretical perspective, our study leads to an interesting development of a nonconcave dynamic programming model. We derive the optimal policy and analyze its properties with respect to system characteristics. This policy, featuring a reorder point and a target safety stock, represents a generalization of the base stock list price policy. Earlier studies of systems with unlimited and reliable supply report strong price smoothing effects when firms have a long planning horizon, a strong ability to hold inventory and backorder demand, or a low procurement cost. Our analysis, in contrast, suggests that, in the presence of either supply limit or supply uncertainty in such systems, firms may derive significant profit improvements by deploying dynamic pricing strategies. Moreover, the combined effects of supply limit and uncertainty on the value of dynamic pricing can be much more pronounced than the individual effects. We also demonstrate that the maximum supply capacity has a major impact on the value of dynamic pricing. Under unlimited supply, the profit improvement obtained from dynamic pricing decreases as procurement cost declines or as the price sensitivity of demand decreases. Under limited supply, however, these factors increases capacity restrictions and may induce an increased value of dynamic pricing. Our analysis further suggests that firms with limited supply can enjoy long-term benefits from dynamic pricing. Next, we discuss a number of extensions for our model. In practice, the observation of the current capacity or demand may have a direct implication on the supply or demand process in the near future. This can be easily incorporated into our model using Markov-modulated processes. Major results derived from our model continue to hold under Markovian demand and supply, even though the problem becomes computationally more complex due to increased dimensionality. We have assumed the flexibility of adjusting both inventory and price in each period. In practice, the replenishment cycle and the price-revision cycle may not coincide due to various restrictions. Such a situation can be modeled by including the previous price 𝑑𝑡−1 (𝐼) = 𝑑 as an additional state. Whenever the quantity or price adjustment is not allowed, a constraint 𝑞𝑡 (𝐼) = 0 or 𝑑𝑡 (𝐼) = 𝑑,
22
respectively, is imposed for that period. It is easy to check that the formal results obtained in our model continue to hold with these modifications. We have restricted our discussions to an additive demand model (i.e., the price only affects the location parameter of the demand distribution). This model applies to brand products whose demand uncertainties come mainly from forecast errors (Agrawal and Seshadri 2000). For products with low brand recognition, a multiplicative demand model (i.e., the price only affects the scale parameter of the demand distribution) is often used. Our proof of the concave value function can be easily generalized to this demand model. However, the optimal policy may be fairly complex and reveal nonintuitive behaviors (see Remark B.2 in Appendix B). The problem analyzed in this paper can be further explored in a number of directions. For example, the current model can be extended to include multiple suppliers. An interesting aspect in the context of multiple sourcing is the interaction between a dynamic pricing policy and a supplier diversification strategy. Also, supply lead time is an important determinant of a firm’s supplier portfolio that has not been addressed in the literature. Understanding how the combined pricing and procurement decisions are affected by supply lead time would provide useful insights to practice.
Appendices A
Preliminary Analysis
Theorem A.1 For each 𝑡, the following results holds. i) The objective function 𝐽𝑡 (𝐼; 𝑦, 𝑑) is continuous in (𝐼, 𝑦, 𝑑) and the optimal profit function 𝑉𝑡 (𝐼) is continuous in 𝐼 for each 𝑡. ii) The optimal profit function 𝑉𝑡 (𝐼) > −∞ and lim𝐼→±∞ 𝑉𝑡 (𝐼) = −∞. iii) For each 𝐼 and 𝑑 ∈ [𝑑, 𝑑], there exists a finite upper bound on the optimal 𝑦 that maximizes 𝐽𝑡 (𝐼; 𝑦, 𝑑). Proof. Part i) follows from a simple inductive argument together with the fact that the one-period profit is continuous in (𝐼, 𝑦, 𝑑). To see part ii), we note that for a fixed 𝑝 ∈ [𝑝, 𝑝], 𝑉𝑡 (𝐼) ≥
𝑇 ∑
𝛼𝑠−𝑡 𝑅(𝐷(𝑝)) − E𝐻
𝑠=𝑡
≥
𝑇 ∑ 𝑠=𝑡
𝑠−𝑡
𝛼
[
[
(
𝐼−
𝑠 ∑ 𝑛=𝑡
)]
𝒟𝑡 (𝑝)
] 𝑠 ∑ 𝑅(𝐷(𝑝)) − E𝑐 𝐼 − 𝒟𝑡 (𝑝) > −∞. 𝐻
𝑛=𝑡
23
The first inequality follows from the fact that the optimal profit in period 𝑡 is no less than the profit earned by charging a fixed price 𝑝 and ordering nothing over the periods 𝑡 to 𝑇 . The second inequality follows from the assumption that ∣𝐻(𝑥1 ) − 𝐻(𝑥2 )∣ ≤ 𝑐𝐻 ∣𝑥1 − 𝑥2 ∣. The last inequality follows from the assumption that 𝐷(𝑝) = E𝒟𝑡 (𝑝) is finite for each 𝑝. The result that lim𝐼→±∞ 𝑉𝑡 (𝐼) = −∞ follows directly from the assumption that lim𝐼→±∞ 𝐻(𝐼) = ∞. Thus, we have proved part ii). Finally, part iii) follows immediately from ii).
□
Lemma A.1 (Ciarallo et al. 1994) Let Γ(⋅) be a concave function and 𝑦˜(𝑑) be the smallest maximizer of 𝜙(𝑦, 𝑑) = −𝑐𝑦 + Γ(𝑦 − 𝑑) for a given 𝑑. Then, 𝑦˜(𝑑) also maximizes 𝜑(𝐼, 𝑦, 𝑑) = −𝑐E[𝑦 ∧ (𝐼 + 𝑘) − 𝐼] + EΓ(𝑦 ∧ (𝐼 + 𝑘) − 𝑑). for any given 𝐼. Proof.
This result has been established by Ciarallo et al. (1994). Here we provide an alternative
proof which generalizes theirs by allowing for a possibly non-differentiable 𝜙. It is easily seen that 𝜙(𝑦, 𝑑) is jointly concave in (𝑦, 𝑑), and therefore 𝜙(𝑦, 𝑑) is increasing in 𝑦 for 𝑦 ≤ 𝑦˜(𝑑) and decreasing in 𝑦 for 𝑦 > 𝑦˜(𝑑). The result follows if we can show that 𝜑(𝐼, 𝑦, 𝑑) is increasing (decreasing) in 𝑦 whenever 𝜙(𝑦, 𝑑) is increasing (decreasing) in 𝑦. Consider 𝑦 < 𝑦˜(𝑑). Let 𝛿 be a small enough positive number. We must have 𝜙(𝑦, 𝑑) ≤ 𝜙(𝑦 + 𝛿, 𝑑). Also, for each realization of 𝑘, 𝑦 ∧ (𝐼 + 𝑘) ≤ (𝑦 + 𝛿) ∧ (𝐼 + 𝑘) ≤ 𝑦˜(𝑑) . By the concavity of 𝜙, we obtain 𝜙(𝑦 ∧ (𝐼 + 𝑘), 𝑑) ≤ 𝜙((𝑦 + 𝛿) ∧ (𝐼 + 𝑘), 𝑑) for each 𝑘. Then, 𝜑(𝐼, 𝑦, 𝑑) = 𝑐𝐼 + E𝜙((𝑦 ∧ (𝐼 + 𝑘), 𝑑) ≤ 𝑐𝐼 + E𝜙((𝑦 + 𝛿) ∧ (𝐼 + 𝑘), 𝑑) = 𝜑(𝐼, 𝑦 + 𝛿, 𝑑). Thus, 𝜑(𝐼, 𝑦, 𝑑) is nondecreasing in 𝑦 when 𝑦 < 𝑦˜(𝑑). A similar argument can be applied to show that 𝜑(𝐼, 𝑦, 𝑑) is nonincreasing in 𝑦 when 𝑦 > 𝑦˜(𝑑). Hence, 𝑦˜(𝑑) maximizes 𝜑(𝐼, 𝑦, 𝑑).
□
Lemma A.2 Let 𝑦˜(𝑑) and 𝜑 be defined as in Lemma A.1. Then 𝜑(𝐼, 𝑦˜(𝑑) ∨ 𝐼, 𝑑) is jointly concave in (𝐼, 𝑑).
24
Proof. Define 𝑦¯(𝐼, 𝑑) = 𝑦˜(𝑑) ∨ 𝐼. For a given realization of 𝑘, let 𝜋𝑘 (𝐼, 𝑑) = 𝑐𝐼 + 𝜙(¯ 𝑦 (𝐼, 𝑑) ∧ (𝐼 + 𝑘), 𝑑). From Lemma A.1, we deduce that for a given 𝑑, 𝑦 = 𝑦¯(𝐼, 𝑑)∧(𝐼 +𝑘) maximizes 𝜙(𝑦, 𝑑) for 𝑦 ∈ [𝐼, 𝐼 +𝑘]. We first prove that 𝜋𝑘 (𝐼, 𝑑) is jointly concave in (𝐼, 𝑑) for each 𝑘. ¯ 2 and 𝑑𝜃 = 𝜃𝑑1 + 𝜃𝑑 ¯ 2 . We Take (𝐼1 , 𝑑1 ), (𝐼2 , 𝑑2 ), and 𝜃 ∈ [0, 1] with 𝜃¯ = 1 − 𝜃. Let 𝐼𝜃 = 𝜃𝐼1 + 𝜃𝐼 have ¯ 𝑘 (𝐼2 , 𝑑2 ) ≤ 𝑐𝐼𝜃 + 𝜙(𝜃(¯ ¯ 𝑦 (𝐼2 , 𝑑2 ) ∧ (𝐼2 + 𝑘)), 𝑑𝜃 ) 𝜃𝜋𝑘 (𝐼1 , 𝑑1 ) + 𝜃𝜋 𝑦 (𝐼1 , 𝑑1 ) ∧ (𝐼1 + 𝑘)) + 𝜃(¯ ≤ 𝑐𝐼𝜃 + 𝜙(¯ 𝑦 (𝐼𝜃 , 𝑑𝜃 ) ∧ (𝐼𝜃 + 𝑘), 𝑑𝜃 ). The first inequality follows from the concavity of 𝜙, and the second inequality comes from the observation that 𝑦 = 𝑦¯(𝐼𝜃 , 𝑑𝜃 ) ∧ (𝐼𝜃 + 𝑘) maximizes 𝜙(𝑦, 𝑑𝜃 ) for 𝑦 ∈ [𝐼𝜃 , 𝐼𝜃 + 𝑘]. It is important to note that in applying the optimality argument to the second inequality, we must also verify that ¯ 𝑦 (𝐼2 , 𝑑2 ) ∧ (𝐼2 + 𝑘)) is within the range of [𝐼𝜃 , 𝐼𝜃 + 𝑘]. This is done by 𝜃(¯ 𝑦(𝐼1 , 𝑑1 ) ∧ (𝐼1 + 𝑘)) + 𝜃(¯ recognizing that ¯ 𝑦 (𝐼2 , 𝑑2 ) ∧ (𝐼2 + 𝑘)) ≥ 𝜃(𝐼1 ∧ (𝐼1 + 𝑘)) + 𝜃(𝐼 ¯ 2 ∧ (𝐼2 + 𝑘)) 𝜃(¯ 𝑦 (𝐼1 , 𝑑1 ) ∧ (𝐼1 + 𝑘)) + 𝜃(¯ ¯ 2 = 𝐼𝜃 , = 𝜃𝐼1 + 𝜃𝐼 ¯ 𝑦 (𝐼2 , 𝑑2 ) ∧ (𝐼2 + 𝑘)) ≤ 𝜃(𝐼1 + 𝑘) + 𝜃(𝐼 ¯ 2 + 𝑘) 𝜃(¯ 𝑦 (𝐼1 , 𝑑1 ) ∧ (𝐼1 + 𝑘)) + 𝜃(¯ = 𝐼𝜃 + 𝑘. Thus, we have shown that 𝜋𝑘 (𝐼, 𝑑) is jointly concave in (𝐼, 𝑑). It follows that 𝜑(𝐼, 𝑦˜(𝑑) ∨ 𝐼, 𝑑) = E𝑘 𝜋𝑘 (𝐼, 𝑑) is jointly concave in (𝐼, 𝑑).
□
Lemma A.3 Let 𝑦˜(𝑑) and 𝜑 be defined as in Lemma A.1. Then 𝜑(𝐼, 𝑦˜(𝑑) ∨ 𝐼, 𝑑) is supermodular in (𝐼, 𝑑). ˜ be the smallest maximizer of Proof. We first note that 𝜙(𝑦, 𝑑) = −𝑐(𝑦 − 𝑑) + Γ(𝑦 − 𝑑) − 𝑐𝑑. Let Δ ˜ + 𝑑. Then, −𝑐Δ + Γ(Δ). It is easy to see that 𝑦˜(𝑑) = Δ ˜ ∨ 𝐼 ∧ (𝐼 + 𝑘) − 𝐼] + EΓ[(𝑑 + Δ) ˜ ∨ 𝐼 ∧ (𝐼 + 𝑘) − 𝑑] 𝑤(𝐼, 𝑑) ≡ 𝜑(𝐼, 𝑦˜(𝑑) ∨ 𝐼, 𝑑) = −𝑐E[(𝑑 + Δ) ˜ ∨ 0 ∧ 𝑘] + EΓ[Δ ˜ ∨ (𝐼 − 𝑑) ∧ (𝐼 − 𝑑 + 𝑘)] ≡ 𝜈(𝑑 − 𝐼). = −𝑐E[(𝑑 − 𝐼 + Δ) By Lemma A.2, 𝑤(𝐼, 𝑑) is concave in (𝐼, 𝑑). Next, we show that 𝜈(⋅) is concave. Take 𝑥1 ≤ 𝑥2 and 𝜃 ∈ [0, 1] with 𝜃¯ = 1 − 𝜃. Let (𝐼1 , 𝑑1 ) and (𝐼2 , 𝑑2 ) be such that 𝐼1 − 𝑑1 = 𝑥1 and 𝐼2 − 𝑑2 = 𝑥2 . We have ¯ 2 ) = 𝜃𝑤(𝐼1 , 𝑑1 ) + 𝜃𝑤(𝐼 ¯ 2 , 𝑑2 ) ≤ 𝑤(𝜃𝐼1 + 𝜃𝐼 ¯ 2 , 𝜃𝑑1 + 𝜃𝑑 ¯ 2) 𝜃𝜈(𝑥1 ) + 𝜃𝜈(𝑥 ¯ 2 − 𝑑2 )) = 𝜈(𝜃𝑥1 + 𝜃𝑥 ¯ 2 ). = 𝜈(𝜃(𝐼1 − 𝑑1 ) + 𝜃(𝐼 25
Thus, 𝜈(⋅) is concave. It follows that 𝑤(𝐼, 𝑑) = 𝜈(𝐼 − 𝑑) is supermodular in (𝐼, 𝑑). Hence, we conclude the proof.
B
□
Proofs and Remarks of the Formal Results
Proof of Theorem 1. We prove the result using induction. It is clear that 𝑉𝑇 +1 (𝐼) = 0 is concave. Assume that 𝑉𝑡+1 (𝐼) is concave in 𝐼. If we take Γ(𝑦) = 𝐿𝑡 (𝑦) in Lemma A.1, it follows that the optimal order-up-to level 𝑦˜𝑡 (𝑑) for a fixed 𝑑 and any 𝐼 maximizes −𝑐𝑦 + E𝐿𝑡 (𝑦 ∧ (𝐼 + 𝑘) − 𝑑). From Lemma A.2, we deduce that 𝐽𝑡 (𝐼; 𝑦˜𝑡 (𝑑) ∨ 𝐼, 𝑑) is jointly concave in (𝐼, 𝑑). Therefore, 𝑉𝑡 (𝐼) = max 𝐽𝑡 (𝐼; 𝑦˜𝑡 (𝑑) ∨ 𝐼, 𝑑) 𝑑∈[𝑑,𝑑]
is concave in 𝐼.
□
˜ 𝑡 + 𝑑. Suppose Proof of Theorem 2. We first note from the proof of Lemma A.3 that 𝑦˜𝑡 (𝑑) = Δ ˜ This implies 𝑦 ∗ (𝐼) = 𝑦˜𝑡 (𝑑∗ (𝐼)) = Δ ˜ 𝑡 + 𝑑∗𝑡 (𝐼) > 𝐼. We deduce ˜ 𝑡 + 𝑑. 𝑞𝑡∗ (𝐼) > 0 for some 𝐼 ≥ Δ 𝑡 𝑡 ˜ We have ˜ 𝑡 ≥ 𝑑. 𝑑∗𝑡 (𝐼) > 𝐼 − Δ ˜ 𝑡 + 𝑑∗ (𝐼)) ∧ (𝐼 + 𝑘)] + E𝐿𝑡 [(Δ ˜ 𝑡 + 𝑑∗ (𝐼)) ∧ (𝐼 + 𝑘) − 𝑑∗ (𝐼)] 𝑉𝑡 (𝐼) − 𝑐𝐼 = 𝑅(𝑑∗𝑡 (𝐼)) − 𝑐E[(Δ 𝑡 𝑡 𝑡 ˜ 𝑡 ∧ (𝐼 − 𝑑∗𝑡 (𝐼) + 𝑘)] + E𝐿𝑡 [Δ ˜ 𝑡 ∧ (𝐼 − 𝑑∗𝑡 (𝐼) + 𝑘)] = 𝑅(𝑑∗𝑡 (𝐼)) − 𝑐𝑑∗𝑡 (𝐼) − 𝑐E[Δ ˜ 𝑡 ) − 𝑐(𝐼 − Δ ˜ 𝑡 ) − 𝑐Δ ˜ 𝑡 + 𝐿𝑡 (Δ ˜ 𝑡 ) = 𝐽𝑡 (𝐼; 𝐼, 𝐼 − Δ ˜ 𝑡 ). ≤ 𝑅(𝐼 − Δ The inequality follows from two observations. First, 𝑑˜ maximizes the concave function 𝑅(𝑑) − 𝑐𝑑 ˜ Second, we note that Δ ˜ 𝑡 ≥ 𝑑. ˜ 𝑡 maximizes −𝑐Δ + 𝐿𝑡 (Δ). The above relation and 𝑑∗𝑡 (𝐼) > 𝐼 − Δ ˜ 𝑡 yields an expected profit suggests that ordering nothing and setting the average demand to be 𝐼 − Δ that is greater than or equal to 𝑉𝑡 (𝐼). (We shall note that such a solution is always feasible because ˜ 𝑡 < 𝑑∗ (𝐼) < 𝑑.) By definition 𝑞 ∗ (𝐼) > 0 is the smallest optimizer and 𝑉 ∗ (𝐼) is the 𝑑 ≤ 𝑑˜ ≤ 𝐼 − Δ 𝑡 𝑡 𝑡 maximum expected profit. This leads to a contradiction. Therefore, we must have 𝑞𝑡∗ (𝐼) = 0 in this case. ˜ This implies 𝑦 ∗ (𝐼) = 𝐼 ≥ 𝑦˜𝑡 (𝑑∗ (𝐼)) = Δ ˜ 𝑡 + 𝑑∗ (𝐼), ˜ 𝑡 + 𝑑. Now suppose 𝑞𝑡∗ (𝐼) = 0 for some 𝐼 < Δ 𝑡 𝑡 𝑡 ˜ We have ˜ 𝑡 < 𝑑. which in turn leads to 𝑑∗𝑡 (𝐼) ≤ 𝐼 − Δ 𝑉𝑡 (𝐼) = 𝑅(𝑑∗𝑡 (𝐼)) + 𝐿𝑡 [𝐼 − 𝑑∗𝑡 (𝐼)] = 𝑅(𝑑∗𝑡 (𝐼)) − 𝑐𝑑∗𝑡 (𝐼) − 𝑐(𝐼 − 𝑑∗𝑡 (𝐼)) + 𝐿𝑡 [𝐼 − 𝑑∗𝑡 (𝐼)] + 𝑐𝐼 ˜ 𝑡 ) − 𝑐(𝐼 − Δ ˜ 𝑡 ) − 𝑐Δ ˜ 𝑡 + 𝐿𝑡 (Δ ˜ 𝑡 ) + 𝑐𝐼 < 𝑅(𝐼 − Δ ˜ 𝑡 ) + 𝐿𝑡 [𝐼 − (𝐼 − Δ ˜ 𝑡 )] = 𝐽𝑡 (𝐼; 𝐼, 𝐼 − Δ ˜ 𝑡 ). = 𝑅(𝐼 − Δ 26
˜ 𝑡 . Note that the inequality is strict because 𝑑˜ The inequality follows from the maximality of 𝑑˜ and Δ ˜ 𝑡 are the smallest maximizers by definition. The above relation suggests that ordering nothing and Δ ˜ 𝑡 leads to a higher expected profit than 𝑉𝑡 (𝐼), which leads and setting the average demand to be 𝐼 − Δ to a contradiction. Therefore, we must have 𝑞𝑡∗ (𝐼) > 0 in this case.
□
Proof of of Theorem 3. We first prove part iii). By Lemma A.3, 𝐽𝑡 (𝐼; 𝑦˜(𝑑) ∨ 𝐼, 𝑑) is supermodular in (𝐼, 𝑑). It follows that 𝑑∗𝑡 (𝐼) is increasing in 𝐼. ˜ 𝑡 +𝑑. To see the relation 𝑑∗𝑡 (𝐼)−𝑑∗𝑡 (𝐼 −𝛿) ≤ 𝛿, we note from the proof of Lemma A.2 that 𝑦˜𝑡 (𝑑) = Δ Then, we can write the objective as ˜ 𝑡 + 𝑑) ∨ 𝐼, 𝑑) = 𝑅(𝑑) + 𝜈(𝐼 − 𝑑) − 𝑐𝐼, 𝐽𝑡 (𝐼; 𝑦˜(𝑑) ∨ 𝐼, 𝑑) = 𝐽𝑡 (𝐼; (Δ where ˜ 𝑡 − 𝑥) ∨ 0 ∧ 𝑘] + E𝐿𝑡 [Δ ˜ 𝑡 ∨ 𝑥 ∧ (𝑥 + 𝑘)]. 𝜈(𝑥) = −𝑐E[(Δ Now suppose 𝑑∗𝑡 (𝐼) − 𝑑∗𝑡 (𝐼 − 𝛿) > 𝛿 for some 𝐼. By the optimality of 𝑑∗𝑡 (𝐼 − 𝛿), we must have 𝑅(𝑑∗𝑡 (𝐼 − 𝛿)) + 𝜈[𝐼 − 𝛿 − 𝑑∗𝑡 (𝐼 − 𝛿)] > 𝑅(𝑑∗𝑡 (𝐼) − 𝛿) + 𝜈[𝐼 − 𝛿 − (𝑑∗𝑡 (𝐼) − 𝛿)]
(10)
= 𝑅(𝑑∗𝑡 (𝐼) − 𝛿) + 𝜈[𝐼 − 𝑑∗𝑡 (𝐼)]. Note that the inequality is strict because 𝑑∗𝑡 (𝐼 − 𝛿) is the smallest maximizer by definition. Also by the optimality of 𝑑∗𝑡 (𝐼), we must have 𝑅(𝑑∗𝑡 (𝐼 − 𝛿) + 𝛿) + 𝜈[𝐼 − (𝑑∗𝑡 (𝐼 − 𝛿) + 𝛿)] ≤ 𝑅(𝑑∗𝑡 (𝐼)) + 𝜈[𝐼 − 𝑑∗𝑡 (𝐼)].
(11)
Furthermore, since 𝑅(⋅) is concave and 𝑑∗𝑡 (𝐼) − 𝛿 > 𝑑∗𝑡 (𝐼 − 𝛿), we have 𝑅(𝑑∗𝑡 (𝐼) − 𝛿) − 𝑅(𝑑∗𝑡 (𝐼 − 𝛿)) ≥ 𝑅(𝑑∗𝑡 (𝐼)) − 𝑅(𝑑∗𝑡 (𝐼 − 𝛿) + 𝛿). Together with (10) and (11), we deduce 𝜈[𝐼 − 𝛿 − 𝑑∗𝑡 (𝐼 − 𝛿)] − 𝜈[𝐼 − 𝑑∗𝑡 (𝐼)] > 𝑅(𝑑∗𝑡 (𝐼) − 𝛿) − 𝑅(𝑑∗𝑡 (𝐼 − 𝛿)) ≥ 𝑅(𝑑∗𝑡 (𝐼)) − 𝑅(𝑑∗𝑡 (𝐼 − 𝛿) + 𝛿) ≥ 𝜈[𝐼 − 𝛿 − 𝑑∗𝑡 (𝐼 − 𝛿)] − 𝜈[𝐼 − 𝑑∗𝑡 (𝐼)]. This leads to a contradiction. Therefore, we must have 𝑑∗𝑡 (𝐼) − 𝑑∗𝑡 (𝐼 − 𝛿) ≤ 𝛿, which concludes part ˜ 𝑡 , and parts i) and iv) iii). Part ii) follows immediately from the observation that 𝑦˜𝑡 (𝑑) = 𝑑∗𝑡 (𝐼) + Δ follow directly from parts ii) and iii).
□
Lemma B.1 When 𝜔 has a continuous distribution 𝐹 (⋅) and 𝑅(⋅) is differentiable, 𝐿𝑡 (⋅) is differentiable. 27
Proof.
We note form (6) that both −𝐻(⋅) and 𝑉𝑡+1 (⋅) are concave. All we need to show is
that E𝜙(𝑦 − 𝜔) is differentiable with respect to 𝑦 for any concave 𝜙. Since 𝜙 is concave, it is not differentiable for at most countably many points. Let {𝑥1 , 𝑥2 , ⋅ ⋅ ⋅}, with 𝑥𝑗 ≤ 𝑥𝑗+1 , 𝑗 = 1, 2, ⋅ ⋅ ⋅, be the set of non-differentiable points of 𝜙. Then, E𝜙(𝑥 − 𝜔) =
∑∫ 𝑗
(𝑥−𝑥𝑗−1 )∧𝜔
𝜙(𝑥 − 𝜔)d𝐹 (𝜔).
(𝑥−𝑥𝑗 )∨𝜔
We use the traditional convention that an integral with the same upper and lower limits equals zero. It then follows that the right-hand side is differentiable with respect to 𝑥 since 𝜙(𝑥−𝜔) is differentiable for (𝑥 − 𝑥𝑗 ) ∧ 𝜔 < 𝜔 < (𝑥 − 𝑥𝑗−1 ) ∧ 𝜔.
□
Lemma B.2 When 𝜔 has a continuous distribution 𝐹 (⋅) and 𝑅(⋅) is differentiable, the following results hold: i) 𝑉𝑡′ (𝐼𝑡∗ ) = 𝑐. ii) The optimal order-up-to level 𝑦˜𝑡 (𝑑) for a given 𝑑 ∈ [𝑑, 𝑑] satisfies − 𝑐 + 𝐿′𝑡 (𝑦 − 𝑑) = 0.
(12)
Furthermore ∂𝐽𝑡 (𝐼; 𝑦˜(𝑑) ∨ 𝐼, 𝑑) ∂𝑑 Proof.
= 𝑅′ (𝑑) − E𝐿′𝑡 (˜ 𝑦𝑡 (𝑑) ∨ 𝐼 ∧ (𝐼 + 𝑘) − 𝑑).
(13)
˜ = 0. Also, by the envelope To see part i), we first note from (7) that −𝑐 + 𝐿′𝑡 (𝐼𝑡∗ − 𝑑)
theorem, we have ˜ = 𝑐. 𝑉𝑡′ (𝐼𝑡∗ ) = E𝐿′𝑡 (𝐼𝑡∗ − 𝑑) Note that the derivative is well defined in view of Lemma B.1. Now we prove part ii). We first note from Theorem A.1 that 𝑦˜(𝑑) is bounded from the above. The relation in (12) follows immediately from Lemma A.1. The relation in (13) is derived by differentiating 𝐽𝑡 (𝐼; 𝑦˜(𝑑) ∨ 𝐼, 𝑑) with an application of the envelope theorem. Proof of Theorem 4. We define the following functions 𝑍𝑡 (Δ) = −𝑐Δ + 𝐿𝑡 (Δ), Π𝑡 (𝐼) =
max 𝑦≥𝐼,𝑑≤𝑑≤𝑑
28
𝐽𝑡 (𝐼; 𝑦, 𝑑).
□
It follows from (4) that 𝑉𝑡 (𝐼) = Π𝑡 (𝐼) + 𝑐𝐼. Also part i) is equivalent to Π′𝑡+1 (𝐼) ≤ Π′𝑡 (𝐼). We prove i)-iii) together with iv)
′ ˜𝑡 𝑍𝑡′ (Δ) ≤ 𝑍𝑡−1 (Δ) for Δ ≤ Δ
using induction. We first consider the last period. By the envelop theorem, we have ∫ 𝑦𝑡∗ (𝐼)−𝐼 𝑍𝑇′ (𝐼 + 𝑘 − 𝑑∗𝑇 (𝐼))d𝐺(𝑘) ≥ 0 > −𝑐 = Π′𝑇 +1 (𝐼) Π′𝑇 (𝐼) = 0
˜ 𝑇 = 𝑦 ∗ (𝐼) − 𝑑∗ (𝐼), for 𝐼 ≤ 𝐼𝑇∗ . The relation follows from the observation that 𝑍𝑇′ (Δ) ≥ 0 for Δ ≤ Δ 𝑇 𝑇 ˜𝑇, which, in turn, is a consequence of Theorem 1 and Lemma B.2 i). Also, for Δ ≤ Δ 𝑍𝑇′ −1 (Δ) = −𝑐 + E𝐻 ′ (Δ − 𝜔) + 𝛼(Π′𝑇 (Δ − 𝜔) + 𝑐) ≥ −𝑐 + E𝐻 ′ (Δ − 𝜔) = 𝑍𝑇′ (Δ). ˜ 𝑇 − 𝜔 = 𝐼 ∗ − (𝑑˜+ 𝜔) < 𝐼 ∗ because the demand 𝑑˜+ 𝜔 is To see the inequality, we note that Δ − 𝜔 ≤ Δ 𝑇 𝑇 positive almost surely. This means that the inventory level at the beginning of period 𝑇 is below 𝐼𝑇∗ . Together with the observation that Π′𝑇 (𝐼𝑇∗ ) = 0 and Π𝑇 (⋅) is concave, we obtain the above inequality. ˜ 𝑇 −1 ≥ Δ ˜ 𝑇 and 𝐼 ∗ ≥ 𝐼 ∗ . This relation further implies Δ 𝑇 −1 𝑇 Next we check the first-order condition of 𝑑∗𝑇 −1 (𝐼) for 𝐼 ≤ 𝐼𝑇∗ . We have ˜ 𝑇 −1 + 𝑑, 𝑑) ∂𝐽𝑇 −1 (𝐼; Δ ∂𝑑 ∫ Δ ˜ 𝑇 −1 +𝑑−𝐼 ′ 𝑍𝑇′ −1 (𝐼 + 𝑘 − 𝑑)d𝐺(𝑘) − 𝑐 = 𝑅 (𝑑) − 0
′
= 𝑅 (𝑑) − ′
≤ 𝑅 (𝑑) − ′
≤ 𝑅 (𝑑) −
∫ ∫ ∫
˜ 𝑇 +𝑑−𝐼 Δ
0 ˜ 𝑇 +𝑑−𝐼 Δ 0 ˜ 𝑇 +𝑑−𝐼 Δ 0
𝑍𝑇′ −1 (𝐼
+ 𝑘 − 𝑑)d𝐺(𝑘) −
∫
˜ 𝑇 −1 +𝑑−𝐼 Δ
˜ 𝑇 +𝑑−𝐼 Δ
𝑍𝑇′ −1 (𝐼 + 𝑘 − 𝑑)d𝐺(𝑘) − 𝑐
𝑍𝑇′ −1 (𝐼 + 𝑘 − 𝑑)d𝐺(𝑘) − 𝑐 𝑍𝑇′ (𝐼 + 𝑘 − 𝑑)d𝐺(𝑘) − 𝑐 =
˜ 𝑇 + 𝑑, 𝑑) ∂𝐽𝑇 (𝐼; Δ ∂𝑑
˜ 𝑇 −1 ≥ Δ ˜ 𝑇 . The first inequality follows The second equation follows from the observation that Δ ˜ 𝑇 −1 . The above relation suggests that from the convexity of 𝑍𝑇 −1 (⋅) and 𝑍𝑇′ −1 (Δ) ≥ 0 for Δ < Δ 𝑑∗𝑇 −1 (𝐼) ≤ 𝑑∗𝑇 (𝐼) for 𝐼 ≤ 𝐼𝑇∗ . Thus, we have shown the results for 𝑡 = 𝑇 . ∗ Now suppose that the results are true for period 𝑡 + 1. Then, 𝐼𝑡+1 ≤ 𝐼𝑡∗ , Δ∗𝑡+1 ≤ Δ∗𝑡 , and ∗ ≤ 𝐼 ≤ 𝐼𝑡∗ , we have 𝑑∗𝑡+1 (𝐼) ≥ 𝑑∗𝑡 (𝐼). We start with proving part i). For 𝐼𝑡+1
Π′𝑡 (𝐼) ≥ 0 ≥ Π′𝑡+1 (𝐼). ∗ , we consider three cases: For 𝐼 < 𝐼𝑡+1
29
Case 1: If 𝑑 < 𝑑∗𝑡 (𝐼) ≤ 𝑑∗𝑡+1 (𝐼) < 𝑑, then Π′𝑡 (𝐼) = 𝑅′ (𝑑∗𝑡 (𝐼)) − 𝑐 ≥ 𝑅′ (𝑑∗𝑡+1 (𝐼)) − 𝑐 = Π′𝑡 (𝐼). The above relation follows from the first-order conditions of 𝑑∗𝑡 (𝐼) and 𝑑∗𝑡+1 (𝐼) and the concavity of 𝑅(⋅). Case 2: If 𝑑 = 𝑑∗𝑡 (𝐼) < 𝑑∗𝑡+1 (𝐼) ≤ 𝑑, then Π′𝑡 (𝐼)
=
∫
˜ 𝑡 +𝑑∗ (𝐼)−𝐼 Δ 𝑡 0
𝑍𝑡′ (𝐼 + 𝑘 − 𝑑∗𝑡 (𝐼))d𝐺(𝑘)
≥ 𝑅′ (𝑑∗𝑡 (𝐼)) − 𝑐 ≥ 𝑅′ (𝑑∗𝑡+1 (𝐼)) − 𝑐 ∫ Δ ˜ 𝑡+1 +𝑑∗ (𝐼)−𝐼 𝑡+1 ′ 𝑍𝑡+1 (𝐼 + 𝑘 − 𝑑∗𝑡+1 (𝐼))d𝐺(𝑘) = Π′𝑡+1 (𝐼). ≥ 0
˜ 𝑡 +𝑑, 𝑑)/∂𝑑∣𝑑=𝑑 ≤ 0. The second inequality comes The first inequality follows from the relation ∂𝐽𝑡 (𝐼; Δ ˜ 𝑡 + 𝑑, 𝑑)/∂𝑑∣ from the convexity of 𝑅(⋅). The last inequality follows from the relation ∂𝐽𝑡 (𝐼; Δ 𝑑=𝑑 ≥ 0. Case 3: If 𝑑∗𝑡 (𝐼) = 𝑑∗𝑡+1 (𝐼) = 𝑑 or 𝑑∗𝑡 (𝐼) = 𝑑∗𝑡+1 (𝐼) = 𝑑, we define 𝑑∗ ≡ 𝑑∗𝑡 (𝐼) = 𝑑∗𝑡+1 (𝐼). Then, Π′𝑡 (𝐼)
=
∫
≥
∫
≥
∫
˜ 𝑡 +𝑑∗ −𝐼 Δ 0
𝑍𝑡′ (𝐼 + 𝑘 − 𝑑∗ )d𝐺(𝑘)
˜ 𝑡+1 +𝑑∗ −𝐼 Δ 0 ˜ 𝑡+1 +𝑑∗ −𝐼 Δ 0
𝑍𝑡′ (𝐼 + 𝑘 − 𝑑∗ )d𝐺(𝑘) ′ 𝑍𝑡+1 (𝐼 + 𝑘 − 𝑑∗ )d𝐺(𝑘) = Π′𝑡+1 (𝐼).
˜𝑡 ≥ Δ ˜ 𝑡+1 and the fact that 𝑍𝑡′ (Δ) ≥ 0 for Δ ≤ Δ ˜ 𝑡. The first inequality follows from the relation Δ ′ (Δ) for Δ ≤ Δ ˜ 𝑡+1 . The second inequality follows from the induction hypothesis that 𝑍𝑡′ (Δ) ≤ 𝑍𝑡+1
Combining the above three cases, we conclude that Π′𝑡 (𝐼) ≥ Π′𝑡+1 (𝐼) for 𝐼 ≤ 𝐼𝑡∗ . This leads to part i). ˜ 𝑡, We note that, for Δ ≤ Δ ′ 𝑍𝑡−1 (Δ) = −𝑐 − E𝐻 ′ (Δ − 𝜔) + 𝛼(EΠ′𝑡 (Δ − 𝜔) + 𝑐)
≥ −𝑐E𝐻 ′ (Δ − 𝜔) + 𝛼(EΠ′𝑡+1 (Δ − 𝜔) + 𝑐) = 𝑍𝑡′ (Δ). The above relation follows from the fact that Δ − 𝜔 ≤ 𝐼𝑡∗ − (𝑑˜ + 𝜔) ≤ 𝐼𝑡∗ almost surely and Π′𝑡 (𝐼) ≥ ˜ 𝑡−1 ≥ Δ ˜ 𝑡 and 𝐼 ∗ ≥ 𝐼𝑡∗ . Π′𝑡+1 (𝐼) for 𝐼 < 𝐼𝑡∗ . This leads to iv). The above relation also implies Δ 𝑡−1 Thus, we obtain part ii). Finally, part iii) follows by a comparison of the first-order conditions with respect to 𝑑 in periods 𝑡 − 1 and 𝑡 that is similar to the comparison of the first-order conditions in period 𝑇 − 1 and 𝑇 .
30
□
Proof of Theorem 5. We prove the results using induction. It is easy to check that the results hold for period 𝑇 . Suppose that i) holds for period 𝑡 + 1. Then, from (12), we deduce 𝑦˜𝑡𝑎 (𝑑) ≥ 𝑦˜𝑡𝑏 (𝑑). For a given 𝐼, there are three cases to consider. Case 1: If 𝐼 ≤ 𝑦˜𝑡𝑏 (𝑑) ≤ 𝑦˜𝑡𝑎 (𝑑), then from (13) we have ∫ ∂𝐽𝑡𝑎 (𝐼; 𝑦˜𝑎 (𝑑) ∨ 𝐼, 𝑑) ′ 𝑎 = 𝑅 (𝑑) − E𝐿𝑎′ ˜(𝑑) − 𝑑)d𝐺𝑎 (𝑘𝑎 ) 𝑡 ((𝐼 + 𝑘 ) ∧ 𝑦 ∂𝑑 ∫ ∫ 𝑎′ 𝑎 𝑎 𝑎 ′ 𝑐d𝐺𝑎 (𝑘𝑎 ) E𝐿𝑡 (𝐼 + 𝑘 − 𝑑)d𝐺 (𝑘 ) − = 𝑅 (𝑑) − 𝑎 𝑎 𝑎 𝑘 >˜ 𝑦 (𝑑)−𝐼 𝑘 ≤˜ 𝑦 (𝑑)−𝐼 ∫ 𝑎 𝑎 𝑎 𝑎 = 𝑅′ (𝑑) − E max{𝐿𝑎′ 𝑡 (𝐼 + 𝑘 − 𝑑), 𝑐}d𝐺 (𝑘 ). The second equality follows from (12). The last equality follows from the concavity of 𝐿𝑎 (⋅) so that 𝑎 𝑎′ 𝑦 𝑎 (𝑑) − 𝑑) = 𝑐 when 𝐼 + 𝑘 𝑎 ≤ (>)˜ 𝑦 𝑎 (𝑑). Hence, 𝐿𝑎′ 𝑡 (𝐼 + 𝑘 − 𝑑) ≥ (≤)𝐿𝑡 (˜
∂𝐽𝑡𝑎 (𝐼; 𝑦˜𝑎 (𝑑) ∨ 𝐼, 𝑑) 𝑎 = 𝑅′ (𝑑) − E max{𝐿𝑎′ 𝑡 (𝐼 + 𝑘 − 𝑑), 𝑐} ∂𝑑 ∂𝐽𝑡𝑏 (𝐼; 𝑦˜𝑏 (𝑑) ∨ 𝐼, 𝑑) 𝑏 ≤ 𝑅′ (𝑑) − E max{𝐿𝑏′ (𝐼 + 𝑘 − 𝑑), 𝑐} = . 𝑡 ∂𝑑 𝑏′ The inequality follows from the facts that 𝐿𝑎′ 𝑡 (𝑦) ≥ 𝐿𝑡 (𝑦) by the induction hypothesis and that
−𝐿𝑏′ 𝑡 (⋅) is increasing. Case 2: If 𝑦˜𝑡𝑏 (𝑑) < 𝐼 ≤ 𝑦˜𝑡𝑎 (𝑑), then ∂𝐽𝑡𝑎 (𝐼; 𝑦˜𝑎 (𝑑) ∨ 𝐼, 𝑑) 𝑎 = 𝑅′ (𝑑) − E max{𝐿𝑎′ 𝑡 (𝐼 + 𝑘 − 𝑑), 𝑐} ∂𝑑 ∂𝐽𝑡𝑏 (𝐼; 𝑦˜𝑏 (𝑑) ∨ 𝐼, 𝑑) . ≤ 𝑅′ (𝑑) − 𝐿𝑏′ (𝐼 − 𝑑) = 𝑡 ∂𝑑 ˜𝑡𝑏 (𝑑). The inequality follows from the observation that −𝑐 + 𝐿𝑏′ 𝑡 (𝐼 − 𝑑) ≤ 0 for 𝐼 > 𝑦 Case 3: If 𝐼 > 𝑦˜𝑡𝑎 (𝑑) ≥ 𝑦˜𝑡𝑏 (𝑑), then ∂𝐽𝑡𝑎 (𝐼; 𝑦˜𝑎 (𝑑) ∨ 𝐼, 𝑑) ∂𝐽𝑡𝑏 (𝐼; 𝑦˜𝑏 (𝑑) ∨ 𝐼, 𝑑) ′ 𝑏′ = 𝑅′ (𝑑) − E𝐿𝑎′ . 𝑡 (𝐼 − 𝑑) ≤ 𝑅 (𝑑) − E𝐿𝑡 (𝐼 − 𝑑) = ∂𝑑 ∂𝑑 Combining the above three cases, we obtain ∂𝐽𝑡𝑏 (𝐼; 𝑦˜𝑏 (𝑑) ∨ 𝐼, 𝑑) ∂𝐽𝑡𝑎 (𝐼; 𝑦˜𝑎 (𝑑) ∨ 𝐼, 𝑑) ≤ . ∂𝑑 ∂𝑑
(14)
𝑏∗ 𝑎∗ 𝑎∗ 𝑏∗ 𝑏∗ 𝑎∗ 𝑏∗ ˜ Therefore, 𝑑𝑎∗ 𝑡 (𝐼) ≤ 𝑑𝑡 (𝐼), which gives part ii). Also note that 𝑑𝑡 (𝐼𝑡 ) = 𝑑 = 𝑑𝑡 (𝐼𝑡 ) ≥ 𝑑𝑡 (𝐼𝑡 ).
This implies 𝐼𝑡𝑎∗ ≥ 𝐼𝑡𝑏∗ and hence part iii) is obtained. ˜ 𝑎𝑡 ≥ Δ ˜ 𝑏𝑡 from (12). For 𝐼 ≤ 𝐼𝑡𝑏∗ ≤ 𝐼𝑡𝑎∗ , we have Δ𝑎∗ ˜𝑎 ˜𝑏 To see part iv), we note that Δ 𝑡 (𝐼) = Δ𝑡 ≥ Δ𝑡 = 𝑎∗ 𝑏∗ 𝑎∗ 𝑎∗ 𝑏∗ 𝑏∗ 𝑏∗ 𝑎∗ Δ𝑏∗ 𝑡 (𝐼). For 𝐼 ≥ 𝐼𝑡 ≥ 𝐼𝑡 , we have Δ𝑡 (𝐼) = 𝐼 − 𝑑𝑡 (𝐼) ≥ 𝐼 − 𝑑𝑡 (𝐼) = Δ𝑡 (𝐼). For 𝐼𝑡 < 𝐼 < 𝐼𝑡 ,
we have 𝑎∗ 𝑎∗ 𝑎∗ 𝑏∗ 𝑏∗ 𝑏∗ 𝑏∗ Δ𝑎∗ 𝑡 (𝐼) = 𝐼𝑡 − 𝑑𝑡 (𝐼𝑡 ) ≥ 𝐼𝑡 − 𝑑𝑡 (𝐼𝑡 ) ≥ Δ𝑡 (𝐼).
31
Thus, we obtain part iv). Finally, we show part i). For that we need to prove ∂𝐽𝑡𝑎 (𝐼; 𝑦˜𝑎 (𝑑) ∨ 𝐼, 𝑑) ∂𝐽𝑡𝑏 (𝐼; 𝑦˜𝑏 (𝑑) ∨ 𝐼, 𝑑) 𝑎∗ ≤ 𝑏∗ . ∂𝑑 ∂𝑑 𝑑=𝑑 (𝐼) 𝑑=𝑑 (𝐼) 𝑡
(15)
𝑡
𝑖∗ 𝑖∗ From (14), the above is true when 𝑑𝑖∗ 𝑡 (𝐼) = 𝑑 or 𝑑𝑡 (𝐼) = 𝑑, 𝑖 = 𝑎, 𝑏. Also, if 𝑑𝑡 (𝐼) ∈ (𝑑, 𝑑), then (15) 𝑏∗ holds with both sides being zero. If 𝑑𝑎∗ 𝑡 (𝐼) = 𝑑 < 𝑑𝑡 (𝐼), then (15) holds with the left-hand side being 𝑏∗ negative and the right-hand side being nonnegative. If 𝑑 ≤ 𝑑𝑎∗ 𝑡 < 𝑑 = 𝑑𝑡 (𝐼), then (15) holds with
the left-hand side being nonpostive and the right-hand side being positive. Hence, (15) must always hold. Then, 𝑎 𝑎∗ 𝑏′ 𝑏 𝑏∗ 𝑉𝑡𝑎′ (𝐼) − 𝑉𝑡𝑏′ (𝐼) = E𝐿𝑎′ 𝑦 (𝑑𝑎∗ 𝑦 (𝑑𝑏∗ 𝑡 (˜ 𝑡 (𝐼)) ∨ 𝐼 ∧ (𝐼 + 𝑘 ) − 𝑑𝑡 (𝐼)) − E𝐿𝑡 (˜ 𝑡 (𝐼)) ∨ 𝐼 ∧ (𝐼 + 𝑘 ) − 𝑑𝑡 (𝐼))
≥ 𝑅′ (𝑑𝑎∗ (𝐼)) − 𝑅′ (𝑑𝑏∗ (𝐼)) ≥ 0. The first inequality from (15), and the second inequality from the concavity of 𝑅(⋅). Hence, we obtain part i). This completes the induction argument and concludes the proof.
□
Proof of Theorem 6. We sketch the proof for 𝑠𝑎 > 𝑠𝑏 using induction. The results for ℎ𝑎 < ℎ𝑏 follow in a similar way. Suppose that i) is true for period 𝑡 + 1. We note that −E𝐻 ′ (𝑦 − 𝑑 − 𝜔) = 𝑠 − (ℎ + 𝑠)𝐹 (𝑦 − 𝑑), 𝑏′ where 𝐹 (⋅) is the distribution function of 𝜔. Then, 𝐿𝑎′ 𝑡 (𝑦) ≥ 𝐿𝑡 (𝑦). The rest of the proof follows in
a similar way as that of Theorem 5.
□
Proof of Theorem 7. We prove the results using induction. It is easy to check that the results hold for period 𝑇 . Suppose that i) is true for period 𝑡 + 1. We have 𝑏′ 𝑎′ 𝛼𝑉𝑡+1 (𝐼) − 𝛼𝑉𝑡+1 (𝐼) ≤ 𝛼(𝑐𝑏 − 𝑐𝑎 ) ≤ 𝑐𝑏 − 𝑐𝑎 .
Then, 𝑎′ 𝑏 𝑎 𝐿𝑏′ 𝑡 (𝑦) − 𝐿𝑡 (𝑦) ≤ 𝑐 − 𝑐 .
(16)
From (12), we deduce 𝑦𝑡𝑎 (𝑑) ≥ 𝑦𝑡𝑏 (𝑑) and hence 𝑦𝑡𝑎 (𝑑) ∨ 𝐼 ≥ 𝑦𝑡𝑏 (𝑑) ∨ 𝐼. 𝑏′ (𝐼) − 𝑉 𝑎′ (𝐼) ≥ 0 implies 𝐿𝑎′ (𝐼) ≤ 𝐿𝑏′ (𝐼). For a given 𝐼, there are three cases to Also, 𝑉𝑡+1 𝑡 𝑡 𝑡+1
consider. Case 1: If 𝐼 ≤ 𝑦˜𝑡𝑏 (𝑑) ≤ 𝑦˜𝑡𝑎 (𝑑), then from (12) and (13) we have ∂𝐽𝑡𝑎 (𝐼; 𝑦˜𝑎 (𝑑) ∨ 𝐼, 𝑑) 𝑎 = 𝑅′ (𝑑) − E max{𝐿𝑎′ 𝑡 (𝐼 + 𝑘 − 𝑑), 𝑐 } ∂𝑑 ∂𝐽𝑡𝑏 (𝐼; 𝑦˜𝑏 (𝑑) ∨ 𝐼, 𝑑) 𝑏 . ≥ 𝑅′ (𝑑) − E max{𝐿𝑏′ (𝐼 + 𝑘 − 𝑑), 𝑐 } = 𝑡 ∂𝑑 32
𝑎 𝑏 𝑏′ The inequality follows from the relation 𝐿𝑎′ 𝑡 (𝑦) ≤ 𝐿𝑡 (𝑦) and 𝑐 < 𝑐 .
Case 2: If 𝑦˜𝑡𝑏 (𝑑) < 𝐼 ≤ 𝑦˜𝑡𝑎 (𝑑), then we have ∂𝐽𝑡𝑎 (𝐼; 𝑦˜𝑎 (𝑑) ∨ 𝐼, 𝑑) = 𝑅′ (𝑑) − E𝐿𝑎′ ˜(𝑑) − 𝑑) 𝑡 ((𝐼 + 𝑘) ∧ 𝑦 ∂𝑑 ∂𝐽𝑡𝑏 (𝐼; 𝑦˜𝑏 (𝑑) ∨ 𝐼, 𝑑) ′ 𝑏′ ≥ 𝑅′ (𝑑) − 𝐿𝑎′ . 𝑡 (𝐼 − 𝑑) ≥ 𝑅 (𝑑) − 𝐿𝑡 (𝐼 − 𝑑) = ∂𝑑 The first inequality follows from the concavity of 𝐿𝑎𝑡 (⋅) and (𝐼 + 𝑘) ∧ 𝑦˜(𝑑) ≥ 𝐼 for any realization of 𝑏′ 𝑘. The second inequality follows from the relation 𝐿𝑎′ 𝑡 (𝑦) ≤ 𝐿𝑡 (𝑦).
Case 3: If 𝐼 > 𝑦˜𝑡𝑎 (𝑑) ≥ 𝑦˜𝑡𝑏 (𝑑), then ∂𝐽𝑡𝑎 (𝐼; 𝑦˜𝑎 (𝑑) ∨ 𝐼, 𝑑) ∂𝐽𝑡𝑏 (𝐼; 𝑦˜𝑏 (𝑑) ∨ 𝐼, 𝑑) ′ 𝑏′ = 𝑅′ (𝑑) − E𝐿𝑎′ (𝐼 − 𝑑) ≥ 𝑅 (𝑑) − E𝐿 (𝐼 − 𝑑) = . 𝑡 𝑡 ∂𝑑 ∂𝑑 Combining all three cases, we obtain ∂𝐽𝑡𝑏 (𝐼; 𝑦˜𝑏 (𝑑) ∨ 𝐼, 𝑑) ∂𝐽𝑡𝑎 (𝐼; 𝑦˜𝑎 (𝑑) ∨ 𝐼, 𝑑) ≥ . ∂𝑑 ∂𝑑
(17)
𝑎∗ 𝑏∗ ˜𝑡𝑎 (𝑑𝑏∗ ˜𝑡𝑎 (𝑑𝑎∗ We deduce 𝑑𝑎∗ 𝑡 (𝐼)) ∨ 𝐼 ≥ 𝑡 (𝐼)) ∨ 𝐼 ≥ 𝑦 𝑡 (𝐼) ≥ 𝑑𝑡 (𝐼). This, in turn, implies 𝑦𝑡 (𝐼) = 𝑦 𝑏∗ 𝑦˜𝑡𝑏 (𝑑𝑏∗ 𝑡 (𝐼)) ∨ 𝐼 = 𝑦𝑡 (𝐼). Thus, we obtain parts ii) and iii).
It is easily seen that 𝐼𝑡𝑎∗ ≥ 𝐼𝑡𝑏∗ . If 𝐼 ≤ 𝐼𝑡𝑏∗ , then 𝑞𝑡𝑗∗ (𝐼) > 0 for 𝑗 = 𝑎, 𝑏. In this case, equation (12) 𝑏∗ 𝑎∗ 𝑎∗ 𝑎∗ 𝑎∗ 𝑏∗ implies Δ𝑎∗ 𝑡 (𝐼) ≥ Δ𝑡 (𝐼). If 𝐼 ≥ 𝐼𝑡 , then Δ𝑡 (𝐼) = 𝐼 − 𝑑𝑡 (𝐼) ≤ 𝐼 − 𝑑𝑡 (𝐼) = Δ𝑡 (𝐼). We obtain
part iv). 𝑏∗ Finally, we show part i). Note that 𝑑𝑎∗ 𝑡 (𝐼) ≥ 𝑑𝑡 (𝐼) implies ∂𝐽𝑡𝑎 (𝐼; 𝑦˜𝑎 (𝑑) ∨ 𝐼, 𝑑) ∂𝐽𝑡𝑏 (𝐼; 𝑦˜𝑏 (𝑑) ∨ 𝐼, 𝑑) 𝑎∗ ≥ 𝑏∗ . ∂𝑑 ∂𝑑 𝑑=𝑑 (𝐼) 𝑑=𝑑 (𝐼) 𝑡
𝑡
The above relation can be derived in a similar way as (15), which leads to 𝑉𝑡𝑎′ (𝐼) ≤ 𝑉𝑡𝑏′ (𝐼). Also, since 𝑦𝑡𝑎∗ (𝐼) ≥ 𝑦𝑡𝑏∗ (𝐼), we obtain 𝑎∗ 𝑎∗ 𝑏 𝑏′ 𝑏∗ 𝑏∗ − 𝑐𝑎 + 𝐿𝑎′ 𝑡 (𝑦𝑡 (𝐼) − 𝑑𝑡 (𝐼)) ≥ −𝑐 + 𝐿𝑡 (𝑦𝑡 (𝐼) − 𝑑𝑡 (𝐼))
(18)
Then, 𝑎∗ 𝑎∗ 𝑎 𝑉𝑡𝑎′ (𝐼) − 𝑐𝑎 = E𝐿𝑎′ 𝑡 (𝑦𝑡 (𝐼) ∧ (𝐼 + 𝑘) − 𝑑𝑡 (𝐼)) − 𝑐 𝑎∗ 𝑎 𝑎′ 𝑎∗ 𝑎∗ 𝑎 = E𝑘 max[𝐿𝑎′ 𝑡 (𝐼 + 𝑘 − 𝑑𝑡 (𝐼)) − 𝑐 , 𝐿𝑡 (𝑦𝑡 (𝐼) − 𝑑𝑡 (𝐼)) − 𝑐 ] 𝑏∗ 𝑎 𝑏′ 𝑏∗ 𝑏∗ 𝑏 ≥ E𝑘 max[𝐿𝑎′ 𝑡 (𝐼 + 𝑘 − 𝑑𝑡 (𝐼)) − 𝑐 , 𝐿𝑡 (𝑦𝑡 (𝐼) − 𝑑𝑡 (𝐼)) − 𝑐 ] 𝑏∗ 𝑏 𝑏′ 𝑏∗ 𝑏∗ 𝑏 𝑏′ 𝑏 ≥ E𝑘 max[𝐿𝑏′ 𝑡 (𝐼 + 𝑘 − 𝑑𝑡 (𝐼)) − 𝑐 , 𝐿𝑡 (𝑦𝑡 (𝐼) − 𝑑𝑡 (𝐼)) − 𝑐 ] = 𝑉𝑡 (𝐼) − 𝑐 .
The first equality follows by the envelope theorem, the second equality follows from the concavity of 𝑏∗ 𝐿𝑎𝑡 (⋅), the first inequality follows from 𝑑𝑎∗ 𝑡 (𝐼) ≥ 𝑑𝑡 (𝐼) and (18), and the second inequality follows
from (16). Hence, we obtain part i).
□ 33
𝑎′ (𝐼) − 𝑉 𝑏′ (𝐼) ≤ Proof of Theorem 8. We first show the results for to 𝜍. Assume 0 ≤ 𝑉𝑡+1 𝑡+1
˜ 𝑏 . Also, the inverse of 𝐷(𝑝) is ˜𝑎 ≥ Δ (𝜍 𝑎 − 𝜍 𝑏 )/𝛽. It is easily seen from (12) that 𝑦˜𝑡𝑎 (𝑑) ≥ 𝑦˜𝑡𝑏 (𝑑) and Δ 𝑡 𝑡 𝑝(𝑑) = 𝜍/𝛽 − 𝑑/𝛽. Then 𝑅𝑎 (𝑑) = (𝜍/𝛽 𝑎 )𝑑 − (1/𝛽 𝑎 )𝑑2 and 𝑅𝑎′ (𝑑) = (𝜍 − 2𝑑)/𝛽 𝑎 . From (13), we have ∂𝐽𝑡𝑎 (𝐼; 𝑦˜𝑡𝑎 (𝑑) ∨ 𝐼, 𝑑) ∂𝑑
= 𝑅𝑎′ (𝑑) − E𝐿𝑎′ 𝑦𝑡𝑎 (𝑑) ∨ 𝐼) ∧ (𝐼 + 𝑘) − 𝑑] 𝑡 [(˜ = 𝜍 𝑎 /𝛽 − 2𝑑/𝛽 − E𝐿𝑎′ 𝑦𝑡𝑎 (𝑑) ∨ 𝐼) ∧ (𝐼 + 𝑘) − 𝑑] 𝑡 [(˜ ≥ 𝜍 𝑏 /𝛽 − 2𝑑/𝛽 − E𝐿𝑏′ 𝑦𝑡𝑏 (𝑑) ∨ 𝐼) ∧ (𝐼 + 𝑘) − 𝑑] 𝑡 [(˜ ∂𝐽𝑡𝑏 (𝐼; 𝑦˜𝑡𝑏 (𝑑) ∨ 𝐼, 𝑑) 𝑏 = 𝑅𝑏′ (𝑑) − E𝐿𝑏′ [(˜ 𝑦 (𝑑) ∨ 𝐼) ∧ (𝐼 + 𝑘) − 𝑑] = . 𝑡 𝑡 ∂𝑑
(19)
𝑏∗ The inequality follows from 𝑦˜𝑡𝑎 (𝑑) ≥ 𝑦˜𝑡𝑏 (𝑑) and the induction hypothesis. We deduce 𝑑𝑎∗ 𝑡 (𝐼) ≥ 𝑑𝑡 (𝐼). 𝑎∗ 𝑏∗ This, in turn, implies 𝑦˜𝑡𝑎 (𝑑𝑎∗ (𝐼)) ≥ 𝑦˜𝑡𝑏 (𝑑𝑎∗ ˜𝑡𝑏 (𝑑𝑏∗ ˇ𝑡𝑖 (𝑝), 𝑡 (𝐼)) ≥ 𝑦 𝑡 (𝐼)). Thus, 𝑦𝑡 (𝐼) ≥ 𝑦𝑡 (𝐼). Now take 𝑦
𝑖 = 𝑎, 𝑏, to be the optimal order-up-to level when the price is 𝑝. Since 𝐷(𝑝) is linear, the derived objective 𝐽𝑡𝑖 (𝐼; 𝑦ˇ𝑡𝑖 (𝑝) ∨ 𝐼, 𝜍 𝑖 − 𝛽𝑝) is jointly concave in (𝐼, 𝑝). The first-order derivative of 𝑝 satisfies ∂𝐽𝑡𝑎 (𝐼; 𝑦ˇ𝑡𝑎 (𝑝) ∨ 𝐼, 𝜍 𝑎 − 𝛽𝑝) ∂𝑝
= 𝜍 𝑎 − 2𝛽𝑝 + E𝛽𝐿𝑎′ 𝑦𝑡𝑎 (𝑝) ∨ 𝐼) ∧ (𝐼 + 𝑘) − 𝜍 𝑎 + 𝛽𝑝] 𝑡 [(ˇ ≥ 𝜍 𝑏 − 2𝛽𝑝 + E𝛽𝐿𝑏′ 𝑦𝑡𝑎 (𝑝) ∨ 𝐼) ∧ (𝐼 + 𝑘) − 𝜍 𝑏 + 𝛽𝑝] 𝑡 [(ˇ ∂𝐽𝑡𝑏 (𝐼; 𝑦ˇ𝑡𝑏 (𝑝) ∨ 𝐼, 𝜍 𝑏 − 𝛽𝑝) . = ∂𝑝
𝑏∗ We deduce 𝑝𝑎∗ 𝑡 (𝐼) ≥ 𝑝𝑡 (𝐼).
Finally, we check the induction hypothesis for period 𝑡, i.e., 0 ≤ 𝑉𝑡𝑎′ (𝐼) − 𝑉𝑡𝑏′ (𝐼) ≤ (𝜍 𝑎 − 𝜍 𝑏 )/𝛽. 𝑏∗ From (19) and 𝑑𝑎∗ 𝑡 (𝐼) ≥ 𝑑𝑡 (𝐼), we deduce ∂𝐽𝑡𝑎 (𝐼; 𝑦˜𝑡𝑎 (𝑑) ∨ 𝐼, 𝑑) ∂𝐽𝑡𝑏 (𝐼; 𝑦˜𝑡𝑏 (𝑑) ∨ 𝐼, 𝑑) 𝑎∗ ≥ 𝑏∗ . ∂𝑑 ∂𝑑 𝑑=𝑑 (𝐼) 𝑑=𝑑 (𝐼) 𝑡
(20)
𝑡
Then,
𝑎∗ 𝑎∗ 𝑏′ 𝑏∗ 𝑏∗ 𝑉𝑡𝑎′ (𝐼) − 𝑉𝑡𝑏′ (𝐼) = E𝐿𝑎′ 𝑡 [𝑦𝑡 (𝐼) ∧ (𝐼 + 𝑘) − 𝑑𝑡 (𝐼)] − E𝐿𝑡 [𝑦𝑡 (𝐼) ∧ (𝐼 + 𝑘) − 𝑑𝑡 (𝐼)] 𝑎′ 𝑏∗ 𝑎 𝑏 𝑎∗ 𝑏∗ ≤ 𝑅𝑎′ (𝑑𝑎∗ 𝑡 (𝐼)) − 𝑅 (𝑑𝑡 (𝐼)) = (𝜍 − 𝜍 )/𝛽 − 2(𝑑𝑡 (𝐼) − 𝑑𝑡 (𝐼))/𝛽
≤ (𝜍 𝑎 − 𝜍 𝑏 )/𝛽. Also, since 𝑦𝑡𝑎∗ (𝐼) ≥ 𝑦𝑡𝑏∗ (𝐼), we can derive in view of Lemma A.1 𝑏∗ 𝑎∗ 𝑎∗ 𝑏′ 𝑏∗ − 𝑐 + 𝐿𝑎′ 𝑡 (𝑦𝑡 (𝐼) − 𝑑𝑡 (𝐼)) ≥ −𝑐 + 𝐿𝑡 (𝑦𝑡 (𝐼) − 𝑑𝑡 (𝐼))
Then, 𝑎∗ 𝑎∗ 𝑉𝑡𝑎′ (𝐼) = E𝐿𝑎′ 𝑡 (𝑦𝑡 (𝐼) ∧ (𝐼 + 𝑘) − 𝑑𝑡 (𝐼)) 𝑎∗ 𝑎∗ 𝑎′ 𝑎∗ = E𝑘 max[𝐿𝑎′ 𝑡 (𝐼 + 𝑘 − 𝑑𝑡 (𝐼)), 𝐿𝑡 (𝑦𝑡 (𝐼) − 𝑑𝑡 (𝐼))] 𝑏′ 𝑏∗ 𝑏∗ 𝑏∗ ≥ E𝑘 max[𝐿𝑎′ 𝑡 (𝐼 + 𝑘 − 𝑑𝑡 (𝐼)), 𝐿𝑡 (𝑦𝑡 (𝐼) − 𝑑𝑡 (𝐼))] 𝑏∗ 𝑏′ 𝑏∗ 𝑏∗ 𝑏′ ≥ E𝑘 max[𝐿𝑏′ 𝑡 (𝐼 + 𝑘 − 𝑑𝑡 (𝐼)), 𝐿𝑡 (𝑦𝑡 (𝐼) − 𝑑𝑡 (𝐼))] = 𝑉𝑡 (𝐼).
34
(21)
Hence, we conclude the results for 𝜍. 𝑎′ (𝐼) ≤ 𝑉 𝑏′ (𝐼) ≤ 𝑉 𝑎′ (𝐼) and show the To prove the results for 𝛽, we shall assume (𝛽 𝑎 /𝛽 𝑏 )𝑉𝑡+1 𝑡+1 𝑡+1
results for period 𝑡. Since the arguments are similar to those for 𝜍, we omit the details here.
□
Remark B.1 It is easily seen that the proofs of all the above results expect for Theorem 4 can be generalized for nonstationary parameters, i.e., 𝑘𝑡 , 𝑅𝑡 (⋅), 𝐷𝑡 (⋅), 𝑐𝑡 and ℎ𝑡 depending on 𝑡. In particular, Theorem 5 holds when 𝑘𝑡𝑎 is stochastically smaller than or equal to 𝑘𝑡𝑏 for each 𝑡, Theorem 7 holds when 𝑐𝑎𝑡 ≤ 𝑐𝑏𝑡 for each 𝑡, Theorem 6 holds when ℎ𝑎𝑡 ≤ ℎ𝑏𝑡 or 𝑠𝑎𝑡 ≥ 𝑠𝑏𝑡 for each 𝑡, and Theorem 8 holds when 𝜍𝑡𝑎 ≥ 𝜍𝑡𝑏 or 𝛽𝑡𝑎 ≤ 𝛽𝑡𝑏 for each 𝑡. It is also possible to generalize our analysis to involve Markov-modulated supply and demand processes; that is, each of {𝑘𝑡 } and {𝜔𝑡 } forms a Markov chain. In this case, the state of the world at the beginning of period 𝑡 constitutes (𝑘𝑡−1 , 𝜔𝑡−1 ). The resulting optimal profit function takes three arguments 𝑉𝑡 (𝐼; 𝑘𝑡−1 , 𝜔𝑡−1 ). The exposition becomes more complex and the computational burden becomes much larger due to the increased state space. Nevertheless, all the formal results except for Theorem 4 continue to hold. This is because they are established based on the functional properties with respect to 𝐼 instead of the distributions and evolutions of the demand and supply processes. Remark B.2 It is possible to include a multiplicative random component into the demand function, i.e., 𝒟(𝑝) = 𝜀𝐷(𝑝) + 𝜔, where 𝜀 and 𝜔 are random variables. The proof of Theorem 1 can be easily generalized to this case even when 𝜀 and 𝜔 are correlated. However, the optimal order quantity may not be monotone with respect to the net inventory level as demonstrated in Figure 4. This suggests that the properties derived in §4.2 may not hold in this case.
Parameters: 𝑇 = 1, 𝑐 = 3, ℎ = 1, 𝑠 = 15, 𝐷(𝑝) = 75 − 5𝑝, 𝜔 = 0, 𝜀 ∼ 𝑈 𝑛𝑖𝑓 𝑜𝑟𝑚[0, 2], 𝑃 𝑟{𝑘 = 0} = 0.3, 𝑃 𝑟{𝑘 = 10} = 0.6, and 𝑃 𝑟{𝑘 = 50} = 0.2.
Figure 4: The optimal decisions in a multiplicative demand model.
35
Acknowledgements The author is grateful to the anonymous referees, the anonymous associate editor, and the department editor for constructive suggestions leading to significant improvement of the paper. The author is also indebted to Alain Bensoussan, Suresh Sethi, George Shanthikumar, and Paul Zipkin for helpful discussions.
References Agrawal, V. and Seshadri, S. 2000. Impact of uncertainty and risk aversion on price and order quantity in the newsvendor problem. Manufacturing and Service Operations Management. 2(4) 410–422. Amihud, Y. and Mendelson, H. 1983. Price smoothing and inventory. Review of Economic Studies. 50 87–98. Ashley, R. A. and Orr, B. 1985. Further results on inventories and price stickiness. American Economic Review. 75(5) 964–975. Chan, L. M. A., Shen, Z. J. M., Simchi-Levi, D. and Swann, J. 2005. Coordination of pricing and inventory decisions: A survey and classification. in S. D. Wu and Z. J. M. Shen, eds, Handbook of Quantitative Supply Chain Analysis: Modeling in the E-Business Era. Kluwer Academic Publishers 335–392. Chao, X., Chen, H. and Zheng, S. 2008. Joint replenishment and pricing decisions in inventory systems with stochastically dependent supply capacity. European Journal of Operational Research. 191 142155. Chen, X. and Simchi-Levi, D. 2004a. Coordinating inventory control and pricing strategies with random demand and fixed ordering cost: the finite horizon case. Operations Research. 52(6) 887– 896. Chen, X. and Simchi-Levi, D. 2004b. Coordinating inventory control and pricing strategies with random demand and fixed ordering cost: the infinite horizon case. Mathematics of Operations Research. 29(3) 698–723. Chen, X. and Simchi-Levi, D. 2006. Coordinating inventory control and pricing strategies with random demand and fixed ordering cost: the continuous review model. Operations Research Letters. 34 323–332.
36
Ciarallo, F. W., Akella, R. and Morton, T. E. 1994. A periodic review, production planning model with uncertain capacity and uncertain demand: optimality of extended myopic policies. Management Science. 40 320–332. Dada, M., Petruzzi, N. C. and Schwarz, L. B. 2007. A newsvendor’s procuremnt problem when suppliers are unreliable. Manufacturing and Service Operations Management. 9(1) 9–32. Deng, S. and Yano, C. 2006. Joint production and pricing decisions with setup costs and capacity constraints. Management Science. 52(5) 741–756. Elmaghraby, W. and Keskinocak, P. 2003. Dynamic pricing in the presence of inventory considerations: research overview, current practices, and future directions. Management Science. 49 1287– 1309. Federgruen, A. and Heching, A. 1999. Combining pricing and inventory control under uncertainty. Operations Research. 47 454–475. Federgruen, A. and Zipkin, P. 1986a. An inventory model with limited production capacity and uncertain demands I. the average cost criterion. Mathematics of Operations Research. 11(2) 193– 207. Federgruen, A. and Zipkin, P. 1986b. An inventory model with limited production capacity and uncertain demands II. the discounted-cost criterion. Mathematics of Operations Research. 11(2) 208– 215. Gimpl-Heersin, L., Rudlof, C., Fleischmann, M. and Taudes, A. 2008. Integrating pricing and inventory control: Is it worth the effort? Business Research. 1(1) 106–123. Henig, M. and Gerchak, Y. 1990. The structure of periodic review policies in the presence of random yield. Operations Research. 38 634–643. Heyman, D. P. and Sobel, M. J. 1984. Stochastic Models in Operations Research, Vol. II. McGraw-Hill New Yor. Huh, W. T. and Janakiraman, G. 2008. Optimality results in inventory-pricing control: an alternate approach. Operations Research. 56(3) 783–790. Karlin, S. and Carr, C. R. 1962. Prices and optimal inventory policy. in K. J. Arrow, S. Karlin and H. Scarf, eds, Studies in Applied Probability and Management Science. Stanford University Press Stanford, CA 159–172. 37
Li, Q. and Zheng, S. 2006. Joint inventory replenishment and pricing control for systems with uncertain yield and demand. Operations Research. 54 696–705. Petruzzi, N. and Dada, C. M. 1999. Pricing and the newsvendor problem: A review with extensions. Operations Research. 47 183–194. Wang, Y. and Gerchak, M. 1996. Periodic review production models with variable capacity, random yield, and uncertain demand. Management Science. 42 130–137. Whitin, T. M. 1955. Inventory control and price theory. Management Science. 2 61–80. Yano, C. A. and Gilbert, S. M. 2003. Coordinated pricing and production/procurement decisions: A review. in A. Chakravarty and J. Eliashberg, eds, Managing business Interfaces: Marketing, Engineering and Manufacturing Perspectives. Kluwer Academic Publishers Boston, MA 65–103. Yano, C. A. and Lee, H. L. 1995. Lot sizing with random yields: A review. Operations Research. 43 311–334. Young, L. 1978. Price, inventory and the structure of uncertain demand. New Zealand Operations Research. 6 157–177.
38