World Academy of Science, Engineering and Technology 32 2007
Integration of Multi-Source Data to Monitor Coral Biodiversity K. Jitkue, W. Srisang, C. Yaiprasert, K. Jaroensutasinee, and M. Jaroensutasinee In 1998, coral reefs around the world experienced the most extensive and severe bleaching in recorded history [1]–[2]. Coral bleaching was reported in 60 countries and island nations at sites in the Pacific Ocean, Indian Ocean, Red Sea, Persian Gulf, Mediterranean and Caribbean. Indian Ocean corals were particularly severely impacted, with greater than 70 percent mortality reported in the Maldives, Andaman, Lakshadweep Islands, and in Seychelles Marine Park System. Unlike most previous bleaching events in which severe impacts were limited to less than 15 m water depth the 1998 bleaching affected corals at up to 50 m water depth. This mass bleaching followed similar but less severe events in 1987 and 1990. Prior to the early to mid 1980s, bleaching tended to be rare and localized, and corals generally recovered. Year 1998, mass bleaching was coincident with anomalously high sea surface temperatures. That year was the warmest of this century [3], and tropical sea surface temperatures were the highest in the modern record [4]. The geographic extent, regional severity, and increasing frequency of recent mass bleaching events point to an underlying global cause namely a trend of increasing sea surface temperatures in some of the tropical oceans, driven by global warming [5]. This study aims at using multi-source data to monitor coral biodiversity and coral bleaching at Racha Islands, Phuket, Thailand. There were three sources of data: coral form biodiversity, sensor based data and satellite imagery. For coral form biodiversity, we estimated the percentage of seven coral growth forms at Racha Islands, Phuket. For sensor based data, we deployed HOBO pendent sensors to measure sea temperature and light intensity at coral study site. For satellite data, we got satellite data on sea surface temperature from the NOAA website.
Abstract—This study aims at using multi-source data to monitor coral biodiversity and coral bleaching. We used coral reef at Racha Islands, Phuket as a study area. There were three sources of data: coral diversity, sensor based data and satellite data.
Keywords—Coral reefs, temperatue, Satellite imagery.
C
Remote
sensing,
Sea
surface
I. INTRODUCTION
ORAL reefs are the most sensitive of all ecosystems to global warming, pollution, and new diseases. Coral reef ecosystems are sensitive to natural, anthropogenic, and climatic pressures. Assessments as to late 2000 are that 27% of the world's reefs have been effectively lost, with the largest single cause being the massive climate-related coral bleaching event of 1998. This destroyed about 16% of the world's coral reefs in only 9 months, during the largest El Niño and La Niña climate mode ever recorded. While there is a good chance that many of the 16% of damaged reefs will, with time, recover, it is estimated that half of these decimated reefs will never recover to full health. These losses will add to the 11% of the world's reefs already lost to human impacts such as sediment and nutrient pollution, overexploitation and mining of sand and rock, blast fishing, and development on and reclamation of coral reefs.
Manuscript received October 15, 2007. This work was supported in part by Banraya Racha Islands, PTT Pubic Company Limited, TOTAL Foundation and TOTAL E&P Thailand, the TRF/BIOTEC Special Program for Biodiversity Research and Training grant BRT T_351003, BRT T_55001 and BRT T_549002, DPST to W. Srisang, CXKURUE, Walailak University, GLOBE Thailand, GLOBE STN, and IPST Thailand. K. Jitkue is with School of Science, Walailak University, 222 Thaiburi, Thasala District, Nakhon Si Thammarat, 80161, Thailand (phone: +6675672005 ; Fax: +6675672038; e-mail:
[email protected]). W. Srisang is with School of Science, Walailak University, 222 Thaiburi, Thasala District, Nakhon Si Thammarat, 80161, Thailand (phone: +6675672005 ; Fax: +6675672038; e-mail:
[email protected]). C. Yaiprasert is with School of Science, Walailak University, 222 Thaiburi, Thasala District, Nakhon Si Thammarat, 80161, Thailand (phone: +6675672005 ; Fax: +6675672038; e-mail:
[email protected]). K. Jaroensutasinee is with School of Science, Walailak University, 222 Thaiburi, Thasala District, Nakhon Si Thammarat, 80161, Thailand (phone: +66 75672005; Fax: +6675672004; e-mail:
[email protected]). M. Jaroensutasinee is with School of Science, Walailak University, 222 Thaiburi, Thasala District, Nakhon Si Thammarat, 80161, Thailand (phone: +6675672005; Fax: +6675672004; e-mail:
[email protected]).
II. MATERIALS AND METHODS A. Site Description Phuket province is the biggest island which is located on the Andaman sea, southern Thailand. One of the most popular diving and snorkelling near Phuket province is Racha Islands which is about 12 km from Phuket. Racha Islands lies directly south of Phuket known for clear waters and colorful reef. We selected Racha Islands as our coral study site because sea surface temperature of Racha Islands
202
World Academy of Science, Engineering and Technology 32 2007
ANOVAs were used to test for differences in the percentage of seven coral growth forms. All significant tests were twotailed.
could be downloaded from the NOAA website (Fig. 1 a-c). (a)
(b)
C. Sensor Based Data We selected a 1 m2 empty area located within coral reef with sandy bottom at Racha Islands (latitude 7.60488°N, Longitude 98.37660 °E). We deployed four HOBO Pendant temperature and light data loggers model UA-002-64 to measure water temperature and light intensity on 30 June 2007. These loggers were programmed to record water temperature every 5 minutes continuously for six to 12 months. We placed 1.5 kg weight at 1 m2 empty area and tied these four data loggers to the 1.5 kg weight in four diagonal corners. This allowed each data logger to receive an accurate and maximum light intensity. We used a shuttle to upload the water temperature and light intensity data from data loggers every two months. This HOBO data logger was used for comparison with the sea surface temperature from NOAA satellite data.
(c)
Fig. 1 (a) The map of Thailand (b) Phuket Islands and (c) Racha Islands
(a) Massive
(d) Branching
(b) Columnar
(e) Foliacious
(c) Encrusting
D. Satellite Imagery We used sea surface temperature data from satellite data from National Oceanic & Atmospheric Administration (NOAA). These satellite data had the capability of providing synoptic views of the global oceans in near-real-time and the ability to monitor remote reef areas.
(f) Laminar
E. Nework of Biodiversity Database System (NBIDS) NBIDS was a web database system designed with four main features: database, data analysis tool, data visualization tools, and GIS tools. NBIDS developed by Walailak University team and funded by Biodiversity Research Training Program (BRT). Data analysis tools for NBIDS comprised statistical analysis tools and computational modules for each research project. Examples of computation modules’ outputs were biodiversity index, mosquito house index, coral data and fish morphometric data. This tool was an interaction tool for visualizing graph with Mathematica software. We developed web-based tools for data entry at study site. Google Earth KML was used as tools for map visualization. webMathematica was used for simple data visualization and also for advanced data analysis and visualization, e.g., spatial interpolation, and statistical analysis.
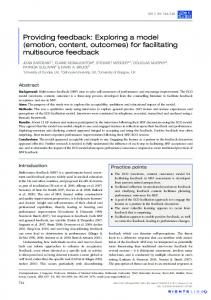
(g) Free living Fig. 2 Seven coral growth forms. (a) Massive, (b) Columnar, (c) Encrusting, (d) Branching, (e) Foliacious, (f) Laminar, and (g) Free living form
B. Coral Form Biodiversity This study was undertaken at Racha Islands, Phuket province, Thailand (Fig. 1c). Coral reefs in this area were 1-5 m depth. We used a random sampling technique to estimate coral growth forms. We took coral photographs with digital cameras, Canon Power Shot A620 and Olympus uD600/S600 with underwater casings. We used digital cameras, swam in straight lines and took 100 coral photographs. Coral photographs were classified into seven coral growth forms: massive, columnar, encrusting, branching, foliacious, laminar, and free-living [7] (Fig. 2a-g). We randomly selected 40 out of 100 coral photographs/study site for a random sampling technique to estimate % coral growth form photography. We used %coral growth forms to calculate species richness, Shannon-Wiener index and Simpson index [4,5]. All variables were tested for normality by using descriptive statistics. Parametric statistics were used when underlying assumptions were met, otherwise non-parametric tests were used. One-way
III. RESULTS AND DISCUSSION A. Coral Form Biodiversity The percentage of coral growth forms differed among seven coral growth forms (one-way ANOVA: F6,1078 = 68.255, P < 0.001, Fig. 3). The most common growth form was the foliacious form (Fig. 3). The second most common coral growth form was the encrusting form (Fig. 3). This kind of % coral growth forms was similar to Koh Tan, Kanom-Mo Koh
203
World Academy of Science, Engineering and Technology 32 2007
40
*
% Cover of species in the image
*
*
35
*
*
*
*
*
30
* * *
*
* *
25
*
20
15
10
5
Massive
Columnar
Encrusting
Branching
Coral forms
Foliaceous
Laminar
Free- living
(a)
Fig. 3 Mean and standard error of % coral form at Racha Islands, Phuket, Thailand
Talae Tai Marine National Park, Nakhon Si Thammarat [6]. This indicates that Racha Islands on the Andaman Sea side might have a very similar environment as at Koh Tan. There were few columnar and free living growth forms at Racha Islands. The columna and free living forms also found at very low percentages at Koh Tan, Koh Mud Soom, and Ao Tong Yee, Kanom-Mo Koh Talae Tai Marine National Park, Nakhon Si Thammarat, Thailand [6]. There were very high biodiversity indices at Racha Islands estimating from coral growth forms: Species Richness = 7 growth forms, Simpson Index (SI) = 0.90, and ShannonWiener Index (SWI) = 1.46 (Fig 4a-c). This study suggests that coral reef at Racha Islands is still in prime condition. When we plotted the accumulation curve of biodiversity indices with the number of coral photographs (Fig. 4b,c) we found that the graph was reaching plateau and steady state at 50 coral photographs. This suggests that for the future study, researchers who are interested in working on coral diversity at Racha Islands should take at least 50 photographs in order to get the suitable estimation of biodiversity indices.
(b)
B. Sensor Based Data Water temperature at Racha Islands on 30 June – 28 August 2007 had a mean ± SD of 29.11± 0.66°C (Fig. 5). Light intensity at Racha Islands on 30 June – 28 August 2007 had a mean ± SD of 2131.60 ± 3006.15 Lux (Fig. 5). Water temperature seems to be very high due to several reasons such as the circulation in the ocean, wind surface, and high solar radiation. Temperature decreased at night to 28.5°C. However, the temperature did not fluctuate much during the day. This study helps us gain a better understanding of coral forms, coral species diversity, coral species richness, and some physical factors at Racha Island.
Fig. 4 Accumulative curve of coral biodiversity indices. (a) Species richness, (b) Simpsom’s index and (c) Shannon-Wiener Index. (-) represents maximum and minimum index, and (●) represents the mean of indices
C. Satellite Imagery Sea surface temperature at Racha Islands was downloaded from NOAA website from June-October 2007. We compared water temperature measured from HOBO data loggers with sea surface temperature from NOAA website. Sea surface temperature from NOAA website was highly matched with HOBO data logger (Fig. 6).
204
World Academy of Science, Engineering and Technology 32 2007
Fig. 5 Sea surface temperature from NOAA website and from HOBO data logger at Racha Islands from June-October 2007. (-) represents water temperature from HOBO pendent, and (●) represents sea surface temperature from the NOAA website
D. Network of Biodiversity Database System (NBIDS) Data from this study (i.e coral photographs, coral growth forms, % coral cover, Species richness, Shannon-Wiener index and Simpson index) were submitted, visualized, and analyzed via NBIDS-BRT web service at http://www.nbids.org/nbidsdata/kml/kitisakKmlCoral.jsp. (Data from Network biodiversity database system: NBIDS). Coral data were overlaid in KML format on Google Earth. ACKNOWLEDGMENTS We thank Network of Biodiversity Database Systems (NBIDS) team for some data visualization in this manuscript. This work was supported in part by Banraya Racha Islands, PTT Public Company Limited, TOTAL Foundation and TOTAL E&P Thailand, TRF/Biotec special program for Biodiversity Research Training grant BRT T_351003, BRT T_550001, and BRT T_549002, DPST to W. Srisang, CXKURUE, Walailak University, GLOBE Thailand, GLOBE STN, and IPST Thailand Commission on Higher Education.
(a)
REFERENCES [1] [2]
[3]
(b)
[4] [5]
[6]
[7]
Fig. 6 NBIDS visualization tools on Google Earth (a) study site, (b) % coral growth form data and (c) coral photograph
205
ISRS. 1998. ISRS statement on global coral bleaching in 1997-98. International Society for Reef Studies. URL www.uncwil.edu/isrs C. Wilkinson, O. Linden, H. Cesar, G. Hodgson, J. Rubens and A. E. Strong. “Ecological and socioeconomic impacts of 1998 coral mortality in the Indian Ocean: An ENSO impact and a warning of future change?” Ambio, vol. 28, pp. 188-196, 1999. NOAA. Climate of 1998 annual review: global temperatures. National Climate Data Center. 12 January 1999 URL:www.ncdc.noaa.gov/ol/climate/research/1998/ann/global_temperat ures.html, 1999. A. E. Strong, T. J. Goreau and R. L. Hayes. “Ocean Hot Spots and coral reef bleaching: January July 1998.” Reef Encounters, vol. 24, pp. 20-22, 1998. US Department of State. 1999. Coral bleaching, coral mortality, and global climate change. Report to the U.S. Coral Reef Task Force. Bureau of Oceans and International Environmental and Scientific Affairs, 5 March 1999. http://www.state.gov/www/global/lobal_issues/coral_reefs/990305_cora lreef_rpt.html K. Jitkue, C. Yaiprasert, S. Surabun, S. Wongkoon, M. Jaroensutasinee, and K. Jaroensutasinee. Coral growth forms, biodiversity index and physical factors at Racha Islands, Phuket. 33rd Congress on Science and Technology of Thailand. Nakhonsithammarat, Thailand. 18th-20th October, p., 2007. J. Veron. Coral of the world. Australian Institute of Marine Science, 2000, PMB 3, Townsville MC, Qld 4810, Australia.
World Academy of Science, Engineering and Technology 32 2007
[8]
[9]
[10] [11] [12] [13] [14] [15] [16] [17]
A. Kattenberg, F. Giorgi, H. Grassl, G. A. Meehl, J. F. B. Mitchell, R. J. Stouffer, T. Tokioka, A. J. Weaver and T. M. L. Wigley. Climate models - projections of future climate. In: Climate Change 1995: The Science of Climate Change (Eds J. T. Houghton, L. G. M. Filho, B. A. Callander, N. Harris, A. Kattenberg, and K. Maskell). Cambridge University Press, Cambridge, UK, pp. 285-357, 1996. L. A. Nurse, R. F. McLean and A.G. Suarez. Small island states. In: The Regional Impacts of Climate Change: An Assessment of Vulnerability, (Eds R. T. Watson, M. C. Zinyowera, and R. H. Moss), Cambridge University Press, Cambridge, UK, pp. 331-354, 1998. G. Hodgson. “A global assessment of human effects on coral reefs.” Mar. Pollution Bull., vol. 38, pp. 345-355, 1999. A. Timmerman, J. Oberhuber, A. Bacher, M. Esch, M. Latif and E. Roeckner. “Increased El Nino frequency in a climate model forced by future greenhouse warming.” Nature, vol. 398, pp. 694-696, 1999. R. T. Barber. “The Coral Response to Climate Change.” Abstract for the U.S. Global change research program seminar series, June 22, 1999. M. W. Gleeson and A. E. Strong. “Applying MCSST to coral reef bleaching.” Adv. Space Res., vol. 16, no.10, pp. 151-154, 1995. R. G. Quayle, T. C. Peterson, A. N. Basist and C. S. Godfrey “An operational near-real-time global temperature index.” Geophys. Res. Lett., vol. 26, pp. 333-335, 1999. T. M. Smith and R. W. Reynolds “A global merged land air and sea surface temperature reconstruction based on historical observations (1880-1997)”. J. Clim., vol. 18, pp. 2021-2036, 2005. R. W. Reynolds, N. A. Rayner, T. M. Smith, D. C. Stokes and W. Wang. “An improved in situ and satellite SST analysis for climate.” J. Climate, vol. 15, pp. 1609-1625, 2002. A. D. Barton and K. S. Casey. “Climatological context for large-scale coral bleaching.” Coral Reefs, vol. 24, pp. 536-554, 2005.
206