The information technology (IT) industry in Taiwan has gained a reputation of rapid growth and global ... 6,2. 222. Journal of Intellectual Capital. Vol. 6 No. 2, 2005 pp. 222-236 q Emerald Group ..... education degree of total employees. Ratio of ... Firm age (P3). Years of establishing the company to year-end of the year.
The Emerald Research Register for this journal is available at www.emeraldinsight.com/researchregister
JIC 6,2
222
The current issue and full text archive of this journal is available at www.emeraldinsight.com/1469-1930.htm
Intellectual capital and performance in causal models Evidence from the information technology industry in Taiwan Wen-Ying Wang and Chingfu Chang Department of Accounting, National Chengchi University, Taipei, Taiwan Abstract Purpose – This paper seeks to investigate the impact of intellectual capital elements on business performance, as well as the relationship among intellectual capital elements from a cause-effect perspective. Design/methodology/approach – The partial least squares approach is used to examine the information technology (IT) industry in Taiwan. Findings – Results show that intellectual capital elements directly affect business performance, with the exception of human capital. Human capital indirectly affects performance through the other three elements: innovation capital, process capital, and customer capital. There also exists a cause-effect relationship among four elements of intellectual capital. Human capital affects innovation capital and process capital. Innovation capital affects process capital, which in turn influences customer capital. Finally, customer capital contributes to performance. The cause-effect relationship between leading elements and lagged elements provides implications for the management of firms in the IT industry. Research limitations/implications – The model proposed in this study is applicable to the high-tech IT industry. Modification of the proposed model may be needed in applying this model to other industries. Practical implications – This study helps management identify relevant intellectual capital elements and their indicators to enhance business performance. Originality/value – This paper is a seminal work to propose an integrated cause-effect model to investigate the relationship among elements of intellectual capital for IT in Taiwan. Keywords Intellectual capital, Performance appraisal, Taiwan, Communication technologies Paper type Research paper
Journal of Intellectual Capital Vol. 6 No. 2, 2005 pp. 222-236 q Emerald Group Publishing Limited 1469-1930 DOI 10.1108/14691930510592816
Introduction The information technology (IT) industry in Taiwan has gained a reputation of rapid growth and global competitive capabilities. The literature contends that a firm’s competitive power and performance are largely influenced by its intellectual capital. Many researchers recognize that intellectual capital, which contains non-financial measures and other related information, is the value driver of an enterprise (Amir and Lev, 1996; Edvinsson and Malone, 1997; Ittner et al., 1997; Stewart, 1997; Bontis, 1999, 2001). They claim that intellectual capital assists enterprises in promoting competitive advantage and value. Therefore, intellectual capital can be viewed as the most valuable asset and the most powerful competitive weapon in business. This is especially so in the IT industry, as its intangible assets are much more important than tangible assets. The theoretical impact of intellectual capital on firm performance has never been over emphasized in the literature. However, there is far from enough empirical research investigating this issue. In particular, studies examining this issue in Taiwan’s IT
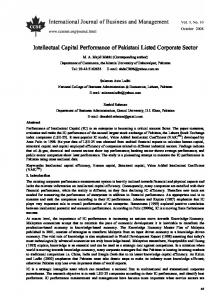
industry are rare, even though Taiwan is one of the IT kingdoms of the world. Moreover, most of the research focuses on the impact of individual intellectual capital on performance without looking into an integrated framework that describes the relationship among individual intellectual capital elements. However, as the cause-effect relations among perspectives is emphasized, rather than merely looking into the relationship between measurable proxies of perspectives, in the Balanced Scorecard system (Kaplan and Norton, 1996, 2001), the relationship among intellectual capital elements should also be of interest to our research. Many factors, such as corporate strategy and industrial characteristics, may affect a firm’s value drivers. Thus, it would be appropriate to put emphasis on the interrelationship between intellectual capital elements from a more macroscopic perspective, rather than paying attention only to certain measures of intellectual capital and performance when we examine the effect of intellectual capital on performance. If the cause-and-effect relationship among elements could be understood, the improvement of business performance may be facilitated through the appropriate management of leading elements of intellectual capital in advance and input more resources in leading elements. Furthermore, for interested outside parties such as investors and creditors, understanding the items that affect business performance and bringing the related information into consideration is helpful for evaluating the company’s true value and developmental potential. Although some researchers point out that there exists a relationship among elements of intellectual capital, there is a lack of empirical studies on this issue. Following this line of argument, we attempt to form an integrated framework on which we investigate the relationship among intellectual capital elements and the impact of these elements on firms’ performance. Hypothesis development A consensus on the classification of intellectual capital elements has not yet been reached in the literature, but there emerges a converged view that intellectual capital is composed of three forms of intellectual capital – human capital, customer capital (or relation capital), and structure capital which can be divided into innovation capital and process capital (Edvinsson and Malone, 1997; Bontis et al., 1999; Buren, 1999; Joia, 2000; Bontis, 2002; Choo and Bontis, 2002). Our study follows this view and classifies intellectual capital into four elements – human capital, customer capital, innovation capital, and process capital. Each element could directly influence performance, as Figure 1 shows. Moreover, there may exist a cause-effect relationship among human capital and other elements of intellectual capital (Bontis and Fitz-enz, 2002). That is, human capital, the most fundamental intellectual capital element, may affect other the three elements first, and then these three elements, in turn, affect performance, as indicated in Figure 2. Besides, as shown in Figure 3, there may also exist a cause-and-effect relationship among innovation capital, process capital and customer capital. These elements of intellectual capital ultimately affect performance indirectly through their interrelationship. Based on the cause-effect framework, this study forms the hypotheses as follows. Direct influence of intellectual capital elements on performance Many researchers find that there is a significant and positive correlation between research and development (R&D) expenditures and business performance as well as
Intellectual capital and performance 223
JIC 6,2
224
Figure 1. Conceptual framework of the direct impact of intellectual capital elements on performance
Figure 2. Conceptual framework of the indirect impact of human capital on performance
Figure 3. Conceptual framework of the interrelationship between intellectual capital elements and their impacts on performance
market value (Cockburn and Griliches, 1988; Hall, 1993; Chauvin and Hirschey, 1993). Sougiannis (1994) shows that when the company has a $1 increase in R&D expenditure, it has a $2 increase in earnings and $5 increase in market value over the next seven years. According to Lev and Sougiannis (1996), $2.328 operating income will be brought in the future if a company increases $1 R&D expenditure. Deeds (2001) finds that R&D intensity, the late period technology development capability, and technology absorption capability have a positive correlation with market value added. From the above studies, it could be inferred that companies’ R&D expenditure not only influences current performance and market value, but also future performance. Can˜ibano et al. (2000) review a few of the research projects conducted relating to the value relevance of intellectual capital items which include R&D expenditure, advertisement expenses, patents, brand name, customer satisfaction, and human resources. It implies that there are intellectual capital items other than R&D expenditure that could affect performance. Besides, many researchers emphasize that
human capital and customer capital play a very important role in business performance or even in businesses survival (Pfeffer, 1994; Uzzi, 1996). According to Lee and Witteloostuijn (1998), companies that have existed longer, have accumulated more abundant experience, use more highly-educated employees, or have higher connective intensity with potential customers go bankrupt much more rarely. Although some studies address the relationship between customer satisfaction and financial performance, only very few studies actually provide empirical results. However, their conclusions are inconsistent. Some researchers find a significantly positive relationship between customer satisfaction and financial performance (Ittner and Larcker, 1998a; Banker et al., 2000), but others do not (Ittner and Larcker, 1998b; Arthur Andersen & Co., 1994; Anderson et al., 1994). We regard customer satisfaction as merely an indicator of customer capital elements while investigating the relationship between customer capital and performance from a more integrated perspective. Based on the cause-effect relation between customer perspectives and financial perspectives in the Balanced Scorecard framework, we infer that customer capital would have a positive impact on performance. In the era of the knowledge-based economy, the key factor that drives and creates a firm’s value is intellectual capital. Consequently, we infer that the creation and accumulation of intellectual capital should be reflected in a firm’s performance. Whichever an indicator belongs to human capital, customer capital, innovation capital, or process capital, there is research supporting its relation with performance. However, most of the prior research focuses on the relation between an individual indicator of some intellectual capital element and performance, neglecting that between elements of intellectual capital and performance. In our first hypothesis, the primary focus is the influence of each intellectual capital element, measured by several indicators, on performance. As shown in Figure 1, H1 and its four sub-hypotheses are developed as follows: H1. Each intellectual capital element directly and positively affects performance. H1a. Human capital directly and positively affects performance. H1b. Innovation capital directly and positively affects performance. H1c. Process capital directly and positively affects performance. H1d. Customer capital directly and positively affects performance. Indirect influence of intellectual capital elements on performance Although elements of intellectual capital have a direct impact on performance, a company’s performance cannot rely solely on any single element. There is such a close linkage between elements that a certain element may be improved or expanded through improvement on other elements. Consequently, if a company wants to create value, adequate combination of all elements is necessary (Edvinsson and Malone, 1997; van der Meer-Kooistra and Zijlstra, 2001; Hussi and Ahonen, 2002; Bukh, 2003). Edvinsson and Malone (1997) emphasize the importance of interaction between intellectual capital elements, and point out that firm value is created through the combination of each element. The Balanced Scorecard system indicates that there exist linkages among the financial perspective, customer perspective, internal process perspective, and learning
Intellectual capital and performance 225
JIC 6,2
and growth perspective, as well as cause-effect relations among these four perspectives. Except for the financial perspective, three of these four perspectives almost belong to intellectual capital categories; they correspond to intellectual capital elements. Based on the Balanced Scorecard concept, we could infer that relationships exist among our four elements of intellectual capital, and that business performance would be influenced by these elements in a cause-effect relationship.
226 Indirect impact of human capital on performance In this section we describe how human capital affects business performance through other elements of intellectual capital including innovation capital, process capital, and customer capital. Among the elements of intellectual capital, human capital is the most fundamental. van der Meer-Kooistra and Zijlstra (2001) point out that human knowledge and experience is the main element, which is the base of other elements and which will impact a company’s value through affecting other elements. Employees’ knowledge and capabilities are the source of innovation. In order to accumulate innovation capital, besides relying on the firm’s encouragement and active input, raising employees’ capabilities is also an important impact factor. Consequently, it would be appropriate to infer that human capital is closely linked to innovation capital. Employees must be relied on to carry out the internal processes of a company, while employees also perform all customer services. Because employees provide the quality of service while implementing internal processes, the capability of employees would affect process efficiency, quality, and customer satisfaction. According to the cause-effect relationship between the learning and growth perspective and internal process perspective, a similar result, stating that human capital possibly affects process capital, could be obtained. Stewart (1997) emphasizes the relationship between employee capabilities and customers. It indicates that employees should possess suitable knowledge or skills to serve customer needs, which must also be the emphasis of the company. Therefore, in the model of the relationship between intellectual capital and performance, accumulating human capital would be helpful to improve the other forms of intellectual capital. As shown in Figure 2, we build the hypotheses as follows: H2. Human capital directly and positively affects the other three intellectual capital elements, which, in turn, affect performance. H2a. Human capital positively affects innovation capital. H2b. Human capital positively affects process capital. H2c. Human capital positively affects customer capital. H2d. Innovation capital positively affects performance. H2e. Process capital positively affects performance. H2f. Customer capital positively affects performance. Interrelationship of intellectual capital elements and their impacts on performance Fornell et al. (1996) propose the American Customer Satisfaction Index and contend that customer expectations, perceived quality, and perceived value could influence
customer satisfaction. Since customer expectations and perceived value are not controllable, a firm’s primary task to enhance customer satisfaction is to increase perceived quality. Zeithaml et al. (1988) and Zeithaml and Bitner (1996) also point out that the quality perceived by customers is the key factor of customer satisfaction. The higher the perceived quality, the more they are satisfied. Through its internal process a company provides service quality to its customers. The improvement in process capital leads to customer satisfaction and enhancement of customer relations. Therefore, process capital is somewhat of a leading intellectual capital element, which affects customer capital element, while the customer capital element in turn influences financial performance. The implementation of process capital relies on employees, which belong to human capital element. The quality of employees determines the internal process quality and service quality. The Balanced Scorecard system emphasizes the cause-effect relation of those four perspectives in the model in which learning and growth perspective, internal process perspective, customer perspective, and financial perspective are interrelated. Correspondingly, in our model human capital affects process capital, which in turn influences customer capital, and then financial performance. However, innovation capital could not be mapped into the Balanced Scorecard concept. Customers may cherish a firm’s excellent innovative capabilities. In such a circumstance, innovation capital affects customer capital. On the one hand, innovative ideas may be turned into products and services through the transformation of the internal process. The enhancement of innovation capabilities helps to increase the quality of the internal process. We therefore infer that innovation capital may affect process capital. As shown in Figure 3, we propose the following hypotheses: H3. Human capital directly and positively affects innovation capital and process capital, and process capital affects customer capital, which then affects performance. H3a. Human capital positively affects innovation capital. H3b. Human capital positively affects process capital. H3c. Innovation capital positively affects process capital. H3d. Innovation capital positively affects customer capital. H3e. Process capital positively affects customer capital. H3f. Customer capital positively affects performance.
Research design In literature, studies on the relationship between intellectual capital and business performance usually use regression analysis or the principal component method. These methods deal with only one dependent variable or component and cannot examine the cause-effect relation between them. In regression analysis, we may frequently encounter a multi-collinearity problem if we include related variables as independent variable in order to lessen the error-in-variable problem. To avoid the multi-collinearity and measurement errors, while addressing the cause-effect
Intellectual capital and performance 227
JIC 6,2
228
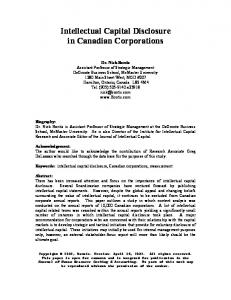
relationship between intellectual capital and business performance, we adopt the partial least squares (PLS) method, which is a variance-based structural equation modeling approach used in previous intellectual capital research studies (see Bontis, 1998, 2004; Bontis et al., 2000; Bontis and Fitz-enz, 2002). In this study we have three samples for three corresponding models. Each of these samples consists of all listed firms in the IT industry during the period 1997-2001. We delete observations with any missing values. Data have been retrieved from the database of the Taiwan Economic Journal (TEJ), annual report, and prospectus. Although the samples are not too small, we, for the sake of conservative considerations, still use bootstrap re-sampling methods to conduct inference. In an attempt to maximize stockholders’ wealth, management usually tries to increase operating earnings and stock price. Accounting earnings reflect past performance, while the stock price is an index of market expectation of a firm’s performance in the future. Both accounting earnings and stock price are included as performance measures. The indicators of each intellectual capital element, as shown in Table I, are adopted from the literature on the measures of intellectual capital or determinants of business performance (Sougiannis, 1994; Kaplan and Norton, 1996; Lev and Sougiannis, 1996; Edvinsson and Malone, 1997; Stewart, 1997; Sveiby, 1997; Bontis, 1998; Financial Management Accounting Committee, 1998; Lee and Witteloostuijn, 1998; Bukh et al., 2001; Deeds, 2001; Mouritsen et al., 2001). Empirical results This section presents the empirical results regarding the direct influence of intellectual elements on performance, the indirect impact of human capital on performance, and the interrelationship of intellectual capital elements as well as their impacts on performance. Direct influence of intellectual capital elements on performance In our first hypothesis, we conjecture that each element of intellectual capital directly and positively affects performance. Figure 4 shows the empirical results. All the coefficients, with the exception of human capital, are shown to affect performance significantly ( p-value , 0:01). It supports our H1b, H1c, and H1d. Innovation capital, process capital, and customer capital have significant and positive influences on performance. Creating and accumulating these three elements of intellectual capital contributes to performance. Process capital has the strongest direct impact on performance because Taiwan’s IT firms are mostly original equipment manufacturing(OEM-) or original design manufacturing- (ODM-) oriented businesses and their production efficiency relies on the improvement of the production process. Therefore, production efficiency is the most important factor for the industry. Table II summarizes the loadings of the indicators for each element of intellectual capital and performance for the model in Figure 4. The significant loadings for innovation capital are R&D intensity, current R&D density, last R&D density, and R&D employee ratio. The results are consistent with those in the relevant literature in that it suggests that the higher the R&D ratio, the better performance will be in the next period. The significant loadings in order of magnitude for process capital are value added per employee, administrative expense per employee, plant assets turnover, productivity per employee, and firm age. One noteworthy thing is the negative loading
Variable Performance Return on assets (Per1) Adjusted return on assets (Per2) Return on stockholders’ equity (Per3) Adjusted return on stockholders’ equity (Per4) Operating income ratio (Per5) Stock price (Per6) Market value (Per7) Market value – book value (Per8) Market-to-book (Per9)
Definition Net income after tax/average total assets Operating income/average total assets Operating income/average common stockholders’ equity (Operating income 2 interest expense)/average common stockholders’ equity Operating income/net sales Year-end the closing price Year-end market value Year-end market value – year-end book value Year-end market value/year-end book value
Intellectual capital and performance 229
Human capital Number of employees (H1) Total number of employees Number of advanced educational background (H2) Total number of college graduates Average education degree (H3) Employees are divided into Master’s, college, and high school or below, with the weight of 3, 2, 1, and 0 for each category to compute average education degree of total employees Ratio of advanced educational background (H4) College graduates/total number of employees Average years of service with company (H5) Average employees’ work years in the company Average age (H6) Average age of employees Ratio of change in number of employees (H7) (Number of employees at the end of the period 2 number of employees at the beginning of the period)/number of employees at the beginning of the period Payroll expense ratio (H8) (Salary expense þ direct labor cost þ indirect labor cost)/net sales Innovation capital Current R&D density (I1) R&D expense this year/net sales this year Last R&D density (I2) R&D expense last year/net sales last year Current R&D expense (I3) Last R&D expense (I4) Income per R&D expense (I5) Net income after tax/R&D expense Number of R&D employees (I6) R&D employee ratio (I7) Number of R&D employees/number of total employees R&D per employee (I8) R&D expense this year/number of R&D employees R&D intensity (I9) R&D expense this year/average total assets Patent fee (I10) Process capital Productivity per employee (P1) Value added per employee (P2) Firm age (P3) Organizational stability (P4) Current capital turnover (P5) Administrative expense ratio (P6)
Net sales/total number of employee Net income after tax/total number of employee Years of establishing the company to year-end of the year Employees’ average work years/corporation age Net sales/average current assets Administrative expense/net sale (continued)
Table I. Variable definition
JIC 6,2
230
Variable
Definition
Administrative expense per employee (P7) Inventory turnover (P8) Plant assets turnover (P9)
Administrative expense/number of total employee Cost of goods sold/average inventory Net sales/average plant assets
Customer capital Number of main customers (C1)
Number of customers whose share in sales above 10 percent Growth rate in sales Advertising expense Marketing expense Marketing expense/net sales 1 2 (sales returns and allowances/net sales) Net sales from the first big three customers/net sales
Growth rate (C2) Advertising expense (C3) Marketing expense (C4) Marketing expense ratio (C5) Acceptance rate (C6) Concentration (C7) Table I.
Figure 4. Empirical results for direct impact of intellectual capital elements on performance
Construct Innovation capital Process capital Customer capital Performance
Table II. Significant indicators for direct impact of intellectual capital elements on performance
Significan t indicator I9 0.906* (38.549) P2 0.909* (33.158) C6 0.806* (7.778) Per2 0.950* (102.122)
I1 0.890* (16.515) P7 0.717* (2.418) C2 0.764* (7.022) Per1 0.921* (70.882)
I2 0.870* (15.235) P9 0.669* (6.025)
I7 0.775* (13.142) P1 0.485* (4.786)
P3 2 0.437* (2 4.015)
Per4 0.890* (40.201)
Per3 0.881* (38.673)
Per5 0.743* (18.663)
Per6 0.684* (8.770)
Per9 0.645* (6.170)
Notes: * Significant at p-value , 0:01; Sample size is 131; t-value in brackets; For notation of variables, I1 denotes current R&D density, I2 last R&D density, I7 R&D employee ratio, I9 R&D intensity, P1 productivity, P2 value added per employee, P3 firm age, P7 administrative expense per employee, P9 plant assets turnover, C2 growth rate, C6 acceptance rate, Per1 ROA, Per2 adjusted ROA, Per3 ROE, Per4 adjusted ROE, Per5 operating income ratio, Per6 stock price, and Per9 market-to-book
for firm age that implies that firm age has a negative impact on performance. Sveiby (1997) and Lee and Witteloostuijn (1998) argue that the older a firm is, the more stable and reliable the firm is. Our result shows a different story. We conjecture that dramatic changes in the IT industry favor new comers for their adaptive capability to the changing environment. Figures 4 shows the insignificance of the coefficient of human capital. This does not imply human capital is not important to performance. Instead, human capital and performance may not have a direct relation, but rather an indirect relation. Next, we will conduct further investigation into this issue.
Intellectual capital and performance 231
Indirect impact of human capital on performance As discussed above, human capital does not directly influence performance. We therefore conjuncture the two have an indirect relationship. Figures 5 and 6 show how human capital indirectly impacts performance through the other three elements. First, we assume Figure 5 describes the story, but find the path to performance from innovation capital is insignificant. We therefore look into the model in Figure 6 which explains how human capital indirectly affects performance through innovation capital and process capital, and how innovation capital has an indirect impact on performance
Figure 5. Empirical results for indirect impact of human capital on performance
Figure 6. Empirical results for indirect impact of human capital on performance
JIC 6,2
232
through process capital. Figure 6 shows that the coefficient from innovation capital to process capital and the t-value are 0.341 and 2.435, respectively, and the coefficient from process to performance and its t-value are 0.606 and 12.645, respectively. This result explains the insignificance in the coefficient to performance from human capital in Figure 4. Although process capital is a very important factor affecting performance, it needs support from innovation capital and human capital, and human capital is most fundamental to a firm’s overall performance. Figures 5 and 6 support H2a, H2b, H2c, H2e, and H2f. Table III summarizes the loadings of the indicators for each element of intellectual capital and performance for the model in Figure 6. The significant loadings in order of magnitude for human capital are the number of advanced educational background, number of employees, and average age. The first two indicators have positive loadings, but the last item has negative loading. The negative loading of average age of employees implies that the younger the employees, the higher the possibility that they have creative thinking and learning capabilities to adapt to the rapidly changing IT environment. The significant loadings in order of magnitude for process capital are value added per employee, administrative expense per employee, plant assets turnover, productivity per employee, firm age, and current capital turnover. All of the loadings are positive, except for firm age. The significant loadings in order of magnitude for innovation capital are current R&D expenses, last R&D expense, and the number of R&D employees. The significant loadings in order of magnitude for customer capital are marketing expenses, advertising expenses, and product acceptance rate. The first two indicators have negative loadings while the last one Construct Human capital Innovation capital Process capital Customer capital Performance
Table III. Significant indicators for indirect impact of human capital on performance
Significant indicator H2 0.981* (209.732) I3 0.980* (120.393) P2 0.880* (26.942) C4 20.841* (218.510) Per2 0.951* (91.546)
H1 0.972* (128.795) I4 0.970* (83.761) P7 0.744* (3.224) C3 20.772* (26.383) Per1 0.921* (68.431)
H6 20.378* (23.481) I6 0.913* (17.499) P9 0.743* (9.875) C6 0.390* (2.740) Per4 0.895* (36.040)
P1 0.569* (6.598)
P3 2 0.385* (2 3.187)
P5 0.263* (2.067)
Per3 0.887* (36.785)
Per5 0.736* (16.743)
Per6 0.686* (7.794)
Per9 0.644* (6.148)
Notes: * Significant at p-value , 0:01; Sample size is 131; t-value in parentheses; For notation of variables, H1 denotes number of employees, H2 number of advanced educational background, H6 average age, I3 current R&D expense, I4 last R&D expense, I6 number of R&D employees, P1 productivity, P2 value added per employee, P3 firm age, P5 current capital turnover, P7 administrative expense per employee, P9 plant assets turnover, C3 advertising expense, C4 marketing expense ratio, C6 acceptance rate, Per1 ROA, Per2 adjusted ROA, Per3 ROE, Per4 adjusted ROE, Per5 operating income ratio, Per6 stock price, and Per9 market-to-book
has a positive loading. Most IT firms in Taiwan are ODM or OEM manufacturers and their customers are not consumers. Marketing and advertisement may not promote their products. However, product acceptance rate is a positive indicator of customer capital and has positive contributions to performance.
Intellectual capital and performance
Interrelationship of intellectual capital elements and their impacts on performance As previously discussed, human capital has a direct impact on the other three elements and an indirect impact on performance. There may also exist an interrelationship between innovation capital, process capital, and customer capital. Therefore, we propose a model that presents the interrelationship between intellectual capital elements and their impacts on performance, as shown in Figure 7. The significance of the coefficients in the figure supports H3a, H3b, H3c, H3e, and H3f, except H3d. It implies that human capital has a direct impact on innovation capital and process capital, and that innovation capital directly influences process capital, which in turn affects customer capital, while finally the customer capital affects performance. Although innovation capital has a direct impact on process capital, it does not have an influence on customer capital. Customer satisfaction comes from the perceived quality of products or services, which relies on process capital, but not innovation. Innovation has only an indirect effect on customer capital through process capital. Figure 7 shows human capital is the most important element of intellectual capital, for it has a direct influence on process capital (direct coefficient at 0.538) and an indirect influence on process capital through innovation capital (indirect coefficient at 0:738* 0:339 ¼ 0:250). As such, the total coefficient of human capital to process capital is 0:788ð¼ 0:538 þ 0:250Þ. In addition, process capital has the most direct influence on performance in all of these models, as shown in Figures 4-6. If we want to improve process capital, we need to improve innovation capital and human capital. If we want to improve innovation capital, we need to improve human capital, too. Therefore, human capital is the most important element of intellectual capital for an enterprise. For each element of intellectual capital and performance for the model in Figure 7, Table IV summarizes the loadings of the indicators. One thing worth noting is that the significant indicators in Table IV are very similar to those in Table III, although the models are different. This may show evidence that the variables adopted in the models are robust.
233
Figure 7. Empirical results for the interrelationship between intellectual capital elements and their impacts on performance
JIC 6,2
Construct Human capital Innovation capital
234 Process capital Customer capital Performance
Table IV. Significant indicators for interrelationship between intellectual capital elements and their impacts on performance
Significant indicator H2 0.967* (39.232) I3 0.980* (98.723) P9 0.900* (19.456) C6 0.777* (6.420) Per2 0.973* (165.424)
H1 0.966* (45.974) I4 0.969* (77.270) P1 0.794* (11.646) C2 0.643* (2.671) Per1 0.940* (79.281)
H6 20.395* (23.668) I6 0.914* (15.932) P2 0.701* (7.704) C3 20.407* (21.815) Per4 0.936* (66.323)
H8 0.248* (3.021)
P7 0.652* (4.261)
P5 0.548* (3.822)
Per3 0.926* (55.067)
Per5 0.795* (23.565)
Per9 0.527* (5.817)
Notes: * Significant at p-value , 0:01; Sample size is 131; t-value in parentheses; For notation of variables, H1 denotes number of employees, H2 number of advanced educational background, H6 average age, H8 payroll expense ratio, I3 current R&D expense, I4 last R&D expense, I6 number of R&D employees, P1 productivity, P2 value added per employee, P5 current capital turnover, P7 administrative expense per employee, P9 plant assets turnover, C2 growth, C3 advertising expense, C6 acceptance rate, Per1 ROA, Per2 adjusted ROA, Per3 ROE, Per4 adjusted ROE, Per5 operating income ratio, and Per9 market-to-book
Conclusion With a sample of listed firms in the IT industry in Taiwan, this study investigates the cause-effect relationship between elements of intellectual capital and business performance. We try to find out, step by step, the interrelationship among four elements of intellectual capital and how they influence performance. The results show that, with the exception of human capital, innovation capital, process capital, and customer capital all have a direct effect on performance. Although human capital does not have a direct impact on performance, it has a direct impact on the other capital elements, which in turn affect performance. There also exists an interrelationship between intellectual capital elements. Human capital directly affects innovation capital and process capital. Innovation capital and process capital further influence performance. Process capital has something to do with innovation capital in that innovation capital directly influences process capital. In sum, human capital is the primary leading factor in which management should put the most effort. This study, showing how intellectual capital elements affect business performance in Taiwan’s IT industry, provides some implications for management in the IT industry.
References Amir, E. and Lev, B. (1996), “Value-relevance of non-financial information: the wireless communications industry”, Journal of Accounting and Economics, August-December, pp. 3-30. Anderson, E.W., Fornell, C. and Lehmann, D.R. (1994), “Customer satisfaction, market share, and profitability: findings from Sweden”, Journal of Marketing, Vol. 58, July, pp. 53-66.
Arthur Andersen & Co. (1994), Customer Satisfaction Strategies and Tactics, Arthur Andersen & Co., Chicago, IL. Banker, R.D., Potter, G. and Srinivasan, D. (2000), “An empirical investigation of an incentive plan that includes non-financial performance measures”, The Accounting Review, Vol. 75 No. 1, pp. 65-92. Bontis, N. (1998), “Intellectual capital: an exploratory study that develops measures and models”, Management Decision, Vol. 36 No. 2, pp. 63-76. Bontis, N. (1999), “Managing organizational knowledge by diagnosing intellectual capital: framing and advancing the state of the field”, International Journal of Technology Management, Vol. 18 Nos. 5/6/7/8, pp. 433-62. Bontis, N. (2001), “Assessing knowledge assets: a review of the models used to measure intellectual capital”, International Journal of Management Reviews, Vol. 3 No. 1, pp. 41-60. Bontis, N. (2002), World Congress of Intellectual Capital Readings, Butterworth-Heinemann/KMCI Press, Boston, MA. Bontis, N. (2004), “National Intellectual Capital Index: a United Nations initiative for the Arab region”, Journal of Intellectual Capital, Vol. 5 No. 1, pp. 13-39. Bontis, N. and Fitz-enz, J. (2002), “Intellectual capital ROI: a causal map of human capital antecedents and consequents”, Journal of Intellectual Capital, Vol. 3 No. 3, pp. 223-47. Bontis, N., Keow, W. and Richardson, S. (2000), “Intellectual capital and the nature of business in Malaysia”, Journal of Intellectual Capital, Vol. 1 No. 1, pp. 85-100. Bontis, N., Dragonetti, N., Jacobsen, K. and Roos, G. (1999), “The knowledge toolbox: a review of the tools available to measure and manage intangible resources”, European Management Journal, Vol. 17 No. 4, pp. 391-402. Bukh, P.N. (2003), “Commentary: The relevance of intellectual capital disclosure: a paradox?”, Accounting, Auditing & Accountability Journal, Vol. 16 No. 1, pp. 49-56. Bukh, P.N., Larsen, H.T. and Mouritsen, J. (2001), “Constructing intellectual capital statements”, Scandinavian Journal of Management, Vol. 17 No. 1, pp. 87-108. Buren, M.E.V. (1999), “A yardstick for knowledge management”, Training & Development, Vol. 53 No. 5, pp. 71-8. Can˜ibano, L., Garc´ia-Ayuso, M. and Sa´nchez, M.P. (2000), “Accounting for intangibles: a literature review”, Journal of Accounting Literature, Vol. 19, pp. 102-30. Chauvin, K.W. and Hirschey, M. (1993), “Advertising, R&D expenditures and the market value of the firm”, Financial Management, December 22, pp. 128-40. Choo, C.W. and Bontis, N. (2002), The Strategic Management of Intellectual Capital and Organizational Knowledge, Oxford University Press, New York, NY. Cockburn, I. and Griliches, Z. (1988), “Industry effects and appropriability measures in the stock market’s valuation of R&D and patents”, American Economic Review, Vol. 78 No. 2, pp. 419-23. Deeds, D.L. (2001), “The role of R&D intensity, technical development and absorptive capacity in creating entrepreneurial wealth in high technology start-ups”, Journal of Engineering and Technology Management, Vol. 18 No. 1, pp. 29-47. Edvinsson, L. and Malone, M.S. (1997), Intellectual Capital – Realizing Your Company’s True Value by Finding Its Hidden Roots, Harper Business, New York, NY. Financial Management Accounting Committee (1998), The Measurement and Management of Intellectual Capital: An Introduction, International Federation of Accountants, New York, NY.
Intellectual capital and performance 235
JIC 6,2
236
Fornell, C., Johnson, M.D., Anderson, E.W., Cha, J. and Bryant, B.E. (1996), “The American Customer Satisfaction Index: nature, purpose, and findings”, Journal of Marketing, Vol. 60, October, pp. 7-18. Hall, B.H. (1993), “The stock market’s valuation of R&D investment during the 1980s”, The American Economic Review, Vol. 83 No. 2, pp. 259-64. Hussi, T. and Ahonen, G. (2002), “Managing intangible assets – a question of integration and delicate balance”, Journal of Intellectual Capital, Vol. 3 No. 3, pp. 277-86. Ittner, C.D. and Larcker, D.F. (1998a), “Are non-financial measures leading indicators of financial performance? An analysis of customer satisfaction”, Journal of Accounting Research, Vol. 36, Supplement, pp. 1-35. Ittner, C.D. and Larcker, D.F. (1998b), “Innovations in performance measurement: trends and research implications”, Journal of Management Accounting Research, Fall, pp. 205-38. Ittner, C.D., Larcker, D.F. and Rajan, M.V. (1997), “The choice of performance measures in annual bonus contracts”, The Accounting Review, April, pp. 231-55. Joia, L.A. (2000), “Measuring intangible corporate assets – linking business strategy with intellectual capital”, Journal of Intellectual Capital, Vol. 1 No. 1, pp. 68-84. Kaplan, R.S. and Norton, D.P. (1996), The Balanced Scorecard: Translating Strategy into Action, Harvard Business School Press, Boston, MA. Kaplan, R.S. and Norton, D.P. (2001), The Strategy-focused Organization, Harvard Business School Press, Boston, MA. Lee, K. and Witteloostuijn, A.V. (1998), “Human capital, social capital, and firm dissolution”, Academy of Management Journal, Vol. 41 No. 4, pp. 425-40. Lev, B. and Sougiannis, T. (1996), “The capitalization, amortization and value relevance of R&D”, Journal of Accounting and Economics, Vol. 21, February, pp. 107-38. Mouritsen, J., Larsen, H.T. and Bukh, P.N. (2001), “Valuing the future: intellectual capital accounts at Skandia”, Accounting, Auditing & Accountability Journal, Vol. 14 No. 4, pp. 399-422. Pfeffer, J. (1994), Competitive Advantage through People, Harvard Business School Press, Boston, MA. Sougiannis, T. (1994), “The accounting-based valuation of corporate R&D”, The Accounting Review, Vol. 69, pp. 44-68. Stewart, T.A. (1997), Intellectual Capital: The New Wealth of Organizations, Bantam Doubleday Dell Publishing Group, New York, NY. Sveiby, K.E. (1997), The New Organizational Wealth: Managing and Measuring Knowledge-based Assets, Berrett-Koehler Publishers, New York, NY. Uzzi, B. (1996), “The sources and consequences of embeddedness for the economic performance of organizations: the network effect”, American Sociological Review, Vol. 61, pp. 674-98. van der Meer-Kooistra, J. and Zijlstra, S.M. (2001), “Reporting on intellectual capital”, Accounting, Auditing & Accountability Journal, Vol. 14 No. 4, pp. 456-76. Zeithaml, V.A. and Bitner, M.J. (1996), Service Marketing, McGraw-Hill, New York, NY. Zeithaml, V.A., Berry, L.L. and Parasuraman, A. (1988), “Communication and control process in the delivery of service quality”, Journal of Marketing, Vol. 52, April, pp. 35-48.