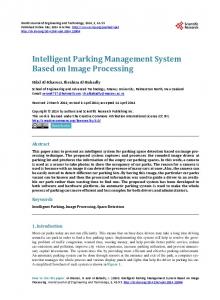
Original article doi: 10.1111/jcal.12186
bs_bs_banner
Intelligent tutorial system based on personalized system of instruction to teach or remind mathematical concepts R.C. Paiva,*,†,§ M.S. Ferreira*,‡ & M.M. Frade*,§ *Mathematics department of School of Technology and Management, Polytechnic Institute of Leiria, Leiria, Portugal †Centro de Matemática da Universidade do Porto, Portugal ‡Center for Research and Development in Mathematics and Applications, University of Aveiro, Portugal §Computer Science and Communication Research Centre, Portugal
Abstract
The growth of the higher education population and different school paths to access an academic degree has increased the heterogeneity of students inside the classroom. Consequently, the effectiveness of traditional teaching methods has reduced. This paper describes the design, development, implementation and evaluation of a tutoring system (TS) to improve student’s engagement in higher mathematics. The TS design was based on the Personalized System of Instruction of the Mastery Learning pedagogical approach and can be implemented in any higher education course with mathematics needs. The TS consists on small self-paced modularized units of educational contents, including tutorial videos, notes and formative e-assessment with personalized feedback. The TS ensures that the student is only allowed to proceed to the next unit after he or she achieves the required mastery criterion of the current unit. The TS was implemented in the Quantitative Methods course of an undergraduate degree and received good acceptance from students. It was also recognized that TS contributed to learning and engagement with the discipline. Through an experimental research experience, it has been shown that the imposition of restrictions on the advance to the next level by a mastery criterion leads to a significant improvement in student’s engagement and performance.
Keywords
mathematics, mastery learning, online assessment, video, tutoring system.
Introduction
The democratization of the Portuguese higher education in recent years launched a number of challenges in the teaching–learning methodologies of its institutions. The accommodation of students with different school routes has increased the heterogeneity of students of different cycles of training and has reduced the effectiveness of traditional education based on groups (Santos 2000). The problem of maintaining the scientific requirements Accepted: 31 January 2017 Correspondence: Rui C. Paiva, Departamento de Matemática da Escola Superior de Tecnologia e Gestão do Instituto Politécnico de Leiria, Morro do Lena, Alto do Vieiro, 2411-901 Leiria, Portugal. E-mail: rui.
[email protected]
© 2017 John Wiley & Sons Ltd Journal of Computer Assisted Learning
when there is a growth of the higher education population is difficult to resolve and motivates an adaptation of the traditional teaching methods (Boavida 2010). Mastery Learning (ML) is a teaching–learning model that assumes that the individualized education leads to better learning than usual groups-based learning. The concept of ML dates back to 1963, when John Carroll assumed the radical position that fitness, and even more than intelligence, is a measure of the amount of time necessary for a person to learn, suggesting that all students are able to achieve the same degree of learning, if the time and sufficient learning opportunities are provided (Carroll 1963, 1989). It is based on this optimistic view that all students can learn any subject that Benjamin Bloom developed his ML theory (Bloom 1968). From 1
R.C. Paiva et al.
2
the perspective of Bloom, the variability of the performance levels of students in ‘traditional education’ is explained by the fact that teachers teach the same content in the same way to all students of a group in a given period of time. The second key feature of the ML is the alignment of targets (Guskey 2001, 2007). All three components of education, including learning objectives, teaching and evaluation should focus on the same goal. For example, if a teacher expects his students to learn a certain subject, he should provide a reasonable number of opportunities for them to practice it during the education process. The final evaluation should also evaluate the proficiency of the students. Another unique feature of the ML is frequent testing and the establishment of a mastery criterion, where a student can only advance to the next level if he or she achieves the established mastery criterion (Slavin 1987). The ML can be implemented in two different ways: Learning for Mastery (LFM) and Personalized System of Instruction (PSI). Developed by Bloom himself, LFM involves small groups of about 30 students, where the teacher is the main manager of knowledge and time for each step. Although LFM is more widely used because of its adaptability to conventional classrooms where teaching time and curriculum are relatively fixed, it is more difficult to ensure that all students in a group receive sufficient amounts of time and attention (Guskey and Pigott 1988). The PSI was conceived in 1968 by Fred Keller to mitigate this problem. The main idea is based on learning through small modules of teaching materials of autonomous study, rather than directly through the teacher (Fox 2004). The classes are complementary or additional in PSI, because unlike classes, which occur only at certain times, learning materials can be accessed by students the number of times they require. The students perform formative assessments when they consider
themselves prepared. Each module has a number of training assessments, similar but not identical, that can be done by students until they reach the mastery criterion (Slavin 1987). In PSI, the individualized feedback and answering questions of the students are ensured by several teachers or assistants. The main differences between LFM and PSI are shown in Table 1 (Kulik et al. 1990). The effectiveness of the ML can be influenced by several factors that can even jeopardize its applicability. Among the main adverse factors are the need to spend more time in teaching, self-discipline of students and the inconvenience of the more advanced students have to wait for their peers. One of the main criticisms of the ML is the time required for feedback and corrections of students be substantial, preventing the teaching of the curriculum on time. On the other hand, for all students to achieve the level of mastery provided at each level in time, it requires self-discipline. In this case, the younger students are at a disadvantage. Older age of students in higher education enables the PSI in their courses to be more efficient once they have a greater self-discipline and individual initiative (Klecker and Chapman 2008). The theoretical basis of these concepts is from the scope of motivation theory and is related with self-regulation. In the social cognitive view, the self-regulation emphasizes the importance of self-efficacy beliefs, causal attributions and goal setting in regulating behaviour directed at accomplishing a task or activity (Bandura 1997; Eccles and Wigfield 2002; Pintrich and Schunk 1996; Schunk and Ertmer 2000; Schunk and Zimmerman 1997; Wigfield and Eccles 2000). Note, however, that the implementation of the PSI in higher education requires a considerable amount of time and effort required to design and organize the curricula. To mitigate the problem of waiting by the more advanced students, it is recommended to propose them more advanced challenges (Kazu et al. 2005).
Table 1. Differences between LFM and PSI
Class setting Pacing Instructional materials Correctives Duration Mastery criteria Grade level
LFM
PSI
Group based Teacher paced Teacher presented Individual/group tutorials 2–108 weeks Slightly lower Mostly pre-college
Individual based Self-paced Written Restudy materials Usually 1 semester Higher Postsecondary level
LFM = Learning for Mastery; PC = Personalized System of Instruction.
© 2017 John Wiley & Sons Ltd
Intelligent tutorial system
Although it has been proven the educational effectiveness of PSI in higher education, the dominant lecturetutorial teaching method has never seriously changed, and PSI has fallen into disuse (Rae and Samuels 2011). Fox (2004) states that by 1979 there were close to 3000 publications on PSI, mostly reporting its remarkable success and no less than 5000 PSI courses known to be in existence. Between the reasons for the fall of PSI are the adverse factors described above, the greater time of initial development needed for its courses and the difficulty of adapting self-paced courses to the academic calendar (Elton and Bridge 1977; Rae and Samuels 2011). The Information and Communication Technologies (ICT) have a great potential for any individualized teaching program (Rae and Samuels 2011). The term Computer-Aided PSI (CAPSI) was introduced by Kinsner and Pear (1988) to describe the course they have developed at University of Manitoba in Canada in 1983. It is currently being used at several educational institutions for psychology courses and is referred to webCAPSI.1 Their main use of ICT is to deliver and manage the formative testing feature of PSI. The development of the ICT that we had in recent years has facilitated the implementation of the model PSI of ML in other subject areas of higher education (Wong and Kang 2012). In particular, over the last decade, there was a considerable effort to develop software which automatically assesses student’s answers to questions (Gardner et al. 2002; Kim et al. 2015; Sangwin 2013, 2016). For mathematics, it was reported recently that the transcription of paperbased mathematics examinations into an electronic format is feasible for a significant proportion of the questions as currently assessed (Sangwin 2016). With respect to the impact of e-assessments in mathematics, the majority of the studies show that e-assessments with formative feedback contribute to student learning and improve student performance on the final course exam (Varsavsky 2004; Roth et al. 2008; Ruokokoski 2009; Rasila et al. 2010; Angus and Watson 2009; Huisman and Reedijk 2012; Rivera et al. 2013; White et al. 2014; Pacheco-Venegas et al. 2015.). Research confirms the positive effects of the implementation of the PSI pedagogy in mathematics and programming higher education by the use of video clips and e-assessments (Rae and Samuels 2011; Shafie et al. 2010; Kularbphettong et al. 2015). The MITO – ‘Online Interactive Training Modules’2 is a research and development project of the Polytechnic Institute of Leiria, originating from the Department of © 2017 John Wiley & Sons Ltd
3
Mathematics of the School of Technology and Management (ESTG). It was started in 2010 with the main objective of supporting the traditional teaching and distance learning of mathematics at the higher education level through the construction of interactive educational content. Paiva et al. (2015) present the project design features, its development and implementation, evaluation of the tools used and results of studies with the students involved in the project. This paper describes the design, development, implementation and evaluation of an intelligent online tutoring system (TS) (Chrysafiadi and Virvou 2013; Kularbphettong et al. 2015; Zhang et al. 2014) designed to teach or to remind math concepts essential for the integration of students of engineering, economics, management, among others, in mathematics higher education. The TS, which we developed in MITO platform, consists of small self-paced modularized units of educational contents including tutorial videos, notes and formative eassessments with personalized feedback. It was designed based on the PSI model of ML and can be implemented in any course requiring mathematical bases. In this sense, there is a mastery criterion established in each one of the modules. In addition, we present an experimental research on the impact of the imposition of a mandatory mastery criterion in the students’ engagement and performance in a course of Quantitative Methods of an undergraduate course. Our main contribution to the field is the build, the implementation and evaluation of the effectiveness of a TS based on PSI using a set of mathematical software that we thought to be among the most developed and promising for teaching mathematics. In fact, we do not know in this area any software suite with so many technical details, followers and projects under development (Paiva et al. 2015).
Tutoring system of Online Interactive Training Modules
In this section, we present the stages of analysis, design, development and implementation of the TS for preparation in basic mathematical proficiency. The TS focuses on the theme real functions of one real variable, and its design is based on the PSI model of the ML. Analysis
The main motivation for the creation of the TS was based on the existence of undergraduate courses in ESTG
R.C. Paiva et al.
4
receiving students with very different background in mathematics. This is considered one of the main reasons for the high failure rates and dropout checked in mathematics courses of undergraduate students. To answer this problem, it was required a solution based on self-study of mathematics bases, with formative assessment and automatic feedback.
Design
The main methodological idea in TS design was the PSI model of ML, namely the division of the subject into small modules of teaching materials for self-study. The experience in MITO with the use of mathematical software (Paiva et al. 2015) was fundamental to decide that the TS would be constituted by theoretical notes, video lectures, step-by-step tutorial videos of exercises and parameterized tests with automatic assessment in computeraided assessment STACK (Sangwin 2007, 2013, 2016). The tutorial videos were produced using LaTeX code (Oetiker et al. 2011) and possess the advantage of high quality images (Paiva et al. 2015). The theoretical notes consist in a written version of the video lectures. The goal is to allow students to write remarks directly in the theoretical notes when they are watching the video lectures. The step-by-step tutorial videos of exercises are interspersed with the video lectures. STACK is a computer-aided assessment package for mathematics, which provides a question type for the Moodle quiz. In order to give an idea of its advantages over the conventional tests of teaching and learning platforms like Moodle, we present some of its features. In STACK, it is possible to create questions dependent of parameters defined by the author. For example, we can generate a set of questions involving the function f(x) = a(x 3)2 + h where a ∈ { 3, 2, 1, 1, 2, 3} and h ∈ {0, 1, 2, 4, 5}. Therefore, there are 30 similar versions but not identical of this question. When a student opens a test with five questions of this kind, each question is chosen between the versions available in the database. As a result, it is possible to provide the student, with relative ease, a reasonable amount of training e-assessments. In STACK, students can submit their answer in the form of a mathematical expression. For example, the student can answer a question by entering a polynomial or a square root. Essentially, the mathematical expressions received are evaluated using the free software Maxima.3 This computer algebra system manipulates symbolic
and numerical expressions and allows establishing the mathematical properties of the student answers. This feature is particularly useful when the question has multiple correct answers. STACK includes multiple response tests to compare expressions, a syntax checker, an answer preview and gives feedback related to the student answer. This last feature helps to maintain student motivation and can facilitate the student’s reasoning process (Harjula 2008). In Figure 1, we present a STACK question involving the function f(x) = a(x 3)2 + h described above. This question has several correct answers, includes a random graph and exemplifies the formative feedback that accompanies the response. The random graph has 24 different versions corresponding to the variations of a and h. This feature results from an adaptation of the source code for Moodle and STACK developed in the framework of MITO (Paiva et al. 2015). Once chosen the types of resources that compose the TS, the next step was the choice of the topics to be covered by TS and its division into small modules. An evaluation carried out by teachers led us to choose the following topics of the chapter of real functions of one real variable: generalities, polynomial functions, module function, odd and even functions, exponential and logarithmic functions, limits, continuity and derivatives. These topics provided a division of the TS in seven levels with similar working time. The TS design step became completed with the adaption of the e-learning platform Moodle of MITO to display the contents of each module sequentially with a mastery level e-assessment at the end of each module. Additionally, it was considered essential to ensure the possibility of imposing restrictions on the advance to the next level by a mastery criterion and a good navigability among the contents. The adaptation of the platform was carried out using the modules available in Moodle site,4 with adaptations of the respective source code.
Development
The educational content developed for the seven TS levels include 30 video lectures associated with 119 step-by-step tutorial videos of exercises, theoretical notes and seven STACK formative e-assessment with resolution. Each level is organized sequentially with the video lectures followed by the corresponding tutorial video exercises and ends with a STACK formative e-assessment (see Figure 2). The formative e-assessments include more © 2017 John Wiley & Sons Ltd
Intelligent tutorial system
5
Figure 1 Example of a STACK Question.
Figure 2 Organization of a Tutoring System (TS) Level
than 30 similar versions, but not identical, of each question. The student writes the answer in algebraic form and receives immediate feedback with possible suggestions for assistance and video or notes/recommendations. When a student finishes an e-assessment, he or she can get a new e-assessment consisting of similar but not identical questions until reaches the desired mastery level. Tutoring system has the possibility of providing a task only after the previous one was completed. The passage to the next level can be conditioned by obtainment of a certain rating on the appropriate training test. These features fit with the fundamentals of PSI. To ensure an intuitive user guidance, the progress of a student in each level is shown by a progress bar (see Figure 3). © 2017 John Wiley & Sons Ltd
Additionally, the progress bar provides the teacher with a summary report of the student’s progress in each level. This feature allows the teacher intervention in the tasks where there are more difficulties.
Implementation and evaluation
The TS was implemented in the first semester of the academic year 2014/2015 in the discipline Quantitative Methods of the undergraduate course of Marketing at ESTG. With the goal of preparation in basic mathematical proficiency, the students used the TS combined with two e-assessments conducted in person (see Figure 4) and a written exam. We will give more details about this topic and present the evaluation of TS in the Methodology and Results sections.
R.C. Paiva et al.
6
Figure 3 TS Progress Bar. [Colour figure can be viewed at wileyonlinelibrary.com]
Figure 4 e-Assessment Conducted in Person. [Colour figure can be viewed at wileyonlinelibrary.com]
Methodology
The research experience took place in ESTG during the first half of the school year 2014/2015 with 72 students of Quantitative Methods of an undergraduate course of Marketing. The TS was used by these students as a self-study tool and as a complement to regular classes. According to the fundamentals of PSI, one task should only be made available after the student achieves the desired level of mastery in the previous task. This is known as mastery criterion. To evaluate the effectiveness of this rule, the 72 students were divided into two similar groups through a random assignment technique (Creswell 2008): experimental group (EG) and control group (CG). Table 2 presents relevant information on the participants. The mastery criterion established for EG in each of the seven levels of TS was that a student could only advance to the next level after getting a grade not less
Table 2. General Information about the 72 Students of EG and CG No. of students Group EG CG
Female
Male
Total
Average age
18 19
17 18
35 37
18.5 18.4
EG = experimental group; CG = control group.
than 60% in the formative test of the current level. Otherwise, he or she was unable to advance and receives instructions to do some more work and try again a similar but different formative test. The CG students did not have any restrictions on the access to content but received the same study recommendations and were recommended to obtain a grade not less than 60% in the formative tests at the end of the levels. In all of the seven levels of the TS, the © 2017 John Wiley & Sons Ltd
Intelligent tutorial system
7
students from EG and CG received deadline recommendations for achieving the mastery criterion. During one semester, both qualitative and quantitative data were gathered to evaluate the students’ opinion, engagement with the TS and the influence of the mandatory mastery criterion on the students’ performance. A total of 15 instruments were carefully designed, implemented and conducted. The instruments were evaluated relatively to validity following the content-related evidence method and internal structure method and relatively to reliability using Cronbach’s reliability test (Johnson and Christensen 2008). In all instruments, where the Cronbach’s reliability test is applicable, the final result for Cronbach’s alpha value was higher than 0.8, which validate them (Johnson and Christensen 2008). The data used to obtain the EG and CG involved a well-designed student survey and the Metacognitive Awareness Inventory (MAI). The survey (see student survey no. 1 in Table 3) was conducted before the beginning of the experience and measures the student level on math (SLM) and demographic characteristics. At the same time was carried out an inventory of metacognitive perceptions using the MAI instrument proposed by Schraw and Dennison (1994) in order to identify students’ perception on their learning skills and abilities, study habits, awareness of learning and cognitive processes among others. Another quantitative data resource used in the study was the platform records of EG and CG which held the interaction with the educational resources of TS. These data were used to obtain statistical results about students’ engagement with TS and how much the students of the two groups used it. Quantitative information about the student’s performance was obtained directly from the grades of seven formative e-assessments, two summative e-assessments and one written exam (see Table 4).
Table 3. Instruments Used to Obtain the EG and CG
Instruments
No. of questions
Answer scale
Cronbach’s alpha
52
Dichotomic
0.814
Metacognitive Awareness Inventory Student survey no. 1
9
EG = experimental group; CG = control group.
© 2017 John Wiley & Sons Ltd
Not apply
Table 4. Formative and Summative Assessments No. of questions 7 formative e-assessments 2 summative e-assessments 1 written exam
Diverse 7 and 8 12
Answer scale Open Open Open
According to Bandura (Bandura 1991), goal setting enlists evaluative self-reactions that mobilize efforts toward goal attainment. We relied on this assumption, to conduct the two summative e-assessments on the class one day after the proposed dates for the completion of levels 3 and 7. In this way, the first three levels were evaluated in the first e-assessment and the last four in the second. The written exam covered all the material of the seven levels. Table 5 presents the formative and summative assessments in their chronological order. With the purpose of gathering the student’s opinions about TS, a well-designed survey was conducted at the end of the experience (see student survey no. 2 in Table 6). A qualitative data resource was obtained by informal conversations conducted between the teachers and the students that participated in the experience.
Results
The Portuguese higher education system uses a grade scale from 0 to 20, which is also used throughout this Table 5. Formative and Summative Assessments Details Item Formative e-assessment of level 1 Formative e-assessment of level 2 Formative e-assessment of level 3 Summative e-assessment 1 Formative e-assessment of level 4 Formative e-assessment of level 5 Formative e-assessment of level 6 Formative e-assessment of level 7 Summative e-assessment 2 Written exam
Local
Weight
Outside the class
—
Outside the class
—
Outside the class
—
Class Outside the class
15% —
Outside the class
—
Outside the class
—
Outside the class
—
Class Class
15% 70%
R.C. Paiva et al.
8
Table 6. Student Survey No. 2 No. of questions Student survey no. 2
Part 1 Part 2
3 13
Part 3
1
Cronbach’s alpha
Answer scale
Not apply 0.822
Likert (5 options) Open opinion
Not apply
paper. The results of the survey no. 1 and of the MAI show that CG and EG are statistically similar. In Table 7 are shown the results for normal homogeneity of the SLM of EG and CG. Because the normal distribution requirements for the homogeneity test are verified and its p-value is higher than 0.05, we may conclude that CG and EG are statistically homogeneous with respect to SLM (Box et al. 2005). The random assignment technique used in the selection of the elements of each group ensures the homogeneity in the other characteristics that may be relevant to the experience (Creswell 2008). The averages on the 52 items of the MAI instrument (Schraw and Dennison 1994) shown in Table 8 indicate that an overall statistical uniformity exists in the two groups in students’ perception of their own learning process and study strategies (Box et al. 2005). To evaluate the students’ engagement on TS, we use the number of clicks on the contents and the grades of the seven formative e-assessments of TS. Each one of the variables verifies the requirements on normality for
Table 7. Results for Homogeneity Test on SLM of CG and EG (0–20 scale) Group
N
Score mean
Standard deviation
p-Value
EG CG
35 37
12.75 12.8
2.4 2.6
0.9328
the tests below. Table 9 indicates that there is not statistical uniformity in the number of clicks on the TS in the two groups (p < 0.0001). The mean of accesses was statistically higher in EG than in CG. The average grade of the seven formative eassessments is shown in Table 10 together with results of the normal homogeneity test. Because the p-value for the homogeneity test is much lower than 0.05, we may conclude by conventional criteria that EG and CG are not statistically homogeneous on the grades of the seven formative e-assessments. The EG had an average grade significantly higher than CG. We compare now the grades on summative assessments of EG and CG. The results for normal homogeneity are shown in Table 11. Each one of the variables verifies the requirements on normality for the tests.
Table 9. Results on the Number of Clicks for Each Group Group
N
Mean
Standard deviation
p-Value
EG CG
35 37
1002.36 757.92
123.4 131.2