Noname manuscript No. (will be inserted by the editor)
Interactive Hierarchy-Based Auditory Displays for Accessing and Manipulating Relational Diagrams Oussama Metatla · Nick Bryan-Kinns · Tony Stockman
Received: date / Accepted: date
Abstract An approach to designing hierarchy-based auditory displays that supports non-visual interaction with relational diagrams is presented. The approach is motivated by an analysis of the functional and structural properties of relational diagrams in terms of their role as external representations. This analysis informs the design of a multiple perspective hierarchy-based model that captures modality independent features of a diagram when translating it into an audio accessible form. The paper outlines design lessons learnt from two user studies that were conducted to evaluate the proposed approach. Keywords Auditory Displays · Diagrams · Hierarchies · Representational Models · Multiple Perspectives · Accessibility · Interaction Strategies 1 Introduction Interest in supporting non-visual access to visually represented information grew in parallel with early developments in Auditory Display research [12]. A major drive of such endeavours has been and still is the potential to support individuals with temporary or permanent perceptual and situational impairments. For O. Metatla School of Electronic Engineering and Computer Science Queen Mary University of London E-mail:
[email protected] N. Bryan-Kinns School of Electronic Engineering and Computer Science Queen Mary University of London E-mail:
[email protected] T. Stockman School of Electronic Engineering and Computer Science Queen Mary University of London E-mail:
[email protected]
example, [15] pioneered a sonification technique to display a line graph in audio by mapping its y-values to the pitch of an acoustic tone and its x-values to time. This approach to using sonification allows visually impaired individuals to examine data presented in line graphs and tables. But unlike line graphs and tables, which typically convey numerical data, relational diagrams can depict concepts that encode other types of information. Relational diagrams in the context of this paper refer to visual representations that could be classified as part of the family of Directed Graphs. That is, any diagram depicting sets of nodes, or vertices, which are ordered through a set of paired connections called arcs, directed edges or relations [10]. This family of diagrams is commonly encountered in everyday life as much as in education and the workplace. For example, railway networks, underground maps and bus routes are often depicted as connected nodes, and visual programming languages and modelling notations often use nodes-andlinks diagrams to represent constructs and relations between them. Defining a direct mapping between the information represented through these kind of visualisations and acoustic dimensions such as pitch or amplitude may not be appropriate to convey the information they encode. The challenge is therefore to develop other intuitive models to support non-visual access to the encoded information. A relational diagram could be accessed in audio through a spoken description of its content. Indeed, a number of existing guidelines for providing non-visual access to web content emphasise that graphic elements should be accompanied by descriptions of their content, which can be stored in the ALT attribute on the IMG element in HTML [24]. A user accessing a web page through a screen-reader could detect the ALT-text at-
2
tribute and have the accompanying description read out in speech or Braille. There are, however, computational differences between using sentential and diagrammatic representations which are likely to translate to spoken text [cf. 13]. Accessing diagram content by passively listening to its description imposes a linear presentation of the information it depicts, which could make it difficult to search for, locate or compare different parts of the represented information; a difficulty that could only increase as the complexity of the diagram increases. The aim of the work presented in this paper is to describe the design of an approach that breaks the linearity of spoken diagram descriptions by capturing and hierarchically structuring the essence of the information they represent, then providing the user with interactive control over the way it is auditorally displayed.
2 Background Current approaches to supporting non-visual interaction with relational diagrams employ one or a combination of two distinct models of representation; Spatial or Hierarchical. The two models differ in the degree to which they maintain the original representation when translating its visual content [20], and hence produce dramatically different non-visual interactive displays.
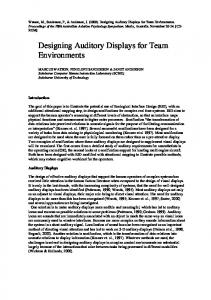
2.1 Spatial Models A spatial model allows non-visual access to a visual display by capturing the spatial properties of its content, such as layout, form and arrangements. These are preserved and projected over a virtual or a physical space so that they could be accessed through alternative modalities. Because audio has limited spatial resolution [4], spatial models typically combine the haptic and audio modalities to support user interaction. The GUIB project [33] is one of the early prototypes that employed a spatial model of representation to support non-visual interaction with a visual display. The prototype combines braille displays, a touch sensitive tablet and loudspeakers to allow blind users to interact with MS Windows and X Windows graphical environments. More recent solutions adopting the spatial model of representation typically use tablet PC interfaces or tactile pads as a 2D projection space where captured elements of a visual display are laid out in a similar way to their original arrangements (e.g. Figure 4(a)). Other non-visual solutions employing a spatial model of representation use force feedback devices as a controller. In such instances, the components of a visual
Oussama Metatla et al.
(a) Pie chart
(b) A PHANTOM Omni
Fig. 1 Example prototypes of non-visual interfaces employing a spatial model of representation for accessing (a) pie charts [32]. (b) A haptic device.
display are spatially arranged on a virtual rather than a physical plane, and can thus be explored and probed using a haptic device such as a PHANTOM Omni device1 (Figure 1(b)). The advantage of using a virtual display lies in the ability to add further haptic representational dimensions to the captured information, such as texture and stiffness, which can enhance the representation of data. The virtual haptic display can also be augmented and modulated with auditory cues to further enhance the interactive experience [1, 34].
2.2 Hierarchical Models A hierarchical model, on the other hand, preserves the semantic properties of visual displays and presents them by ordering their contents in terms of groupings and parent-child relationships. Many auditory interfaces are based on such a model as they inherently lend themselves to hierarchical organisation. For instance, phonebased interfaces support interaction by presenting the user with embedded choices [14], and the inherent hierarchical structure of Algebra expressions has been exploited to make them accessible in audio through a combination of earcons and prosody [29]. Audio is thus the typical candidate modality for non-visual interaction with visual displays when using hierarchies. There are a number of reasons why hierarchical models maybe more suitable for accessing relational diagrams in audio. First, theoretical accounts suggest that perceptual representation is hierarchically organised such that visual form is analysed at, at least, three levels of organisation; an overall whole, then moving down to multisegment parts, before considering basic features [23]. According to this view, features of a visual form are selectively grouped together as perceptual units on the basis of connections, importance and contextual relevance. Such top down organisation could thus be captured through hierarchical groupings. In the realm of sounds, these accounts are supported by principles of 1
Sensable Technologies, http://www.sensable.com
Interactive Hierarchy-Based Auditory Displays for Accessing and Manipulating Relational Diagrams
Auditory Scene Analysis (ASA), which describes auditory perception in terms of organisational Streams that are used by the auditory perceptual system to construct meaningful elements through grouping principles [6]. Second, a hierarchical organisation supports the notion that obtaining an overview should precede exploratory interaction with a given dataset; a process expressed by the Visual Information Seeking Mantra as: “overview first, zoom and filter, then details-on-demand” [27], and extended to the auditory domain through the Auditory Information Seeking Principle of: “gist, navigate, filter, and details-on-demand” [37]. By definition, a hierarchical structure could provide such structured organisation by enforcing a top down approach to present different levels of details at each hierarchical level. One of the early examples that used a hierarchical model to translate visual displays into a non-visually accessible representation is the Mercator project [19]. Like the GUIB project, the goal of Mercator was to provide non-visual access to X Windows applications by organising the components of a graphical display based on their functional and causal properties rather than their spatial pixel-by-pixel on-screen representations (Figure 2).
3
conveying relational information through a hierarchy. To this end, [3] developed and contrasted two alternative navigation strategies for exploring schematic heating systems diagrams in audio; a hierarchical strategy, which emphasised structure, and a connection-based strategy, which emphasised relations. His findings showed that different types of tasks are best supported by a matching navigational model, and that augmenting the hierarchical model with information about spatial positioning – in the form of earcons – provided no advantage in exploration tasks. In [7], models of hierarchical visual perception [23] are used explicitly as a motivation for developing a hierarchical model for non-visual interaction with diagrams. Their evaluations showed that grouping of diagram components such that implicit features in data are made explicit reduced memory loads, and that allowing both hierarchical and connectionbased browsing of molecular diagrams was most useful. As with the TeDUB system, however, participants in their study found it hard to orient themselves and remember their position on the hierarchy, particularly when identifying previously visited nodes.
3 Analysis of Relational Diagrams In order to translate a relational diagram into a hierarchical form, we propose an analysis that examines two fundamental questions. First, which information about the diagram should be captured when translating it into a hierarchy. Second, how should the captured information be hierarchically structured. The following analysis addresses these two questions by examining the functional and structural properties of relational diagrams. Answering the above questions should clarify how relational diagrams encode information, which then provides insights into the design of a hierarchical model that captures such characteristics. Fig. 2 [19]’s hierarchical model of an xmailtool GUI.
3.1 Functional Properties The TeDUB system [11] combined hierarchical and spatial models of representation to provide non-visual access to technical drawings such as circuit diagrams and floor plans. User evaluations of TeDUB showed that using hierarchical groupings reduced demands on shortterm memory and facilitated overviewing, though the way in which information was hierarchically structured was found to cause issues of orientation and made the identification of information about related items on a given diagram difficult. [3] extended the TeDUB approach by investigating non-visual strategies specific to nodes-and-links diagrams and addressing the issue of
Relational diagrams are a form of external representation. That is, they capture and represent information that is accessible through perception and are essentially carriers of information rather the information itself [22]. [22] argues that the way information is carried by external representations is as important to the achievements of a task as the information that resides in the mind of the individual solving the task. Similarly, [28] asserts that external representations assist the human capabilities by changing the nature of the task so as to make its solution transparent.
4
Oussama Metatla et al.
[13] examined the differences between solving problems using equivalent sentential and diagrammatic representations and concluded that diagrams eased searching for information through spatial indexing, and facilitated recognition by making implicit features explicit. [13] reported no evidence for differences between sentential and diagrammatic representations in terms of easing inference, but this finding is contested by a number of views. For instance, [26] uses the term inferential free-rides to describe how diagrams automatically include the representation of some conclusions that could be easily inferred when solving syllogisms, and [2] demonstrates that solving double disjunction problems, where a reasoner has to bear in mind various possibilities, is significantly quicker when using diagrams. Additionally, [9] describes reasoning with diagrams as a two stage process, involving first constructing the required diagram and then reading off relevant conclusions, and [25] write that “diagram production and comprehension are intimately related” (p.208). According to these views, not only is inference eased with diagrams, but it is also linked with the ability to actively construct and manipulate diagrams. Thus, the following are important functional properties that make diagrams a useful form of external representation:
Monday, 21 June 2010
– Search. Diagrams make searching for related items easy by grouping them using locational indexing. – Recognition and Inference. Diagrams make implicit features of the information explicit, rendering certain conclusions more apparent than others. – Interactivity. Inference is best supported when diagrams are interactively accessed and manipulated. 3.2 Structural Properties [35] developed a taxonomy that unifies a variety of external representations under a common form known as Relational Information Displays (RIDs). RIDs are displays which represent relations between dimensions, and include various forms of diagrams such as line graphs, bar charts, maps and tables. [35]’s taxonomy has been used to analyse the structural properties of various displays [36, 35] and can thus serve as a means for analysing the structural properties of relational diagrams in order to determine which information should be captured and modelled into a hierarchy. At the core of this taxonomy is the analysis of RIDs in terms of Scale Types and Dimensional Representations. 3.2.1 Scale Types According to [35], dimensions are the basic structures of RIDs. In general, values along a given dimension are
related to each other through a particular mathematical property to form the scale of that dimension. [30] identified four major scale types that are commonly used today to measure any physical or abstract property of a dimension; these are nominal, ordinal, interval and ratio scales.
R1
R1
A
B
L1
R2
X
A
B
L1
X
A
L1 R2
R2
X
(2) diagram. Fig. (1) 3 An example of a relational
R1
B (3)
Applying a scale types analysis to the relational diagram in Figure 3, it is possible to conclude that the diagram represents items using nominal scales. That is, items on the diagram can be distinguished from one another on the basis of at least two categories, Names (or Labels) and Shapes. The nominal scale Names distinguishes between six categories of items – albeit only one item per category – “A”, “B”, “X”, “R1”, “R2” and “L1”, while Shapes distinguishes between four categories of items or types of shapes; {A, B }, {R1, R2 }, {X } and {L1 }. 3.2.2 Dimensional Representations Dimensional representations refer to the implementation of the scale types using different physical tokens such as texture, distance, direction, etc. [35]. For example, the category type of {A, B } on the diagram shown in Figure 3 is implemented using textured circular shapes, while the category type of {R1, R2 } is implemented using a textured geometrical shape that combines a line and a triangle to form arrows and directions. Different colours and shapes on a relational diagram could implement different categories of items, and could also be used to represent other properties, such as size to distinguish between magnitudes, just as different textual markings could distinguish between different items within a particular category. There are two implications to this analysis. First, the fundamental information conveyed through a given relational diagram resides in its scale types rather than the dimensional representations implementing them. That is to say, it is possible to use different shapes, colours and labels to represent the same categories on a given scale type while still preserving the represented relational information of the diagram. For example, diagrams 3 and 4(a) use different physical implementations for each category type; star and diamond shapes
Interactive Hierarchy-Based Auditory Displays for Accessing and Manipulating Relational Diagrams
instead of circles and rectangles for the nodes, and dotted or zigzagged lines instead of straight lines for the links or connections, yet the two diagrams remain informationally equivalent. With this in mind, it is possible to consider the information represented through a given relational diagram as two sets of features:
(a)
(b)
Fig. 4 Informationally equivalent relational diagrams.
– Modality independent features, captured through the scale types without being specific to any particular modality of presentation, and – Modality dependent features, captured through the dimensional representations of the scale types and, in the case of visual diagrams, implemented using features that are accessed through visual apparatus. Second, unless spatial location is itself a represented dimension, varying the spatial distribution of the dimensional representations does not affect the represented relational information. For example, diagrams in Figures 3 and 4(b) are informationally equivalent even though diagram items are placed at different locations. Thus, in answer to the question raised earlier, we propose to capture the former sets of features when translating a relational diagram from the graphical to an alternative form. Capturing modality independent features should preserve the essence of the represented information without being specific to any modality of presentation. The captured information can then be implemented using alternative structural tokens that are appropriate to the modality of translation. Next we address the second question of how the captured information could be hierarchically structured to support auditory interaction.
4 Hierarchical Modelling 4.1 Scale Type Perspectives We thus use the scale types represented by a given relational diagram as an organising factor for capturing its content. For instance, the relational diagram on Figure 3 represents information using the nominal scales
5
Names and Shapes and its content could thus be described from the perspectives of the information associated with each value on such scales. Essentially, given a value on a represented scale type, it is possible to determine which relational information could be implied from it and hence produce a description of such information from the perspective of that value. This is illustrated on Figure 5, which shows the relational information that is captured from the perspective of each value on the shapes and names nominal scale types. Organising a diagram’s description using its scale types has two main characteristics. First, each instance on a given scale type (as numbered on Figure 5 ) emphasises certain aspects of the diagram while overlooking others. For example, the information captured from the perspective of the category type {R1, R2 } – instance (3) – which could be described as: “connection R1 from A to B, connection R2 from B to X”. This emphasises the the connections between nodes A and B and between B and X while overlooking the connection L1 between nodes A and X. Second, the same relational information is captured from more than one perspective. For example, the information associated with the connection L1 is captured from the perspective of the category type {A, B } – instance (1) – which could be described as: “A pointing to B via R1, A connected with X via L1, B pointing to X via R2”, as well as from the perspective of the category type {L1 } – instance (4): “connection L1 linking A and X ”. Since each perspective describes a particular set of values on the represented scale type and overlooks others, all perspectives should be somehow combined within a single model to provide access to a more complete “picture” of the modelled diagram. 4.2 A Multiple Perspective Hierarchy-Based Model What is noticeable from examining modality independent features of the relational diagram shown in Figure 5 is that they lend themselves to hierarchical organisation. Specifically, the nominal scale Shapes could be used to group together similar values on the nominal scale Names. For instance, the values “A” and “B” on the Names scale form the category type {A, B } on the Shapes scale because both values are implemented using the same dimensional representation; a circular shape. Similarly, the values “R1” and “R2” form the category type {R1, R2 } because they are both implemented using directional arrows, and so on. This relationship between the two nominal scales could be exploited to create hierarchical groupings as shown in Figure 6. In this structure, values of a given nominal scale occupy a unique branch on a hierarchy
2010
6
Oussama Metatla et al.
R1
R1
A
B
R1
A
B
L1
R2
B
L1
R2
R1
X
R1
A
B
R1
A
A
B
L1
R2
X
X
X
(5) Perspective of “A”
B
(7) Perspective of “X”
(6) Perspective of “B”
A
R1
(4) Perspective of type {L1}
L1
R2
R2
R1
Names
A
B
L1
R1
X
A
B
L1 R2
R2
L1 R2
X
X
(8) Perspective of “R1”
Shapes X
(3) Perspective of type {R1, R2}
B
L1
L1
R2
X
(2) Perspective of type {X}
A
B
L1
R2
X
(1) Perspective of type {A, B}
R1
A
(9) Perspective of “R2”
(10) Perspective of “L1”
Fig. 5 Diagram content as captured from the perspective of each value on the Names and Shapes nominal scales. Grey shaded elements show items that are overlooked by a given perspective. Thursday, 24 June 2010
to group together information about individual values within corresponding scale types. Thus, the more categories there are in a relational diagram (i.e on the Shapes nominal scale) the more branches there would Type 1 be at level 1 of such a hierarchy, and the more items there are within a particular category type (i.e on the Names nominal scale) the more branches there would R1 A be at level 2 of the hierarchy. B
Type 3
L1
R2 Level 0
Level 1
Shapes
X
Level 0
Level 1
Level 2
Level 3 R1
A
L1
Level 4
B
X
Type 1 R1
B
Type 2
X
Type 3
L1
Diagram
R2
L1
A X
A
A
Level 2
X
Names B
Type 4 Type 1 Type 1
Type 2
X
R2 B
A
B
A
Type 4
B R1
R1
A
L1
Type 3
Type 2
X
Type 3
L1
Diagram
R2
X
Fig. 7 Multiple perspective hierarchy.
Type 4
R1
Type 2
Type 4
Saturday, 26 June 2010
R2
Fig. 6 Hierarchical grouping of represented scale types.
Using these levels of hierarchical groupings, diagram items are indexed on the basis of their scale types and could be searched and explored by navigating through
such a structure. Once located on the hierarchy, the relational information associated with each value of the grouped scale types is then attached to it as shown in Figure 7. For instance, it is possible to locate the category type {A, B }, then proceed to the value “A” within that group, then explore the relational information associated with “A”, which in this case includes a connection “R1” that points to “B” and a connection “L1” that links “A” and “X”. Thus, the diagram descriptions associated with each perspective are spread
Interactive Hierarchy-Based Auditory Displays for Accessing and Manipulating Relational Diagrams
across the various levels of this structure; e.g “a circular node (level 1) “A” (level 2) connected via a relation “R1” (level 3) to a circular node “B” (level4)”. The result is a multiple perspective hierarchy that organises the information encoded in a given relational diagram through grouping using scale types as an index. The proposed model can support auditory access to the content of a relational diagram by allowing a user to navigate through such a structure and displaying auditory feedback that convey information about encountered items. Using this model, a user should be able to interactively explore diagram content as captured through the perspectives of the represented scale types. That is, rather than being constrained by a linear presentation of a diagram’s description, the user can be in control over which part of the description they wish to be displayed as they explore the hierarchy.
5 Interaction Strategies and Design Lessons We developed two presentation strategies and two construction strategies to support audio-only access and manipulation of relational diagrams through the hierarchical model described above. We then conducted two user evaluations with sighted individuals in lab-based settings to investigate whether the developed model provides a practical means for inspecting and constructing relational diagrams in audio. Inspecting diagrams in audio was considered to be the ability to search through the hierarchy, locate content and correctly interpret its auditory presentation. Constructing diagrams in audio was considered to be the ability to both inspect and alter such content. The details of the design of these strategies as well as the quantitative analysis of the results obtained are reported elsewhere [17, 18]. Here, we briefly describe these strategies and focus on outlining 8 design lessons learnt from the evaluations of prototype systems that implemented them 2 .
5.1 Audio Presentation Strategies We referred to the two presentation strategies as a Highverbosity and a Low-verbosity strategy. The two strategies differed in the amount of speech and non-speech sounds used to display information. These differences are summarised in Table 1. The high-verbosity strategy used speech as the main means for conveying information, whereas the low-verbosity strategy combined 2 Audio-visual examples of the developed strategies can be found here: http://www.eecs.qmul.ac.uk/~oussama/media. html.
7
speech and non-speech sounds. The aim of the first study, reported in [17], was to contrast the two presentation strategies in order to explore their impact on the activity of inspecting relational diagrams through a hierarchy-based mode. Visually accessible hierarchical structures tend to convey a wealth of information that assist users when navigating and inspecting the information they represent. For example, the menu structures found on computer file explorers and application menus typically show not only the currently selected menu item, but also its depth position within the list of sibling items, the size of such a list, the parents menu items’ positions and depth, and so on. All such information would be lost if the highlighted menu item is simply spoken. Lesson 1 – Convey three types of information. Three types of information should therefore be communicated to the user when a hierarchy-based model is presented in audio; content, navigational, and contextual. This should help capture the richness of information that is contained in a hierarchical structure. Further reflections and design lessons specific to each type of information is described below. Content information communicates the content of a hierarchy’s nodes when they are encountered by a user. On a visual hierarchy, a node’s content is typically conveyed using textual labels, but also using iconic images or a combination of text and images. As shown in Table 1, the high-verbosity display strategy used speech to convey both types of content information. The lowverbosity strategy on the other hand used speech to display textual content and parameterised auditory icons [8] to display iconic content in the form of parameterised auditory icons. The parameterised auditory icons were designed to mimic the sounds of drawing an arrow on a chalkboard. Connection types were conveyed using different timbres while arrow directions were conveyed by combining a short and a long sound of that same timbre. The short sound represented the arrow head and the long sound represented its tail. Lesson 2 – Use non-speech sounds to display iconic content. Using timbre to display relation types and varying the order of the short and long sounds to display a relation’s direction was more intuitive than using speech to display iconic content. Specifically, participants in our study reported in [17] found it easy to infer the direction of a relation from its non-speech representation commenting that: ”[relations] sounded just like how they would have been drawn”. Related to this is the observation that, when asked to retrieve a relation’s type
8
Oussama Metatla et al.
Table 1 Three types of information conveyed through a hierarchical structure and their speech and non-speech audio presentation. Bolded text highlights the major differences between the two audio presentations modes. Quoted text refers to speech output. Bracketed text refers to non-speech output where (e:) = earcon, (pai:) = parameterised auditory icon. Information Type Navigational Information 1) Expand a branch 2) Collapse a branch 3) Browse nodes 4) Reaching end of list 5) Illegal moves Content Information 6) Class name 7) Relation name 8) Arrow type 9) Arrow head 10) Arrow tail Contextual Information 11) Branch
High-Verbosity
Low-Verbosity
“ Opened” “Closed ” (e:Browse Sound) “” (e:End of List Sound)“” (e:Error Sound)
“” (e:Expand Sound) (e:Collapse Sound) “” (e:Browse Sound) “” (e:End of List Sound) “” (e:Error Sound)
“” “” “” “” “”
“” “” (pai:Arrow) (pai:Arrow Head) (pai:Arrow Tail)
“”
(Continuous ambient sound)
and direction from the hierarchy, most participants who listened to non-speech relations drew their answers correctly, while those who listened to spoken descriptions struggled to infer directions. Describing iconic content of relational diagrams in speech should be avoided and replaced with equivalent non-speech sounds.
orientation within the hierarchy. Sounds communicating feedback about expected events (moving between nodes, expanding and collapsing branches) were mostly appreciated for the added aesthetics and therefore should not be excluded unless they interfere with other sounds in the interface.
Navigational information communicates cues about the outcome of a user’s navigation actions on the hierarchy. Expanding a node on a visual interactive hierarchical structure is typically followed by the visual display of its children branching out of the expanded node. This display communicates the fact that the expansion of a branch was successful. Similarly, successful movements between nodes on a visual hierarchy is typically conveyed by highlighting nodes in accordance with user’s movements to indicate the displacement of position from one node to the next. This information is lost when using non-visual means to interact with hierarchies and should therefore be explicitly conveyed. As shown in Table 1, the two audio presentation strategy that we developed combined one-element earcons [5] and speech output to covey movements between nodes, reaching the end of a list and highlighting illegal moves. The high-verbosity strategy used speech to convey the expansion and collapse of a branch, whereas the low-verbosity mode used one-element earcons to convey the same information.
Contextual information communicates cues about the context of the current node in relation to the rest of the hierarchy. Again, when interacting with a visual hierarchy, it is possible to infer information about the parent(s) of the current node, its depth within the hierarchy as well as its position within the current list of children by simply looking at the expanded position of the node of interest. This information is, again, lost when a hierarchy is displayed in audio or harder to infer if nodes content is simply displayed in speech. The prototype system that we implemented used audio to convey one specific type of contextual information; feedback about the parent branch of the current node. In the high-verbosity strategy, we used a spoken description of such context information to describe the immediate parent of the current node. Users could request such information at any moment during their interaction. This was compared to the low-verbosity strategy where we used ambient sounds with distinctive timbres that displayed continuously while the user browsed a particular branch of the hierarchy.
Lesson 3 – Emphasise the occurrences of unexpected events. The occurrence of unexpected events should be explicitly highlighted; users in our study found the sounds used to highlight reaching the end of a list and the occurrence of an illegal move particularly useful for
Lesson 4 – Avoid displaying context using spoken descriptions. Contextual information should be conveyed through less intrusive means than spoken descriptions, particularly when lengthy messages need to be displayed. In the case of our evaluations, lengthy context messages
Interactive Hierarchy-Based Auditory Displays for Accessing and Manipulating Relational Diagrams
pushed users to avoid requesting such information all together. Lesson 5 – Use ambient sounds to convey transition between hierarchical branches. Users in our evaluation were more aware of the continuous ambient sounds at points of the interaction where they switched perspectives. Mapping the timbre of such sounds to match the hierarchical branch was thus an effective means to convey context, but the ambient sounds were more effective at communicating transitional information and should therefore be gradually faded out to a minimum amplitude when user movements are limited within a single branch. Lesson 6 – Constrain navigational possibilities to reflect context. An additional feature that we found important to support users maintain awareness of context when interacting with a hierarchy was movements constraint. That is, constraining navigation possibilities in accordance with users location on the hierarchy. In particular, movements between cousin nodes should be disabled such that a user loops to the first child of a list rather than move to the next cousin node when reaching the end of such a list. Movement to parent nodes should also be constrained; to avoid confusion, the interface controller used to move to parent nodes should be different to the controller used to move to sibling nodes. For example, if a 4-way navigation controller is used to navigate the hierarchy such as a joystick or the keyboard cursor keys, then the functions of the keys for moving within the hierarchy should be mapped to match the layout of the hierarchy.
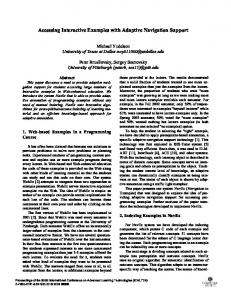
Guided Strategy. Editing relational diagrams using this strategy was supported through template matching, where a template is defined as the set of steps required to complete an editing action on a given diagram. The system in this case plays the role of an agent that assist the user through the execution of editing actions. The user invokes the system’s assistance by expressing the editing action they wish to execute (using the computer keyboard in the case of the developed prototype system), then following the system’s instructions to complete its execution. Figure 8 exemplifies this concept. When the user expresses a desired action, a series of system prompts are triggered, each requiring the user to supply more details about what they wish to achieve. By responding to each prompt, the user is essentially guided through the steps required to accomplish an editing action. This strategy therefore allows the execution of any action on any given item on the diagram without requiring the user to locate it within the hierarchy. That is, when editing an item on a diagram, the user is doing so away from and independently of the hierarchy.
I want to remove an item of type 1 Independent editing mode of interaction
User:
Which one?
(Invoke action)
System:
Independent Inspection mode of interaction Level 0
Level 1
(Request details)
Level 2
Level 3 R1
A
L1
R1
B
Type 2
X
R2
L1
B
Level 4
B
X
Type 1
Diagram
A
User: (Supply details)
X
A
A
Type 3
5.2 Construction Strategies
9
L1
System:
Done!
(Confirm execution)
X
Tuesday, 18 January 2011
Fig. 8 The Guided interaction strategy.
We referred to the two interaction strategies that we designed to support manipulation of relational diagrams through the hierarchy-based model as Guided and Nonguided strategies. The two strategies differed in the way they support the execution of editing actions that alter the content of a relational diagram. Note that in both strategies, content added onto the diagram is automatically structured into a hierarchy. That is, the user issues commands to create diagram content rather than branches and nodes, and the system dynamically updates corresponding parts of the hierarchy to reflect user’s edits. The aim of the second study, reported in [18], was thus to contrast and evaluate the usability of each interaction strategy in supporting this process. The following reflects on the design lessons learnt from these evaluations.
Lesson 7 – Manage transitions between interaction modes explicitly. The Guided strategy breaks the interaction into two independent modes; an editing mode and an inspection mode. Participants in our study reported in [18] executed various mode errors particularly when they switched their attention away from the auditory display and then back again. Care must therefore be taking to prevent the user from falling into mode confusion when using this strategy of interaction [21]. Explicit auditory cues should be designed to convey mode information; for instance, using a distinctive continuous ambient sound that conveys mode status, or other cues that are contingent to each mode, such that a user
18 January 2011
10
Oussama Metatla et al.
hears an accompanying sound with every keystroke to correspond to the current mode of interaction. Non-guided Strategy. The system in this strategy does not provide any explicit assistance to the user. To construct or edit an item in a relational diagram, the user must first locate it within the hierarchy before executing a particular editing action that alters its state. The completion of an editing action therefore depends primarily on the status of the hierarchy at the moment it is executed, and the user can directly perceive the changes in the state of the hierarchy as soon as the action is completed. Level 0
Level 1
Level 2
Level 3 R1
A
L1
Level 4
B
X
Type 1
Remove! R1
User
B
R2
User Type 2
X
Type 3
L1
Diagram
User
L1
A X
Combined Inspection and Editing modes of interaction
A
A
X
B
R1
A
Type 4
Fig. 9 The Non-guided interaction strategy. X R2
B
Figure 9 exemplifies this concept. In contrast to the Guided interaction strategy, there is no implied intermediary between the user and the hierarchy since the user is directly engaged with the hierarchy throughout the execution of any editing action. The Non-guided interaction strategy therefore eliminates multiple modes by combining them into one complementary and interdependent mode of interaction. Lesson 8 – Combine aspects from the Guided and Nonguided strategies to support editing diagrams through a hierarchy. Editing diagram content that is located in deeply nested nodes of the hierarchy is faster using the Non-guided strategy. The Guided strategy could be cumbersome in these instances because it takes longer to execute such actions, involving longer steps which could make it hard for users to keep track of the editing process. Users should therefore be allowed to specify multiple edits to the same local area of the hierarchy when using the Guided strategy. This way, the Guided strategy will function in a similar way to the Non-guided strategy with the added advantage of allowing flexibility in the execution of such actions from anywhere on the hierarchy. While the Guided strategy allows for flexibility when executing editing actions, it could make it difficult to
integrate newly added items with existing content. The Non-guided strategy situates participants within the content of the diagram, affording integration of new and existing diagram content, but at the cost of restricting movements within the hierarchy. Because of these trade-offs, combining the two strategies could provide greater usability. This could be achieved by tracking users editing actions and position on the hierarchy, the sequence of guiding steps could then be triggered if the action and location bare no relevance to one another; the non-guided process should proceed otherwise. 6 Discussion and Conclusions Overall, the work presented in this paper is based around the notion that information represented in relational diagrams is not necessarily “inherently” visual, and thus could be captured and translated into the auditory modality. Relational diagrams are “conveniently” visual as they rely on and exploit the highly sophisticated visual sense to decode and interpret information. Translating them into an alternative modality should therefore be driven by both understanding the underlying nature of the information they represent and considering the strengths and weaknesses of the target modality of representation. As pointed by [28], a representation assist the human capabilities by changing the nature of the task to match them. The work outlined in this papers follows this notion by proposing a two-stage approach to translating relational diagrams. Analysing their structural properties allows for an understanding of the underlining information conveyed through them (modality independent versus modality dependent features), while analysing their functional properties provides insights into the interactive possibilities that should be supported when manipulating them (in this case the ability to search through, locate and recognising information). The proposed model changes the task of searching for and exploring diagram content from a process that relies on locational indexing on a 2D plane to one that is based on browsing lists of grouped items. The use of a scale type indexing in this context is an attempt to impose a grouping structure that facilitates the process of searching for and locating information of interest and orientation around an auditory space. Indeed, orientation and navigation issues reported in related work [11, 7] could be due to the inconsistencies of the hierarchical structures used to organise diagram content. That is, the way diagram content are hierarchically organised in such systems depended primarily on the modelled domain where every new diagram yields different structure. Thus, the user would
Interactive Hierarchy-Based Auditory Displays for Accessing and Manipulating Relational Diagrams
have no prior knowledge of how diagram content will be grouped and where each of its elements will be located on the resulting hierarchy. Only when they browse to each construct of the hierarchy will such organisation be discovered and revealed. The approach developed in this paper attempts to address this issue by imposing a semi-fixed hierarchical organisation enforced by an indexing that allows a user to build accurate expectations of where diagram components will be located on the hierarchy. A diagrammatic representation is persistent in space, it could therefore serve as an external extension to memory and other cognitive processing mechanisms. Indeed, as reviewed in this paper, many of the advantages associated with using diagrams as a form of representation stem from the persistent character of graphical displays. The work presented in this paper showed that interactivity can play an important role in – at least partly – compensating for the transient nature of sound. The ability to play and replay an audio output allows the information it conveys to be revisited over and over again, thus playing a similar role to that of gazing at the same part of an interface more than once. But while the ability to control the replay of audio is important, it might not be enough if the auditory message is too long. For example, in the context of this paper, playing and replaying a spoken description of a complex relational diagram might be inconvenient to the user due to the linear nature of presentation. Linearity is also one of the main disadvantages associated with using screen-reader technology to access modern visual displays [31]. A hierarchical organisation of information can help overcome the disadvantages associated with the linearity of its auditory presentation. The use of scale type indexing instead of location indexing helped to change the nature of the task of searching and locating diagrammatically represented information when these are accessed in audio. Instead of searching in space, users search through lists, grouped together to capture the relational information in the original representation. The strength of hierarchically structuring information is thus in the organisation it imposes on the captured information which, when interactively accessed, can serve two functions that are important in any human-computer interface; 1) ceding control to the user to choose which parts of the information to interact with at any given moment, and 2) aiding orientation within the displayed information. 7 Future Work The proposed approach of using multiple perspective hierarchies to capture and structure information was
11
found to be effective for supporting audio-only interaction relational diagrams. Providing access to the same information from more than one perspective has previously been reported to be beneficial in non-visual interaction [3, 16]. However, besides support for orientation through increased expectation of where content is located on a hierarchy, it is not clear what other advantages are offered by the multiple perspective aspect of the developed model when compared to other approaches that use hierarchies to support non-visual interaction with graphically represented information. Future work should explore how the hierarchy-based model compares to other hierarchies, particularly those which employ factors other than scale types to organise and present information from one rather than multiple perspectives. Additionally, the hierarchy-based model translated relational diagrams that encoded nominal data. The audio display used to present the hierarchy was thus limited to conveying this particular type of data. The question remains as to how to use the model to capture and display diagrams that encode other types of data, including spatial data. For example, the hierarchical structure could be overlaid with auditory display techniques that convey data types associated with a specific item within a given category of items. Encountered items on a particular branch of the hierarchy could be accompanied by sonifications that convey quantitative dimensions associated with them, such as magnitude and ratio. Applying and evaluating the hierarchy-based model with diagrams that represent data on a variety of scale types is thus another important venue for future work. References (1) Avanzini, F., Crosato, P.: Haptic-auditory rendering and perception of contact stiffness. In: Haptic and Audio Interaction Design, vol. 4129/2006, pp. 24–35 (2006) (2) Bauer, M.I., Johnson-Laird, P.N.: How diagrams can improve reasoning. Psychological Science 4(6), 372–378 (1993) (3) Bennett, D.: Effects of navigation and position on task when presenting diagrams to blind people using sound. Diagrammatic Representation and Inference pp. 307–319 (2002) (4) Best, V., Van Schaik, A., Carlile, S.: Two-point discrimination in auditory displays. In: E. Brazil, B. Shinn-Cunningham (eds.) Proceedings of the 9th International Conference on Auditory Display (ICAD2003), pp. 17–20. Boston University Publications Production Department (2003)
12
(5) Blattner, M.M., Sumikawa, D.A., Greenberg, R.M.: Earcons and icons: their structure and common design principles. Hum.-Comput. Interact. 4(1), 11–44 (1989) (6) Bregman, A.S.: Auditory scene analysis: The perceptual organization of sound. MIT Press (1994) (7) Brown, A., Pettifer, S., Stevens, R.: Evaluation of a non-visual molecule browser. In: Assets ’04: Proceedings of the 6th international ACM SIGACCESS conference on Computers and accessibility, pp. 40–47. Atlanta, GA, USA (2004) (8) Gaver, W.W.: Using and creating auditory icons. SFI studies in the sciences of complexity. Addison Wesley Longman (1992) (9) Gurr, C.A., Lee, J., Stenning, K.: Theories of diagrammatic reasoning: Distinguishing component problems. Minds and Machines 8(4) (1998) (10) Harary, F., Norman, R.Z., Cartwright, D.: Structural Models: An Introduction to the Theory of Directed Graphs. John Wiley and Sons Inc (1965) (11) Horstmann, M., Lorenz, M., Watkowski, A., Ioannidis, G., Herzog, O., A1 King, A., Evans, D.G., Hagen, C., Schlieder, C., Burn, A.M., King, N., Petrie, H., Dijkstra, S., Crombie, D.: Automated interpretation and accessible presentation of technical diagrams for blind people. In: New Review of Hypermedia and Multimedia, vol. 10, pp. 141– 163. Taylor & Francis (2004) (12) Kramer, G.: Auditory Display: Sonification, Audification and Auditory Interfaces. Addison-Wesley Publishing Cmpany, Reading, MA, USA (1994) (13) Larkin, J.H., Simon, H.A.: Why a diagram is (sometimes) worth ten thousand words. Cognitive Science (1), 65–100 (1987) (14) Leplatre, G., Brewster, S.: Designing non-speech sounds to support navigation in mobile phone menus. In: P.R. Cook (ed.) Proceedings of the 6th International Conference on Auditory Display (ICAD2000). Atlanta, GA, USA (2000) (15) Mansur, D.L., Blattner, M.M., Joy, K.I.: Sound graphs: A numerical data analysis method for the blind. Journal of Medical Systems 9(3), 163–174 (1985) (16) McGookin, D., Brewster, S.A.: Soundbar: exploiting multiple views in multimodal graph browsing. In: NordiCHI ’06: Proceedings of the 4th Nordic conference on Human-computer interaction, pp. 145–154. New York, NY, USA (2006) (17) Metatla, O., Bryan-Kinns, N., Stockman, T.: Using hierarchies to support non-visual access to relational diagrams. In: BCS-HCI ’07: Proceedings of the 21st British CHI Group Annual Conference on HCI 2007, pp. 215–225. British Computer So-
Oussama Metatla et al.
ciety, Swinton, UK (2007) (18) Metatla, O., Bryan-Kinns, N., Stockman, T.: Constructing relational diagrams in audio: the multiple perspective hierarchical approach. In: Assets ’08: Proceedings of the 10th international ACM SIGACCESS conference on Computers and accessibility, pp. 97–104. Halifax, Nova Scotia, Canada (2008) (19) Mynatt, E.D., Edwards, K.W.: The mercator environment: A nonvisual interface to x windows and unix workstations. Tech. Rep. GVU Tech Report GIT-GVU-92-05 (1992) (20) Mynatt, E.D., Weber, G.: Nonvisual presentation of graphical user interfaces: contrasting two approaches. In: CHI ’94: Proceedings of the SIGCHI conference on Human factors in computing systems, pp. 166–172. Boston, Massachusetts, United States (1994) (21) Norman, D.A.: Categorization of action slips. Psychological Review 88(1), 1–15 (1981) (22) Norman, D.A.: Things That Make Us Smart: Defending Human Attributes in the Age of the Machine. Addison Wesley Publishing Company (1993) (23) Palmer, S.E.: Hierarchical structure in perceptual representation. Cognitive Psychology 9(4), 441 – 474 (1977) (24) Petrie, H., Harrison, C., Dev, S.: Describing images on the web: a survey of current practice and prospects for the future. In: C. Stephanidis (ed.) Proceedings of 3rd International Conference on Universal Access in Human-Computer Interaction (2005) (25) Scaife, M., Rogers, Y.: External cognition: How do graphical representations work. International Journal of Human-Computer Studies 45(2), 185– 213 (1996) (26) Shimojima, A.: Operational constraints in diagrammatic reasoning. In: Logical reasoning with diagrams, pp. 27–48. Oxford University Press, Inc., New York, NY, USA (1996) (27) Shneiderman, B.: The eyes have it: A task by data type taxonomy for information visualizations. In: VL ’96: Proceedings of the 1996 IEEE Symposium on Visual Languages, p. 336. IEEE Computer Society, Washington, DC, USA (1996) (28) Simon, H.A.: Cognitive science: The newest science of the artificial. Cognitive Science 4(1), 33 – 46 (1980) (29) Stevens, R.D., Edwards, A.D.N., Harling, P.A.: Access to mathematics for visually disabled students through multimodal interaction. Hum.Comput. Interact. 12(1), 47–92 (1997)
Interactive Hierarchy-Based Auditory Displays for Accessing and Manipulating Relational Diagrams
(30) Stevens, S.S.: On the theory of scales of measurement. Science 103(2684) (1946) (31) Stockman, T., Metatla, O.: The influence of screen-readers on web cognition. In: Proceedings of ADDW 2008, Accessible Design in the Digital World Conference. York, UK (2008) (32) Wall, S.A., Brewster, S.A.: Tac-tiles: multimodal pie charts for visually impaired users. In: NordiCHI ’06: Proceedings of the 4th Nordic conference on Human-computer interaction, pp. 9–18. New York, NY, USA (2006) (33) Weber, G.: Adapting direct manipulation for blind users. In: CHI ’93: INTERACT ’93 and CHI ’93 conference companion on Human factors in computing systems, pp. 21–22. Amsterdam, The Netherlands (1993) (34) Yu, W., Kangas, K., Brewster, S.A.: Web-based haptic applications for blind people to create virtual graphs. In: Haptic Interfaces for Virtual Environment and Teleoperator Systems, 2003. HAPTICS 2003. Proceedings. 11th Symposium on, pp. 318–325 (2003) (35) Zhang, J.: A representational analysis of relational information displays. International Journal of Human-Computer Studies 4, 59–74(16) (1996) (36) Zhang, J., Norman, D.A.: Representations in distributed cognitive tasks. Cognitive Science 18(1), 87–122 (1994) (37) Zhao, H., Plaisant, C., Schneiderman, B., Duraiswami, R.: Sonification of geo-referenced data for auditory information seeking: Design principle and pilot study. In: S. Barrass, P. Vickers (eds.) Proceedings of the 10th International Conference on Auditory Display (ICAD2004). Sydney, Australia (2004)
13