Interactive Image-Spectrum EELS: Application to Elemental. Mapping of Lubricant Colloids. Jean-Michel Martin(1), Jean-Louis Lavergne(1), Béatrice Vacher(1) ...
Microsc. Aficroanal. A1icrostruct. 6
(1995) 53-63
FEBRUARY
1995,
PAGE53
Classification
Physics Abstracts 07.80
-
82.80
-
82.70Dd
Interactive Image-Spectrum EELS: Mapping of Lubricant Colloids Jean-Michel
Application
to Elemental
Martin(1), Jean-Louis Lavergne(1), Béatrice Vacher(1) and Kyioshi Inoue(2)
(1)
Ecole Centrale de Lyon, Département de Technologie des Surfaces, Laboratoire de Tribologie et Dynamique des Systèmes, CNRS URA 855, F-69131 Ecully, France
(2)
Nippon Oil Company, Tribology R&D Division, 8 Chidori-cho, Naka-ku, Yokohama 231, Japan
(Received September 23,1994; accepted February 6,1995)
Résumé. 2014 La méthode image-spectre EELS consiste à faire l’acquisition d’une série d’images filtrées en énergie. Nous avons développé un logiciel pour cette application qui permet d’obtenir, après acquisition et de manière interactive, soit une image filtrée en énergie, soit un spectre EELS. L’avantage de cette technique, comparée à la méthode traditionnelle spectre-image en mode STEM, réside dans la détection parallèle de l’image au lieu de celle du spectre. Ceci conduit à une réduction très importante du temps d’acquisition, (plusieurs centaines de fois plus courte). Le temps total d’acquisition dans une expérience pour 256 images ne dépasse pas cinq minutes. Pour illustrer le potentiel de cette technique, nous avons appliqué la méthode image-spectre à la cartographie élémentaire à haute résolution spatiale (Calcium, Bore et Oxygène) de particules colloïdales dont la taille est de l’ordre du nanomètre. Les résultats montrent l’existence d’une structure interne à deux phases. Les limitations de notre équipement sont dues à une faible tension d’accélération, un filtre non corrigé en aberrations du second ordre et une faible gamme dynamique de la caméra (numérisation sur 8 bits). Malgré ces limitations, nous montrons que les performances atteintes sont proches de celles prévues par les théories de la diffusion inélastique dans le M.E.T Abstract. Image-spectrum EELS consists of acquiring series of energy-filtered images of a specimen with an energy-selecting TEM (or an imaging filter in general). Special software was developed for this application. It allows the immediate display of an energy-filtered image or an EELS spectrum to be obtained interactively. The main advantage of the method, compared to the spectrum-image EELS mode, is in the parallel detection of the image instead of that of the spectrum leading to a drastic decrease of the acquisition time (typically several hundred times faster). The total acquisition time for an experiment does not exceed five minutes for 256 images. To illustrate the capabilities of the method, the image-spectrum EELS method was applied to fast high resolution chemical mapping of elements (calcium, boron an oxygen) in the core of nanometer-scale colloidal particles. Results show that the composition of the micellar core could be studied in much greater detail than expected and a two-phase internal structure is proposed. Some limitations are due to the equipment at hand (low accelerating voltage of the electron gun, non-corrected filter for second-order aberrations, low dynamic range of the camera due to 8-bit digitization of the images). Despite these limitations, the performance in terms os spatial and chemical resolutions generally approached the theoretical predictions based on inelastic scattering theories for the TEM. 2014
Article available at http://mmm.edpsciences.org or http://dx.doi.org/10.1051/mmm:1995107
54
1.
Image-Spectrum EELS Implementation
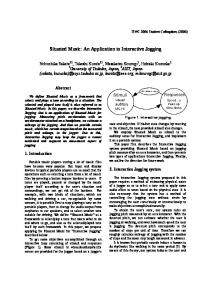
The aim of the method is to extract a part of an EELS spectrum for each point of an image. In order to perform this analysis, the recording of a three dimensional stack of data with x, y and E (energy-loss) values is needed. The classical way to obtain such a stack is to record an EELS spectrum for each position of a STEM probe, this is the so-called spectrum-imaging method first proposed by Jeanguillaume and Colliex [1] and developed by Hunt and Williams [2]. Another was is to record a serie of energy-filtered images and to extract the spectra by reading the grey level values in the images, this corresponds to the image-spectrum method developed by Lavergne et al. [3]. Thus, the spectrum-imaging technique first records spectra and the image-spectrum one first records images. We have developed this method on a Zeiss CEM902 fitted with a built-in Castaing-Henry filter which is linked to a Kontron image analysis system. Figure 1 shows the principle of the method. A given number of energy-filtered images are recorded with a given energy step between each of them. Once the recording is made, the analyst can choose an area of interest and the software permits the reading of grey levels of this atra for each image, instantaneously. Finally a curve is plotted with the image number (or the energy loss) on the x axis and the grey level (electron signal intensity) on the y axis. This curve is actually an EELS spectrum. The energy range is fixed by the number of images and is limited by two factors: the hard disk space: the images are recorded directly on the disk because of memory limita-
tions,
dynamic range of the detector is limited by a 8-bit digitization (low level SIT TV camera with a dynamic range of 256 : 1). Practically, this is a limitation especially when analysing edges with energy-loss lower than 150 eV -
2.
the
Image-Spectrum EELS Capabilities
The system is built around a PC Kontron with 2 Mb of RAM and 280 Mb of hard disk and linked to an Ethernet network. The acquisition is made by a Dage SIT TV camera and the digitization is performed by a Kontron RTV card. Images up to 1 024 per 1 024 pixels can be acquired directly. The normal size is set to 256 x 256 pixels so that the ratio between the microscope magnification and the pixel size is four. That gives a pixel size of about 3 nm for a 30.000 magnification. The acquisition time dépends on the energy of the edge of interest. Smaller is the energy, lower is the acquisition time. The Zeiss CEM902 microscope fitted with a LaB6 cathode was operating at an accelerating voltage of 80 kV. For imaging such specimens in the Zeiss 902 microscope, three modes can be used: a) zéro energy-loss bright field (BF) (bright field refers here to objective lens image formation only). If the specimen is very thin (thickness below 20 nm) the scattering contrast in the final image is very low since more than 70% of the transmitted electrons are unscattered. b) inelastic dark field (DF) (dark field refers here to the energy-filtered image formation only). The image is recorded at a given energy-loss E (eV) and with a given energy window DE (eV) determined by a mechanical slit located in the back focal plane of the spectrometer. c) elemental mapping which is actually a back-ground-subtracted image obtained from an inner-shell ionization edge in the energy-loss spectrum of the specimen material. When using the image-spectrum recording, the inelastic DF images produced can first be used to detect specific elements. The EELS spectrum at any point of interest in the image can be immediately obtained afterwards. Finally the choice of the parameters for elemental mapping can be optimised by using the shape of the spectrum (background model, energy values). In other cases, the same procedure
55
Fig. 1. Principle of the image-spectrum EELS technique. Series of energy-filtered images are first acquired. The EELS spectrum is obtained from any area of interest in the image as the grey level (equivalent to the signal intensity) as a function of the number of images (equivalent to the energy-loss range). -
be used to interpret the contribution of the different contrasts in any zone of an image. Three analytical modes were developed using the image-spectrum method: selected-area EELS spectra which are immediately obtained by clicking the mouse on the zone of interest in any energy-filtered image, line-scan EELS spectra mapping (3D rendering) for the fast visualisation of the presence of several elements simultaneously in any zone of interest, spectrum-assisted background modelling for elemental mapping. The real-time spectrum display in any point of the image allows the optimisation and the choice of a well-adapted background subtraction model (including the function and the energy values). can
-
-
-
2.1 IMAGE-SPECTRUM RESOLUTION. - According to Shuman et al. theoretical resolution in a filtered image is given by:
where
[4 ;(}2]is the inelastic delocalisation limit
[4]
and
Egerton [5],
the
56
8E is the energy window defined by the energy-selecting slit Eo is the primary electron energy (80 keV) Cc is the chromatic aberration coefficient (2.2 mm at 80 keV in the Zeiss 902) Cs is the spherical aberration coefficient (1.7 mm) a is the scattering angle defined by the size of the objective aperture. In the case of our samples, the theoretical values calculated are 0.45 nm and 0.83 nm for the boron K edge (188 eV) and the calcium L2,3 edge (349 eV), respectively. These calculations give us an idea of the optimum magnification/pixel size combination to be used in our experiments, in accordance with the performance of the microscope. We can compare this approach with the one used by Berger and Kohl [6] who have calculated the optimum parameters for chemical mapping. The optimum pixel sizes are found to be equal to 1.23 nm and 1.43 nm for the boron K-edge and for the calcium L-edge, respectively. These calculations allow an efficient magnification for the best signal to noise ratio to be obtained. 2.2 IMAGE-SPECTRUM IRRADIATION DOSE. - The electron dose received by the sample has to be accurately controlled. In the Zeiss 902 the dose can easily be calculated as a function of the magnification, the exposure time and the current intensity [7]. It has been shown [8] that the minimum dose for the acquisition of 48 images on the calcium L2,3 edge is about 107
e’/nm .
2.3 COMPARAISON WITH THE TRADITIONAL SPECTRUM-IMAGING EELS. - The advantage of our method is the drastic reduction in the acquisition time due to the parallel detection of the image (two or three orders of magnitude depending on the conditions). In the state of our knowledge, the acquisition of a 512 x 512 spectrum-imaging EELS in the STEM mode has not been yet made possible in a reasonable acquisition time. The corresponding disavantage of the imagespectrum technique is the increased acquisition electron dose on the specimen for the obtention of the same stack of data, but this dose can be reduced by recording only the energy ranges of interest. As the acquisition time is generally a few minutes, the specimen drift can produce some problems in the spectrum integrity. Drift corrections between each image can be necessary. The spectral quality essentially depends on the microscope and the detector used, in our case the energy resolution which is attainable in the image-spectrum EELS approaches the one obtained in the serial EELS acquisition mode, i.e. about 2 eV 3.
Investigation of Colloids by Image-Spectrum EELS
Colloidal particles whose size lies in the 3 nm-30 nm range are good candidates for testing the ability of EFTEM to produce fast elemental mapping with a high spatial resolution. Overbased calcium alkyl aryl sulfonate micelles have a composite structure where the calcium-rich core is surrounded by a shell of detergent molecules. Such reverse micellar structures are widely used as anti-corrosive additives for lubricating oils. In previous works [9, 10], we have already shown that it was possible to image 3 nm diameter core particles thanks to elemental mapping of calcium atoms in a conventional energy-filtering TEM by using the low-energy loss region (plasmons and calcium M-edge). In this work, we used a modified colloidal material where the calcium carbonate was partially replaced by calcium borate inside the micelle core. Elemental mapping of boron, carbon and calcium was obtained by using the Image-spectrum EFTEM method which was previously described. Calcium borate overbased salicylates (CBOS) micelles were obtained through a complex polyphasic reaction. The starting solution is a water-in-oil micro-emulsion containing pre-existing micelles whose typical size was 1 nm and corresponding to an aggregation number of approximately 30. Subsequent growth of the calcium-rich core is due to a dynamic exchange
57
with the non-uncleated micelles, which provides the additional surfactant molecules required to stabilise the colloidal particles. CBOs were prepared as described elsewhere [11]. Neutral calcium salicylates, water, methanol, calcium hydroxides, boric acids and then the diluent oils were weighed in an appropriate glass reactor with a condenser, and then the reaction mixture were stirred for four hours. After the completion of the reaction, water and methanol were distilled out and the reaction mixtures were then filtered out. The micelles are purified by centrifugation to eliminate coarse particles and then by dialysis in pentane through an elastomer membrane in order to extract organic impurities. The remaining dispersion can be directly used for TEM investigation. One drop of the highly diluted dispersion in pentane is deposited onto a very thin carbon film (thickness 5 - 10 nm) supported itself by a holey carbon film (thickness 30 nm) in order to ensure a good mechanical stability during the observation. After solvent evaporation and drying, the OCABS micelles are firmly stuck onto the thin carbon film by van der Waals interactions. 4. Results and Discussion
The collection angle for EFTEM was set to 17 mrad by using the larger objective aperture in order to minimise the diffusion contrast in the image. The energy window is defined by the slit width in the back focal plane of the spectrometer (a 1 mm wide slit aperture on the TEM screen corresponds to a 4 eV energy window). The energy loss was scanned between 160 eV and 408 eV with an energy step of 1 eV In this experiment, the acquisition time per image was limited to 1.5 s to reduce the effects of drifting during the experiment. This gives a total time of 420 s for 248 The energy acquired inelastic DF images and a total dose on the specimen of 2 x 10⁷ window was set to approximately 7 eV which permits a good signal/noise ration in the final image to be obtained, but for a limited energy resolution. In the electron images of our specimen, the different contrasts mechanisms which are expected are the following (Fig. 2): a) the phase contrast due to the spherical shape of the particle (Fresnel fringes), b) the elastic scattering contrast due to the calcium atoms which are present in the amorphous mineral core (the diffraction contrast is thus absent), c) the inelastic scattering contrast, which is the result of two contributions: the excitation of plasmons particularly in carbon materials (including the surfactant molecules in the shell) and the excitation of inner-shell electrons (carbon, boron, oxygen and calcium atoms). Note that both the elastic and inelastic contrasts are mass-dependent. Using the multiple scattering statistics [5], multiple scattering effects as a function of the thickness can be calculated (Fig. 1). The elastic and inelastic mean free paths of electrons are estimated to be 100 nm in our working conditions. The evolution of the percentage of transmitted electrons (unscattered, single scattered and multiple scattered respectively) as a function of the specimen thickness can be compared. It appears that multiple events must not be neglected even if the specimen thickness is very low. For example and for a 20 nm thick specimen, the percentage of unscattered electrons is 70%, and both single scattered and multiple scattered (elastic plus plasmon-loss) electrons are approximately 10%. So, elastically-scattered electrons are always present in any energy-filtered image.
e-/nm 2.
5. Selected-Area EELS
Spectra
The 270 eV energy-loss inelastic DF image of an organic sample usually shows enhanced massthickness contrasts. Actually, this energy value is far from the plasmon loss centred near 25 eV and just before the carbon K-edge (beginning at 280 eV). This reduces the contribution in the image of most of the light elements whose ionization appear at higher energy-losses (carbon, nitrogen
58
Electron contrasts in the TEM observation of colloidal systems (* for weak, * * for medium, * * * for unscattered electrons, b) multiple scattered electrons (single inelastic plus plasmon, c) singlescattered (inelastic or elastic). Whatever the specimen thickness, contrast from elastically-scattered electrons is always present in any energy-filtered image.
Fig. 2. high). a)
-
and oxygen atoms). Figure 3 shows such an energy-filtered image at 270 eV which permits the possible location of some colloidal particles to be distinguished clearly. Note that this image has not been corrected for gain reference of the detector. At this stage, corrections due to the drift between each energy-selected image could be made if necessary before extracting the EELS spectra. This may be due to some mechanical instabilities of the preparation during acquisition time. By post-processing the 248 images available, EELS spectra can be immediately generated by clicking the mouse on the area of interest. The smallest analysed area is here determined by both the magnification and the number of pixels in the final image, in accordance with the theoretical resolution in the filtered images of the microscope. In our case, a pixel represents a 2 nm wide selected area and more than 65 000 spectra can be extracted from the data. EELS spectra shown in Figure 3 were generated from five adjacent pixels, equivalent to an analysed area of approximately 6 nm in diameter. This can be easily done in any location in the image (see the corresponding arrows). In particle 1 in the image, the presence of boron (K-edge at 188 eV), carbon (K-edge at 284 eV) and calcium (Ca L-edges at 349 eV) is clearly evidenced, but the presence of boron is not observed in particle 2. On the other hand, the weakness of convoluted plasmons in the carbon Kedge on the carbon support (area 3) indicates the very low thickness of the specimen. The energy dispersion in the image of the Zeiss 902 can be easily estimated by comparing two spectra: one in the centre of the image and the other in a corner. The corresponding energy shift at the carbon
59
Image-spectrum EELS analysis. 248 inelastic DF images were acquired with an energy step of 1 eV an energy window of 7 eV The total acquisition time is 420 s for a dose of 2 x 10 7 e- /nm 2. Selectedarea EELS spectra (6 nm diameter) were extracted from three zones of interest depicted by arrows in the 270 eV loss inelastic image. Note that boron is not present in the colloidal particle 2 and that calcium is not
Fig.
3.
-
and
present in the carbon support.
K-edge onset has been measured as approximately 3 eV in these conditions in agreement with the microscope specifications. Note that the energy resolution in this experiment does not permit the separation the two L-edges of calcium and the ls/7r* transition at the onset of the carbon K-edge is hardly visible. This indicates that the energy resolution is above 2 eV in these conditions. In order to increase this energy resolution in the EELS spectra and the quality of the data, 248 inelastic DF images were recorded between 310 eV and 558 eV, with a window energy reduced to 3 - 4 eV and an acquisition time per image increased to 3 s. The results are shown in Figure 4 and the EELS spectrum extracted from the centre of the particle in the image displays the two white lines of the calcium L-edges which are now resolved. Moreover, the oxygen K-edge is also visible with its pre-edge characteristic of the sp2 hybridization. The spectrum extracted from the edge of the
60
particle does not display the presence of calcium and shows a low oxygen contribution (the nitrogen K-edge near 400 eV can also be detected in this specimen). By comparing the two spectra, the contrast in any filtered image can be then understood. colloidal
4. Image-spectrum EELS analysis. Same conditions that in Figure 3 except that the energy window is reduced to 3 - 4 eV and the acquisition time is increased to 3 s. The EELS spectrum extracted from the colloid shows the two L white lines of calcium and the pre-edge of the oxygen K-edge is also seen. The spectrum from the edge of the colloid is also shown.
Fig.
-
6. Line-Scan
Spectra Mapping
By reading the grey levels of pixels located on a line in any zone of interest in the image, line-scan EELS spectra mapping can be obtained which are very similar to those obtained in the STEM mode. The advantage here is that, once the acquisition is made, line-scan mappings can be obtained in a few seconds. Figure 5 presents the result of such a line-scan EELS mapping which
61
permits the simultaneous presence of several elements (namely calcium and oxygen in this example) to be observed.
Fig. 5. Line scan spectra mapping (3D rendering) of several colloids, simultaneously can be easily observed in these conditions. -
7.
the presence of several elements
Spectrum-Assisted Background Subtraction for Elemental Mapping
Perhaps the greatest advantage of the imaging-spectrum acquisition mode is to permit the background modelling to be optimized. The energy values for an accurate chemical mapping (including near-edge fine structures mapping) can thus be obtained. For boron, the spectrum obtained from a particle indicates that we need to use a three-image method [12] or even better in this low-energy range, a three-parameter model [13]. The subtraction of two images just at the onset of the saw-tooth K-edge can be an easy alternative. The results of the different background subtractions could thus be immediately compared but it is to be noted that some noise in the two pre-edge images is not in the favour of the power-law stripping which would cause erros in the extrapolation below the edge. In the case of calcium, a two-image subtraction at the edge onset seems to be preferable. The mappings for carbon (boron and calcium) and oxygen with the two-image subtraction method are presented in Figure 6. The presence of calcium borate in the micellar core surrounded by the detergent molecules shell is thus clearly demonstrated, even for these nanometer-scale particles. In the case of smallest particles, a 512 x 512 image should have been acquired in order to decrease the pixel size to 1 nm area, but this is perhaps in the limit of the performance of the microscope in terms of electron signal but also very near the theoretical
62
limits of the technique. It is interesting to observe a boron-deficient sub-shell around the calcium borate core which might correspond to the presence of the calcium salycilate function group in the detergent molecule. This example is a demonstration of the capabilities of the method both in terms of spatial and chemical resolutions.
Fig. 6. Chemical mapping of boron, carbon, calcium and oxygen using the image-spectrum mode with the two-image subtraction technique. a) carbon distribution (292 eV loss - 275 eV loss), b) boron (red) and calcium (green) distribution, calcium borate appears in yellow, c) fine structure mapping, calcium L2 (352 eV loss - 47 eV loss) in green, ls/7r* transition of oxygen K edge (536 eV loss - 533 eV loss) in red. Yellow is for calcium and oxygen simultaneously. -
63
8. Conclusion
We have applied the image-spectrum EELS method in the EFTEM (Zeiss CEM902 microscope) in order to investigate the internai chemical composition of colloidal particles whose diameter lies in the nanometer range. Compared to the spectrum-imaging STEM technique, the main advantage of the method used here is to acquire all the data f (x, y, E) in a short time, typically less than five minutes, the inconvenient is a longer irradiation time for the acquisition. Post-processing of the data permits several analytical modes to be obtained: selected-area EELS spectra, 3D linescan spectra mapping, spectrum-assisted background modelling for chemical mapping. Results are as follows: qualitative EELS analysis of any 6 nm size zone of interest in the TEM image can be obtained by using an acquisition time of 1.5 s per image and an energywindow limited to approximately 7 eV It is shown that all the particles have not the same chemical for a total dose of 2 x an that some colloids contain boron; only composition if the energy window is reduced to 4 eV, the energy resolution in the EELS spectra becomes better and some fine structures can be resolved such as the L2/L3 white lines splitting of calcium and ls/7r* transition at the oxygen K-edge; chemical mapping of carbon, calcium, boron and oxygen were easily obtained by using the two-image subtraction method. This is made possible thanks to the special shape of the ionization edges (saw-tooth for the K-edge and white lines for calcium) and also to the fact that the energy window used here is sufficiently narrow to ensure a good energy resolution in the spectrum. Results indicate that a two-phase internai structure of the micellar core seems to occur and that, as expected, calcium borate is located in the centre of the core; the overall data confirm that the image-spectrum EELS is a very powerful analytical technique associated with the energy-filtered TEM. It is very promising when using FEG-TEM fitted with fully corrected imaging filters. -
107 e-/nm2.
-
-
-
Acknowledgements The authors would like to thank H. Zahouani for the 3D rendering of line scan spectra and Nippon Oil Company for financial support and the agreement to publish the data.
mapping
References
[1] Jeanguillaume C. and Colliex C., Ultramicroscopy 28 (1989) 252. [2] Hunt J.A. and Williams D.B., Ultramicroscopy 38 (1991) 47. [3] Lavergne J.L., Martin J.M. and Belin M., Microsc. Microanal. Microstruct. 3 (1992) 517. [4] Schuman H., Chang C.F. and Somlyo A.P., Ultramicroscopy 19 (1986) 121. [5] Egerton R.F., Electron Energy Loss Spectroscopy in the Electron Microscope (Plenum York, 1986). [6] Berger A. and Kohl H., Microsc. Microanal. Microstruct. 3 (1992) 159. [7] Lavergne J.L. et al., J. Microsc. 174 (1994) 195. [8] Lavergne J.L., Ph. D. Thesis, Lyon, France (1994). [9] Martin J.M. and Mansot J.L., Ultramicroscopy 30 (1989) 321. [10] Mansot J.L., Hallouis M. and Martin J.M., Colloids Surf. A 71 (1993) 123. [11] Inoue K., Lub. Eng. 49 (1993) 263. [12] Reimer L., Fromm I. and Rennekamp R., Ultramicroscopy 24 (1988) 339. [13] Tenailleau H. and Martin J.M., J. Microsc. 166 (1992) 297.
Press New