I. INTRODUCTION. NeXt Generation (xG) wireless communication network ... yet have different access technologies, mutual
22nd IEEE Personal Indoor Mobile Radio Communications
Interference-Aware Dynamic Spectrum Access in Cognitive Radio Network Rajarshi Mahapatra and Emilio Calvanese Strinati CEA, LETI, MINATEC, 17, rue des Martyrs - 38054 Grenoble, France Email:
[email protected],
[email protected] Abstract—Dynamic spectrum access (DSA) is a challenging issue among the cognitive radio (CR) users. In this paper, we investigate an interference-aware local cartography-based DSA (LC-DSA) technique for OFDM-based CR system. In particular, a joint power and frequency resource block (RB) allocation technique has been proposed for resource allocation among secondary users (SUE) exploiting radio environmental map (REM) of the local surrounding environment. With REM, we produce an interference database for each RB at each SUE’s location. Having knowledge of these measured interference values, LCDSA technique elaborates an interference cartography (IC) diagram of CR coverage area with the help of spatial interpolation algorithm. Using IC diagram, CR applies interference classification algorithm to classify RBs at target location and uses them for transmission with appropriate transmit power without producing interference above the threshold value to the primary user (PUE). Our simulation results show how the proposed LCDSA technique significantly improves the system throughput. Simultaneously, the interference introduced to the PUE remains within a tolerable limit.
I. I NTRODUCTION NeXt Generation (xG) wireless communication network aims to minimize the inefficient usage of spectrum by dynamically access unused spectrum with the help of cognitive radio (CR) [1]. Dynamic spectrum access (DSA) is a promising approach to alleviate the spectrum scarcity and aims at reusing sparsely occupied frequency bands while causing no (or insignificant) interference to the actual user, i.e. primary user (PUE). The key characteristics of DSA system empower their ability to exploit knowledge of the surrounding environment to adapt their transmission parameters and access the spectrum dynamically. The CR [2], built on software defined radio, is an intelligent, adaptive and frequency agile wireless device that will underlie most form of future DSA system. In CR networks, unused spectrum bands were spread over wide frequency range including both unlicensed and licensed bands. These unused spectrum bands have different characteristics, in terms of operating frequency and bandwidth, and these bands are detected through spectrum sensing [1]. Due to unplanned deployment, CR users (SUE) can suffer interference from primary base stations (PBS). On the contrary, CR can also produce interference at the nearby PUE. Therefore, it is absolutely necessary for CR to reduce interference through appropriate DSA technique [3]. Several techniques are available in literature for efficient DSA mechanism of CR network. In [1], authors have considered a centralized control entity, named spectrum broker for
978-1-4577-1348-4/11/$26.00 ©2011 IEEE
xG network. In [4], the authors propose opportunistic access by the cognitive node to increase flexibility with enhancing spectrum efficiency. The interference due to the secondary activity does not exceed a predefined threshold at primary terminal. The interference can be estimated by transmitter detection-based spectrum sensing. Due to its great flexibility in dynamically allocating unused spectrum among the users, [5], orthogonal frequency division multiplexing (OFDM) has already been recognized in the literature as a potential transmission technology for the secondary systems. Thus, OFDMbased sensing can give more flexibility and allow accurate allocation of the available resource blocks (RB) to secondary users [6]. In [7], authors introduce a resource allocation algorithm based on location information for OFDMA-based CR systems. In [8], a resource allocation among several SUEs in an OFDM-based network has been proposed with the intention of increasing the system throughput while limiting interference to the PUEs. Motivated by the above works, this paper proposes a radio resource allocation technique for among CR users exploiting radio environment maps (REMs). REM is envisioned as an integrated space-time-frequency database consisting of multidomain information, such as geographical features, available services, spectral regulations, locations and activities of radios, relevant policies, and experiences [9]. In this context, this paper proposes an interference-aware local cartography-based DSA (LC-DSA) technique for CR system, which consists of one CR-transmitter (CR-Tx) and several SUEs. The CR system uses OFDMA-based access technique to measures interference values at user location for each RB by sensing. In particular, a joint power and frequency RB allocation scheme has been proposed for CR using LC-DSA techniques to maximize the SUE capacity. In order to achieve this, we introduce the concept of interference cartography (IC) for better resource allocation. The interference cartography (discussed in Sec. III) combines radio measurement data with user’s location information and provides a complete view of the environment for autonomous decision making [10]. In this work, we use spatial interpolation algorithm, called Kriging interpolation to estimate interference values at the unobserved location and makes IC diagram for each RB of CR coverage area. Thereafter, these RBs have been classified based on their interference values using classification technique at desired location. Then, appropriate transmit power have been used on these classified RBs for transmission to maximize downlink transmission capacity of SUEs, while the
398
interference introduced to the PUE remains within a tolerable limit. The rest of the paper is organized as follows. Section II describes the system model of the proposed LC-DSA technique along with analytical formulation. Section III presents the overview of interference cartography and analyses its formation in the context of present work. This section also describes the interference classification scheme. The power and subcarrier allocation mechanism of proposed LC-DSA technique has been described in Sec. IV. Section V presents the simulation results. Finally, Sec. VI concludes the work. II. S YSTEM M ODEL AND P ROBLEM D EFINITION Since both SUE and PUE may exist in side-by-side bands yet have different access technologies, mutual interference is the limiting factor for performance of both networks. In [11], the authors have shown that using OFDM modulation causes mutual interference between the PUE and SUEs due to the non-orthogonality of the transmitted signals. The amount of interference introduced to the PUEs band by a SUEs subcarrier depends on the power allocated in that subcarrier as well as the spectral distance between that particular subcarrier and the PUEs band. In this paper, it has been assumed that CR system uses OFDMA-based transmission technique. The SUE uses frequency bands/RBs, which are used or unused by PUEs, provided that the total interference introduced to the band does not exceed the threshold value (𝐼𝑡ℎ ). The power spectrum density (PSD) (𝜙𝑖 ) of the 𝑖−th subcarrier of 𝑘-th SUE can be written as [12] ( )2 sin 𝜋𝑓 𝑇𝑠 ℎ 𝑇𝑠 (1) 𝜙𝑖 (𝑓 ) = 𝑃𝑖,𝑘 𝜋𝑓 𝑇𝑠 ℎ is the transmit power emitted by the 𝑖-th subcarrier where 𝑃𝑖,𝑘 for 𝑘-th SUE of ℎ-th CR and 𝑇𝑠 is the symbol duration. ℎ ) is the mutual interference introduced by the 𝑖-th 𝐼𝑖𝑙ℎ (𝑑𝑖𝑙 , 𝑃𝑖,𝑘 subcarrier of 𝑘-th SUE to 𝑙-th RB and can be expressed as ∫ 𝑑𝑖𝑙 +𝐵/2 𝑙ℎ ℎ (𝑑𝑖𝑙 , 𝑃𝑖,𝑘 )= 𝐺ℎ𝑝 (2) 𝐼𝑖,𝑘 𝑙 (𝑡, 𝑓 )𝜙𝑖 (𝑓 )𝑑𝑓 𝑑𝑖𝑙 −𝐵/2
𝐺ℎ𝑝 𝑙
where, is the channel gain between PBS and SUE on 𝑙-th RB, 𝐵 is the bandwidth of the occupied band and 𝑑𝑖𝑙 is the distance between the 𝑖-th RB and 𝑙-th RB. The power density spectrum of the PUE’s signal after 𝑀 -fast Fourier transform (FFT) processing can be expressed by the following expected value of the periodogram, ( )2 ∫ −𝜋 sin(𝜔 − 𝜓)𝑀/2 1 𝜙𝑚 (𝑒𝑗𝜔 ) 𝑑𝜓 𝐸{𝐼𝑁 (𝜔)} = 2𝜋𝑀 𝜋 sin(𝜔 − 𝜓)/2 (3) where 𝜔 represents the frequency normalized to the sampling frequency and 𝜙𝑚 (𝑒𝑗𝑤 ) is the power density spectrum of PUE signal. The PUE signal has been taken to be an elliptically filtered white noise process with an amplitude 𝑃𝑝 [11]. The interference introduced by the 𝑙-th PUE signal of 𝑝-th PBS to
the 𝑖-th subcarrier, denoted as 𝐽𝑖𝑝𝑙 (𝑑𝑖𝑙 , 𝑃𝑝 ), and can be written as ∫ 𝑑𝑖𝑙 +𝐵/2 𝐺𝑝ℎ (4) 𝐽𝑖𝑝𝑙 (𝑑𝑖𝑙 , 𝑃𝑝 ) = 𝑙 (𝑡, 𝑓 )𝐸{𝐼𝑁 (𝜔)}𝑑𝜔 𝑑𝑖𝑙 −𝐵/2
In our channel model, the power of the received signal at SUE is given by ℎ ℎ ℎ ℎ 𝐺ℎℎ 𝑖 = 𝑃 𝐿𝑖𝑘 (𝑑𝑖𝑘 ) × 𝜂𝑖𝑘 × 𝜁𝑖𝑘
(5)
where 𝑃 𝐿, 𝜂 and 𝜁 the distance dependant channel gain, the shadowing, and the fast frequency selective fading component that depends on the RB 𝑖 for user 𝑘 of ℎ-th CR. The Shannon ℎ of SUE 𝑘 at 𝑖-th RB is given by capacity, 𝑅𝑖,𝑘 ⎛ ⎞ ℎ 𝑅𝑖,𝑘
⎜ ⎟ 2 ℎ ⎟ ⎜ ∣𝐺ℎℎ ⎜ 𝑖 (𝑡, 𝑓 )∣ 𝑃𝑖,𝑘 ⎟ = 𝐵𝑖,𝑘 log2 ⎜1 + ⎟ 𝐿 ∑ 𝑃 ⎜ ⎟ ∑ 𝑝𝑙 ⎝ 𝜎2 + 𝐽𝑖 ⎠
(6)
𝑙=1 𝑝=1
As mentioned earlier, our objective is to maximize the total capacity of the CR network with power and rate constraints, while the interference introduced to the PUE remains within a tolerable limit. Thus, the optimization problem can be formulated as follows 𝑀 𝑎𝑥𝑖𝑚𝑖𝑧𝑒 𝑠𝑢𝑏𝑗𝑒𝑐𝑡 𝑡𝑜
𝐾 ∑ 𝑁 ∑
ℎ ℎ 𝑎𝑖,𝑘 𝑅𝑖,𝑘 (𝑃𝑖,𝑘 , 𝐺ℎℎ 𝑙 (𝑡, 𝑓 ))
𝑘=1 𝑖=1 𝑇 𝑜𝑡
ℎ ≤ 𝐼𝑡ℎ , 𝑅𝑖,𝑘 ≥ 𝑅𝑚𝑖𝑛
𝐼
0≤
𝑁 ∑
ℎ 𝑎𝑖,𝑘 𝑃𝑖,𝑘 ≤ 𝑃𝑇 𝑜𝑡
(7) (8) (9)
𝑖=1
𝑎𝑖,𝑘 ∈ {0, 1},
𝑁 ∑
𝑎𝑖,𝑘 ≤ 1
(10)
𝑖=1
where 𝑁 is the number of subcarriers or RBs, 𝐾 is the number of SUEs per CR system, 𝑃 is the number of neighbouring PBS, 𝑅𝑚𝑖𝑛 , 𝑃𝑇 𝑜𝑡 are the rate and power constraint respectively, 𝑎𝑖,𝑘 is the binary assignment variables and 𝐿 is the occupied band. The total interference (𝐼 𝑇 𝑜𝑡 ) introduced to PUE is given by ( ) 𝑁 ∑ 𝑃 𝐿 ∑ ∑ 𝑝𝑙 𝑇 𝑜𝑡 𝑙ℎ 𝐼 = 𝐽𝑖 𝑎𝑖,𝑘 𝐼𝑖,𝑘 + (11) 𝑖=1 𝑙=1
𝑝=1
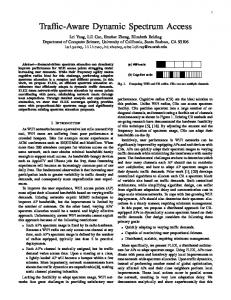
Figure 1 shows the system model of our proposed LCDSA technique. As shown in figure, it consists of two main functional modules: IC manager and CR spectrum manager (CSM) with spectrum allocation module. The IC manager consists of measurement collection module (MCM) and IC database. MCM collects the available interference values for each RB at each user’s location. These interference values of each RB are then stored in the IC database. IC database adds interference values for any new location and updates the value for already existing locations. With this process, IC database is being up-to-date at any point of given time. By gathering these interference values, IC manager makes the cartography
399
SUE 1
Interference Cartography
Manager
RB Id: 10, HUE: 2
SUE 2
RB Id: 30, HUE: 2
105
105 −85.5
Measurement Collection Module
SUE 4 SUE 3
Interference Cartography Database
100
−86
95
−86.5
90
−87
85
SUE 5
SUE 1
CR Spectrum Manager
90
95
90
100
RB Id: 30, HUE: 10 −80
100
SUE 3
−90
85 80 80
100
105
−85
90
RB Id: 10, HUE: 10
SUE 4 Spectrum Allocation
−87.5
80 80
−80
100
105 −85
100 −85
95
95
90
SUE 2
−90
85 80 80
Fig. 1. System model framework of interference-aware radio resource allocation.
diagram for each RB of CR’s coverage area. This IC diagram helps CSM module for resource allocation among SUEs. The CSM module assigns RBs to the users with appropriate transmit power to satisfy QoS. The RBs and transmit power have been selected based on the interference at desired user location and the interference threshold limit at neighbouring PUEs location. The interference threshold at the given receiver is the maximum interference level acceptable by the receiver (i.e. maximum level of interference that does not cause any QoS degradation). Moreover, knowledge of the locations of primary receivers may help to determine the corresponding interference threshold. It depends on the particular user with specific QoS and might differ for different users. III. I NTERFERENCE C ARTOGRAPHY AND ITS C ONSTRUCTION The interference cartography [10] is based on the aggregation of the interference information, measured by entities of several different wireless networks at a central unit. The central unit combines these aggregated values with geo-localization information, and performs advanced signal processing techniques to render complete and reliable information. It provides viable picture of the environment for efficient detection, analysis and decision by updating this information on a database, known as REM [13]. The REM relies only on reported measurements in database construction, which constructs the cartography from partial measurement data using advanced signal processing techniques, offering quality/reliability criteria and additional measurement request mechanisms to satisfy these quality/reliability criteria. To achieve certain level of accuracy and reliability in measured data, large amounts of measurement data may be needed in constructing a cartography. Furthermore, with the increasing level of technological advances, it is possible to implement efficient signal processing techniques that achieve high levels of accuracy and reliability with a small proportion of measurement data [9]. In our wireless network simulator, we use interference values of each RB at the current user’s location as REM information. These interference values are used to form the IC
−90
90 −95
85 −95 90
100
80 80
90
100
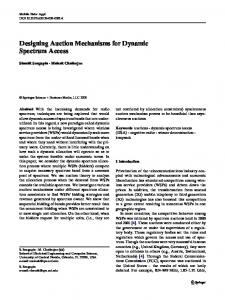
Fig. 2. A typical interference cartography diagram for RB Id 10 and RB Id 30 with different SUEs in CR coverage area (10 × 10 meter). CR-Tx located at (90, 95). Star marks represent the SUE locations. The unit of interference is dBm.
database, whose size limited to number of RBs with current users characteristics. Using IC database, IC manager estimates interference values at the desired location using spatial interpolation. The spatial interpolation is a statistical procedure that estimates missing values at unobserved locations within a given area, based on a set of available observations of a random field. This interpolation is mainly based on an important principle in geography called the spatial autocorrelation. One such interpolation technique is Kriging interpolation technique [14], used in this work. In order to implement the interpolation, we consider the data set 𝑦(1), ..., 𝑦(𝑛) are the realization of a stochastic model with mean, 𝜇(.), and (symmetric) variancecovariance matrix, Σ. Given a sample of size 𝑛, the best linear unbiased predictor (BLUP) of any unsampled point on the surface can be obtained by simple Kriging. To predict the attribute value at site 𝑥, (𝑥), which is not included in the sample compute: 𝑦˜(𝑥) = 𝜇(𝑥) + 𝐶 𝑇 Σ−1 (𝑌 − Ω)
(12)
where 𝐶 𝑇 = (𝑐𝑜𝑣(𝑌 (0), 𝑌 (1)), ..., 𝑐𝑜𝑣(𝑌 (𝑥), 𝑌 (𝑛)). Σ, as noted, is an 𝑛 × 𝑛 symmetric matrix with (𝑖, 𝑗)-th ele𝑇 ment equal to 𝑐𝑜𝑣(𝑌 (𝑖), 𝑌 (𝑗)), 𝑦 = (𝑦(1), ..., 𝑦(𝑛)) , Ω = 𝑇 (𝜇(1), ..., 𝜇(𝑛)) and 𝜇(𝑥) is the mean evaluated at site 𝑥. The second term in (12) identifies the simple Kriging weights, 𝐶 𝑇 Σ−1 , assigned to each data point, that yields the BLUP of the unknown attribute value. As shown in Fig. 1, by accessing the interference values from IC database, IC manager makes the cartography diagram for each RB using Kriging interpolation of CR coverage area. Figure 2 shows the IC diagram for two different RBs of a particular CR with two different numbers of SUE. As shown in figure, the interpolation algorithm estimates more accurately at the unobserved locations with larger database. Figure. 3 shows the interference values of all RBs for different locations. As
400
−84 Interference cancellation regime −85
Interference Level (dBm)
−86
−87
Jointly decoding regime
−88
−89
D=3m D=6m D = 11 m D = 10 m D=7m D=4m
Noisy interference regime −90
−91
5
10
15
20
25 RB Id
30
35
40
45
50
Fig. 3. Interference values of all RBs at different position within CR coverage area at a particular instant. The distance (D) is the angular distance between SUE and CR-Tx (CR-Tx located at (90, 95)).
evident from the figure, interference values are different for different RBs at a particular location. Using this constructed IC diagram, CR divides the RBs into different categories by interference classification scheme. In the literature, some theoretical investigations propose to classify perceived interference at user into five regimes, namely noisy, weak, moderately weak, strong and very strong interference regimes [15]. In [16], the authors simplify interference classification which reduces the processing complexity in comparison to the other classification. These papers classify the interference into three regimes. Noisy interference regime: The noisy regime corresponds to the most conventional way for processing interference, i.e., as thermal noise. If the perceived neighbour signal is too weak, then the interference can be processed as additional noise. Interference cancellation regime: Here, interference is so strong that it causes no degradation in comparison to a scenario without interference. Such a regime is known in the literature as the very strong interference regime. One main advantage of this regime is that the optimal scheme can be used to decode the interfering data while treating information data as noise, then subtracting interference to the received signal and eventually decoding the information signal cleaned from interference. Interference is then cancelled out. Jointly decoding regime: With this regime, perceived intercell interference is not strong enough to be decoded alone and not weak enough to be treated as noise; destination jointly decodes information and interference for recovering the information signal. This regime lies between noisy and interference cancellation regimes. IV. LC-DSA T ECHNIQUE AMONG SUE S Based on the above-mentioned assumptions, we will use the following procedure for allocate RBs with appropriate transmit power among SUEs. The RBs are allocated to SUE by the
allocation module, as shown in Fig. 1. The allocation module uses location-based interference values from IC diagram and allocates RBs to SUE with the help of CSM. At first, IC manager collects interference values at the current scheduled user’s location on each RB and stores in IC database. This operation happens periodically and IC manager refresh the values in IC database. The refreshment happens when there is an update on power allocation, user activation, additional resource allocation etc. Using these values, IC manager forms the cartography diagram of each RB. When CR-Tx wants to communicate to a new user, IC manager uses IC diagram to know the interference values of each RBs at the desired user location. The CR-Tx then classifies the RBs according to the classification algorithm according to the rate and power constraint. In this work, we use the RBs of noisy regime, since CR-Tx does not have any knowledge of the decoding structure of interfering signal. On each chosen classified RB, CR-Tx selects transmit power in an iterative way. For each iterative process, CR-Tx estimates interference values by producing IC diagram on each available RB at the neighbouring areas. During each iteration, CR-Tx checks the interference values produce at specified location, which should be within the threshold limit. Thus, at each value of transmit power, IC manager form IC diagram for extended coverage area, so that the possible interference values after transmission can be checked at the worst case PUEs [?] for interference limit. By this process, the proposed LC-DSA algorithm selects the transmit power of each classified RBs. The number of RBs is selected with best modulation and coding scheme to meet rate and power constraints. In this way, CSM with allocation module allocates RBs with appropriate transmit power among SUEs as well as keeps the interference at neighbouring area within the threshold limit. V. S IMULATION R ESULT In order to validate the concept, we consider CR located within a hexagonal PBS networks that are using same frequency band for communication in downlink. With a bandwidth of 10 MHz, 50 RBs are available for data transmission. The channel gain is composed of outdoor path loss model, lognormal shadowing and Rayleigh fast fading. The value of 𝑅𝑚𝑖𝑛 is 1 Mbps. The maximum power of PBSs and CR-Tx are 46 and 10 dBm respectively. Each neighbouring PBS transmits continuously with maximum power. Figure 4 shows the IC diagram of before and after transmission for two different RBs with two SUEs. As evident from the figure, the values of interference are changing after transmission due to power allocation on a particular RB. These values is different for different RB at a particular location. These estimated interference value are being used for checking the interference threshold limit at neighbouring location. Based on these IC diagram, appropriate transmit power has been chosen for each RB, while the interference introduced to the PUE remains within a tolerable limit. Thus, with the help of IC diagram, LC-DSA technique selects appropriate transmit power on each RB.
401
Before Transmission RB Id: 10, HUE: 2 −85.5
100
−86
95
−86.5
90
−87
85
−87.5
80 80
90
60 0.035
100
0.03
20
90
0
85
Before Transmission RB Id: 30, HUE: 2
90
100
After Transmission RB Id: 30, HUE: 2
105
Proposed LC−DSA Scheme Power Control Scheme [12]
40
95
80 80
100
0.04
105
Power of CR (Watt)
105
After Transmission RB Id: 10, HUE: 2
0.025
0.02
0.015
0.01
105 −80
100
0.005
100 0
95
−85
90
0 3.5
95 90
−90
85 80 80
90
4.5 5 5.5 Interference Threshold (Watt)
6
6.5 −3
x 10
85 80 80
100
4
−50
Fig. 6. Transmit power of SUE versus interference introduced to the worst case PUE.
−100 90
100
Fig. 4. Interference cartography diagram (25 × 25 meter) at before and after transmission for two different RBs. CR-Tx located at (90, 95). Star marks represent the SUE locations. The unit of interference is dBm.
LC-DSA technique looks promising for femtocell network as well as cognitive radio network to minimize interference at the neighbouring locations. More studies in this area are being investigated further.
20
R EFERENCES
Power Control Scheme [12] 19
Average Transmitted Data Rate (Mbps)
Proposed LC−DSA Scheme 18 17 16 15 14 13 12 11 10 3.5
4
4.5 5 5.5 Interference Threshold (Watt)
6
6.5 −3
x 10
Fig. 5. Maximum average transmitted data rate of SUE versus interference introduced to the worst-case PUE.
In Fig. 5, we plot the average achievable transmission rate of SUE versus interference introduced to the worst-case PUE. Since, CR does not have the knowledge of PUE location, we consider a worst-case PUE, co-located with SUE. From the figure, we observe that for a given interference threshold, the proposed LC-DSA scheme achieves the higher transmission rate for SUEs in comparison to the optimal scheme in [12]. However, the power control scheme in [12] allows transmission of higher power than the proposed LC-DSA scheme for a given interference threshold, as shown in Fig. 6. VI. C ONCLUSION In this paper, we proposed an interference-aware LC-DSA technique in CR system. The RBs with appropriate transmit power are allocated to SUE efficiently by combining location information using the proposed DSA technique. It was observed that the proposed technique is very effective to improve the throughput of SUE while maintaining the interference on the neighbouring PUE within a tolerable limit. The proposed
[1] I. F. Akyildiz et al., “Next generation/dynamic spectrum access/cognitive radio wireless network: a survey,” Computer Network, pp. 2127-2159, 2006. [2] J. Mitola et al., “Cognitive radio: making software radios more personal,” IEEE Pers. Commun., vol 6, no. 4, pp. 13-18, Aug. 1999. [3] S. Geirhofer, L. Tong, and B. M. Sadler, “Interference-aware ofdma resource allocation: A predictive approach,” IEEE Military Communications Conference, (MILCOM) 2008, Nov. 2008. [4] A. Ghasemi and E. S. Sousa, “Spectrum sensing in cognitive radio networks: the cooperation-processing trade-off,” Wireless Communications and Mobile Computing, vol. 7, no. 9, pp. 1049-1060, May 2007. [5] T. Weiss and F. K. Jondral, “Spectrum pooling: an innovative strategy for the enhancement of spectrum efficiency,” IEEE Commun. Mag., vol. 43, no.3, pp. S8-S14, Mar. 2004. [6] V. Kuppusamy and R. Mahapatra, “Primary user detection in OFDM based MIMO cognitive radio,” IEEE CrownCom 2008, Singapore. [7] H. Nam et al., “Location-based resource allocation for ofdma cognitive radio systems,” IEEE CROWNCOM, Jun. 2010. [8] A. Attar et al., “Interference-limited resource allocation for cognitive radio in orthogonal frequency-division multiplexing networks,” IET Commun., vol. 2, pp. 806-814, Jul. 2008. [9] Bruce Fette, Cognitive Radio Technology, 2009, Academic Press. [10] Alaya-Feki et al; “Informed spectrum usage in cognitive radio networks Interference cartography,” IEEE PIMRC, 2008. [11] T. Weiss et al., “Mutual interference in OFDM-based spectrum pooling systems,” VTC04, pp. 1873-1877, May 2004. [12] G. Bansal, M. J. Hossain, and V. K. Bhargava, “Optimal and suboptimal power allocation schemes for OFDM-based cognitive radio systems,” IEEE Tran. Wireless Commun., vol. 7, pp. 4710-4718, Nov. 2008. [13] State of the Art Review document, “Flexible and spectrum-aware radio access through measurements and modeling in cognitive radio systems,” ICT-248351. [14] D.G. Krige, “A statistical approach to some basic mine valuation problems on the Witwatersrand,” Journal of the Chemistry, Metal and Mining Society of South Africa, vol. 52, pp. 119-139, 1951. [15] R.H. Etkin, D.N.C. Tse and H. Wang, “Gaussian interference channel capacity to within one bit,” IEEE Trans. Info. Theory, vol. IT-54, no. 12, pp. 5534–5562, Dec. 2008. [16] C. Abgrall, E. Calvanese Strinati and J.C. Belfiore, “Distributed power allocation for interference limited networks”, IEEE PIMRC 2010.
402