32
IEEE TRANSACTIONS ON INSTRUMENTATION AND MEASUREMENT, VOL. 56, NO. 1, FEBRUARY 2007
Internet-Based Distributed Data Acquisition System for Fiber-Optic Sensors Przemek J. Bock, Shikharesh Majumdar, Member, IEEE, and Wojtek J. Bock, Fellow, IEEE
Abstract—This paper describes an internet-based distributed data-acquisition system for fiber-optic pressure sensors. There is a great need in industry to coordinate remote resources to perform a common task. The architecture described is based on remote access, via the internet, to a large number of fiber-optic pressure sensors located in different geographical areas. Distribution is done with server applications, which schedule requests for service and control the actual sensor device. Servers also detect conflicts between new requests and their current schedules. Client applications act as virtual instrument panels that dispatch measurement tasks for servers. The architecture supports multiple sensors, which can be added/removed from the system dynamically. As well, there can be multiple clients attempting to access servers simultaneously. Thus, the sensors in question are publicly shared among the various active client applications. Index Terms—Fiber-optic sensors, internet resource sharing, resource distribution, sensor grids, senor monitoring.
I. INTRODUCTION YDROSTATIC, quasi-static, or dynamic pressure is one of the most important measurands in engineering mechanics. Nonelectrical, electrical, or hydraulic pressure transducers embedded in concrete, earth, or rock materials can conveniently be configured to sense a variety of structural loads and responses in such large structures as highway and railway bridges, hydro dams, underground mines, and large buildings. However, none are well suited to more demanding civil engineering environments. Nonelectrical hydraulic devices are costly in terms of labor-intensive inspection, maintenance, and repairs; they are also difficult to multiplex. Electrical measuring devices are out of the question in open-air structures (risk of lightning), and in mining environments (risk of explosion). For these applications fiber-optic sensors (FOS) may offer significant metrological improvements: electrical passivity, high bandwidth, safety in corrosive or explosive environments, immunity to EMI, high sensitivity, miniature dimensions, possibility of remote operation, and direct compatibility with fiber-optic and wireless networks. In this paper, we discuss an internet-based data acquisition system proposed specifically for FOS developed at the Photonics Research Center at the Universite du Quebec en Outauais
H
Manuscript received March 27, 2006; revised October 26, 2006. This work was supported in part by the National Science and Engineering Research Council of Canada. P. J. Bock is with the Centre for Research in Photonics, University of Ottawa, Ottawa, ON K1N 6N5, Canada (e-mail:
[email protected]). S. Majumdar is with the Department of Systems and Computer Engineering, Carleton University, Ottawa, ON KIS 5B6, Canada. W. J. Bock is with the Centre de Recherche en Photonique, Universite du Quebec en Outauais, Hull, QC J8X 3X7, Canada. Color versions of one or more figures are available online at http://ieeexplore. ieee.org. Digital Object Identifier 10.1109/TIM.2006.887778
(UQO), which is particularly promising for integration into the civil engineering structures. The basic system involves a polarimetric pressure sensor based on pressure-induced birefringence effects occurring in highly birefringent (HB) fibers, and developed in a temperature-compensating configuration. The performance of these systems has been analyzed in previous publications [1], [2]. The usual technique of stress and load analysis in civil engineering involves various configurations of hydraulic systems, in which stress in the concrete or rock material surrounding the pressure cell is compensated and measured by externally adjusted hydraulic pressure within the device. Although very reliable and enjoying the confidence of industry, this method is costly in maintenance, difficult to apply remotely, and to multiplex. Its use is only for static loads. Our idea is simple and has high potential for successful implementation: due to its small dimensions, the polarimetric FOS is placed inside a standard, application-specific hydraulic pressure cell filled with a hydrostatic medium. The cell construction is appropriately modified to accommodate the sensor and to allow implementation of our concept for self-compensation of temperature induced fiber birefringence. Such implementation requires the sensing HB fiber of the device to be spliced to an equal length of the compensating HB fiber, with their corresponding birefringence axes rotated at 45 . Consequently, the cell is designed in a way assuring that only the sensing fiber undergoes pressure changes, while the compensating one is completely isolated from such changes. At the same time, both parts of the sensor are placed very close to each other to avoid any temperature gradients that might eventually compromise the quality of temperature compensation. The assembly of the fiber-optic pressure cell (compensated by proper design and proper choice of compatible materials for temperature-induced pressure changes inside it) is composed of two metal plates, which are joined together using a welded sealing to form a pressure pad. After calibration against a pressure standard, the assembly can be safely embedded in concrete using standard procedures, and pressure can now be remotely read via optical fibers and sent via internet to the monitoring station. For a single sensor we have achieved a very high accuracy of pressure measurement up to about 40 MPa at the level of 1% of full scale within a temperature range from 0 C to 45 C. One of the most important requirements for the data acquisition system described in this paper was not to deteriorate this accuracy while operating remotely via the internet. II. DISTRIBUTED SYSTEMS There is an ever-increasing demand in sharing distributed resources among multiple users. Depending on the application
0018-9456/$25.00 © 2007 IEEE Authorized licensed use limited to: Universite du Quebec en Outaouais. Downloaded on July 22, 2009 at 11:36 from IEEE Xplore. Restrictions apply.
BOCK et al.: INTERNET-BASED DISTRIBUTED DATA ACQUISITION SYSTEM
such a resource may be a set of computing devices, a collection of data and storage devices, or—in our case—an array of sensors deployed at various locations. Although the nature of the resources is very different, similar techniques can often be deployed for the effective management of a given resource collection. A common resource management infrastructure, called the grid, is emerging for the coordination and management of various geographically dispersed resources [3]. Tools such as Globus [4] are being developed for providing various types of core services to grid applications. Grids for controlling computing and storage devices are referred to as computing grids, for controlling large distributed datasets are termed data grids, whereas grids controlling arrays of sensors are called sensor grids. A grid managing an ensemble of computers, data resources and sensors is often referred to as an information grid. This paper shares the concerns of sensor grids and focuses on the effective management of an array of fiber-optic pressure sensors shared by multiple users. The notion of a network of sensors is becoming a popular area of research. A survey of wireless sensor networks for performing collaborative applications for example is presented in [5]. The system described in this paper is built using an internet-based client server paradigm. A client that wants to use a specific set of sensors generates a request that is sent via the internet to a server that manages the requested sensor set. The sensors are used by the client for a predetermined interval of time during which measurement data is collected and sent back to the client. The client requests are submitted through a graphical user interface (GUl), whereas the servers perform lower level services such as conflict resolution and scheduling as well as the driving of the sensor hardware. Fundamentally, coordinating multiple devices to do a particular task simply gives the data collected more cohesion and credibility in terms of scope and the overall picture. Software systems for distribution of sensors are still in their infancy. Existing work includes the usage of control software for acquisition of data for water quality [6]. As well, there has been work done in creating generic architectures for distribution [7]. However, there is a fundamental gap between pseudo data-on-demand, and the limitations of IP. The novelty of our project is the service-oriented design of the system and the merger of novel photonics in a distributed grid environment. This paper describes an internet-based distributed data-acquisition system, designed to control several application-specific measurement installations in remote locations by several authorized clients. The emphasis is on a publicly accessible sensor grid with an easy to use interface over a wide area network. The interface in particular was designed to be a convenient “virtual instrument panel” for fiber-optical-sensors. We used sensors designed to measure stress and load in civil engineering structures such as bridges, tunnels, or buildings. The tests were done using a specific type of photonic sensors based on HB fibers, and on polarimetric decoding system mentioned above. Distribution is done with server applications, which schedule requests for service and control the actual sensor devices. Servers also detect conflicts between new requests and their current schedules. Client applications act as virtual instrument panels that dispatch measurement tasks for servers. The architecture supports multiple servers, which can be added/removed from the system
33
dynamically. As well, there can be multiple clients attempting to access servers simultaneously. Thus, the sensors in question are shared among the various client applications, with no loss of accuracy associated with internet access to the measurement data. Although this research focuses on controlling a set of pressure sensors, the higher level services provided and the techniques developed are relevant in the context of other types of Sensor Grids as well. III. TECHNICAL OVERVIEW The design of the distribution architecture is partitioned into three applications: repository, client and server. Below is a technical description of the achieved solution. The design rational is discussed for each component of the system as well as alternative approaches. Implementation details are related to the individual components. This system has at minimum three applications, all running on different hardware nodes. A. Communication Development The system needs communication between hardware nodes via the internet. There are four approaches to facilitate this transfer of information. 1) UDP is the simplest form of transport over IP. It is a bare datagram with no sense of connection, flow control, or error recovery. 2) TCP sockets are a connection-oriented protocol. Sockets are an easy-to-use transfer mechanism, providing flow control and recovery. 3) Universal resource locator (URL) approach. URL could be used with CGI scripts to facilitate communication. 4) Remote method invocation (RMI) is the preferred way [8] for distributed application to communicate with each other. RMI is based on sockets and the serialization of objects. The method of choice for this project is sockets. UDP is too limiting and unreliable for this application, while URL is an unneeded abstraction. As well, Java RMI is complex, time-consuming, and suffers from poor performance [9]. Thus, due to performance and time constraints, the socket approach was preferred. The transfer of information through these sockets was based on Java’s serialization technology. Serialization is streaming objects—their member variables—in order to recover them after transfer. This means that data transfer at the development level will always be in the form of an object and not primitive types. Abstraction of the transfer technology is then achieved, resulting in reduced coupling. Since RMI is based on sockets and serialization, an RMI extension would be much easier to implement using this approach. B. Repository Application This is the starting point for all distribution for this grid. The repository contains a list of server identities (server name, number of sensors attached to the server, sensor description, IP address, listening port number). Servers register with the repository, which makes them visible to the whole system. Clients can contact the repository to request the address space. The repository has no knowledge of any clients. It implements the “client/server” [10] design pattern, thus making it the simplest
Authorized licensed use limited to: Universite du Quebec en Outaouais. Downloaded on July 22, 2009 at 11:36 from IEEE Xplore. Restrictions apply.
34
IEEE TRANSACTIONS ON INSTRUMENTATION AND MEASUREMENT, VOL. 56, NO. 1, FEBRUARY 2007
subsystem (it only does request handling). A major design decision was that this centralized application would not have any influence on scheduling. The repository will not act as an intermediate between the client and all the servers the client wishes to contact. This is significant as scheduling decisions are pushed up to the client. Reasoning behind this is twofold. 1) The more complex the central authority, the less distributed the system becomes. Creating a repository with scheduling “smarts” would cause excessive coupling. 2) As a result of added client functionality, we have a more cohesive client application. If the repository did have scheduling intelligence (all scheduling requests would go through it) a performance bottleneck would result. Ideally, a distributed system like this would only have clients and servers, with no single point of failure. However, there must be a starting point to “get-at” all of the server locations. Naturally, knowledge of the repository address needs to be known beforehand, for clients to function. There are disadvantages to this type of organization. Primarily, the client has to have a scheduling component. This can either be interpreted as positive (increasing cohesion) or negative (increasing coupling) [10]. The other disadvantage is that there are clear benefits with a centralized scheduler. Monitoring, flow control, and error recovery are much simpler if a central application handles them. However, due to the bottleneck issue and decreased distribution, the scheduling is not part of the repository. One of the main requirements of distribution is to handle multiple requests simultaneously without compromising the ability to listen to new requests. There are two possible solutions for this requirement. 1) We have a buffer active object, which listens for requests and queues them up for execution in a first-in first-out (FIFO) order. The buffer is read by a handler thread, which would be responsible for the managing of the request. 2) One listener thread, which would dispatch a new worker thread upon receiving a request. This worker thread would be responsible for the servicing of the request. The latter alternative is preferred due to three factors. 1) Parallel processing can occur while waiting for I/O access resulting in increased efficiency. 2) With a dedicated listener/worker relationship we nev. er need to worry about buffer maintenance. 3) The design is also much simpler and cleaner to implement (the cost of multiple threads is insignificant in Java applications) [11]. This paradigm is used throughout our system. The worker thread, in this case, has access to the address space of the repository and ensures mutual exclusion for modifying its data [12]. C. Server Application The schedule subsystem encapsulates experiment execution and arrangement. When an experiment is accepted, we wrap it as a passive object. This task will then be executed by a timer active-object. From the time-execution perspective, there exists a timer with a list of tasks to do. Each task is a template for running an experiment. The details of what to do during a task are found in the experiment object. When it is time to execute a particular task, the timer invokes the main “run” method of that task. Control is transferred via a high-priority thread. If the task takes a long time to complete, other scheduled tasks may
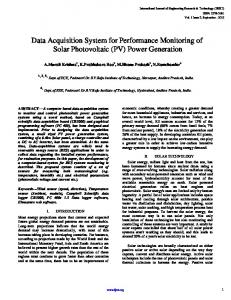
be delayed. We place the transmission of results on a separate low-priority thread. The Java based timer does not make any real-time guarantees. It requests CPU control, but whether that demand is acknowledged is uncertain. In practice, only the garbage collection thread can really affect the performance of the Java timer; therefore, is prudent to avoid object termination (especially windows resources) during time sensitive tasks. This is not a problem as the server has no dynamic GUI or heavy data manipulation needs. Socket cleanup is the only other reallocation problem; however, it is done on a low priority thread, which means garbage collection is unlikely to occur on task execution. The choice to utilize the Java timer facility is based on a number of reasons. Besides the swing-timer (used for refreshing GUls), the Java util. timer is the main API for periodic execution. Secondly, since there can be only one task executing at any given time, there is no need for parallelism with custom threading. Thirdly, there would be no performance improvement if timing were done through the use of individual threads. The demand for CPU, which is made by the timer object, is exactly the same as a thread. Java’s thread scheduler can do no better [11]. D. Client Application Separation of distributed communication transfer was essential. High priority threading was only used to listen for results. Normal priority threading was used to service the reception of results while low priority threading was left for updating the active server list. The data transfer system is designed as a collection of tools. When communication needs to take place, the appropriate tool is invoked to handle the request. Therefore, communication is completely separated from entity and interface classes. This results in increased system robustness due to reduced coupling of software components. The results-marshaling was designed to manage data from multiple simultaneous experiments. Upon reception of a measurement result, the manager will append data to its result sink. If the result is the first one in a given experiment, the system will create a new sink and place the arrived data there. Each data sink has a window associated with it for display purposes. E. System Fig. 1 shows a flow-graph of the functioning distributed measurement system for the view. All messages are asynchronous, which is indicated by the half arrow [13]. On startup of the system, the repository needs to be created. Following this, servers begin to register themselves by sending their locations to this central repository. Once servers have been registered, client applications can start utilizing them. A client would first request the current list of servers by sending a message to the repository as shown in Fig. 1. The repository would then reply by transmitting the list of server locations. Now the client can query any number of servers to perform experiments. The client sets up the parameters specifying which experiments are to be sent to which server. It then dispatches the list of experiments to their target locations. Upon reception of a request for experiment execution, a server returns an acknowledgment to the source client. This acknowledgment would indicate whether or
Authorized licensed use limited to: Universite du Quebec en Outaouais. Downloaded on July 22, 2009 at 11:36 from IEEE Xplore. Restrictions apply.
BOCK et al.: INTERNET-BASED DISTRIBUTED DATA ACQUISITION SYSTEM
35
Fig. 1. System flowgraph for the repository, client, and server.
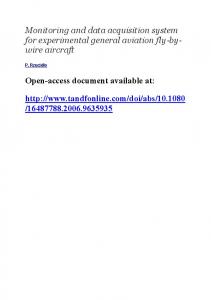
Fig. 2. Client GUI.
not the server accepted the experiment. If there was a conflict in scheduling an experiment, the server will reject it and advise the client of the failure. This is shown by the decision diamond in Fig. 1. Accepted experiments run on the target server for their duration, or until cancelled. When an experiment is executed, the server sends the results back to the source client. Most experiments are periodic in nature, which means that results would be sent periodically whenever readings are taken. Multiple servers make up the system of shared resources. Multiple clients can access these servers. Fig. 1 only shows one instance of the client and server as an example.
IV. RESULTS Accomplishments of this research are the creation of a novel internet-based distributed data acquisition system that is publicly accessible. The system supports multiple client access to servers which act as virtual instrument panels for FOS. It contains GUI for specifying experiment properties, and functionality for dispatching experiments to their target servers as shown in Fig. 2. Each server can handle multiple simultaneous requests and has a conflict detection algorithm, which ensures that requests do not overlap with the current schedule. Servers have a hardware interface, which communicates with
Authorized licensed use limited to: Universite du Quebec en Outaouais. Downloaded on July 22, 2009 at 11:36 from IEEE Xplore. Restrictions apply.
36
IEEE TRANSACTIONS ON INSTRUMENTATION AND MEASUREMENT, VOL. 56, NO. 1, FEBRUARY 2007
scheduled for. Fig. 3 shows a histogram of the average value . It is important to note that this experiment was repliof cated ten times, and the resulting data from all replications was is always positive, meaning that an exaveraged. Note that periment would never execute ahead of schedule. From Fig. 3 we see that the greatest discrepancy of server timing is approximately 60 ms. This is within tolerance of the requirements. The question becomes: does the distributed system adversely affect the measurement data itself? Fig. 3. Maximum time disparity between the time stamp and the actual time of execution of the task was less than 60 ms.
the Wavebook (a data acquisition card for PCs) to perform measurements [14]. After measurement, the server transmits results to that experiment’s client source. Many experiments can simultaneously return results to one client without the loss of data as the system supports multithreaded independent connections. Therefore, we have a complete data acquisition system supporting distribution of resources; control of the resources (sensor hardware interfacing); multiple access handling; dynamic adding/removing of servers; and client dispatching and results management. A. System Testing In distributed systems it is important to test the service response during heavy loads. This can be difficult, as it requires the automation of simultaneous service requests from different sources. This type of synchronization for testing is best done through software triggering; rather then multiple testers using the application. Thus, a test application or class was used to implement multiple client/server requests. This class first initiates the repository. It then instantiates 1000 server applications, all of which attempt to simultaneously register themselves to the repository. Note that this is not entirely “simultaneous” as the thread for each server application is created serially. Statistics for the average service time for each server and dropping probability were measured. We note that, based on priority threading and the resource light Java thread, requests are very rarely dropped. Service time largely depends on the number of instantaneous requests. The more active worker threads instantiated, the slower the response time. One problem with this approach is that the test class must be on a high priority thread; if not, with each successive creation of a new server, the test class will have a smaller time frame to produce a new server. This would delay server creation and reduce the simulated “simultaneous” effect. On the other hand, using low priority server threads may reduce throughput. However, thread instantiation is quick with respect to doing I/O through sockets; therefore, the test class thread priority should not have a significant effect. The next load test is based on timing response. We wish to determine how close the time-stamp (desired experiment start time) is to the actual execution time of an experiment task. For example, we want to run an experiment , where is the at time , while it’s executed at time time difference of the execution. An experiment was run with 100 periods on one server. The server outputted the difference between the time of execution and the time the experiment was
V. DATA INTEGRITY There are several sources of data errors in this sensor grid, which can be divided into two categories: A. Server Related As was mentioned before, data may be acquired late by up to 60 ms on a given server node. Data may also contain errors in the sampling of the measurand. This includes erroneous data as well as possible artifacts in the sensor. Erroneous data is relative to the resolution of the data acquisition device. In our case, the Wavebook’s resolution was approximately 0.3 mV, which was more then the accuracy of the sensor used. Thus, errors related to the Wavebook’s resolution were ignored. Artifacts in the data were eliminated by being sampled at 500 Hz (with anti-aliasing); the extremes were discarded and the resulting data was averaged. Also of note, we measured hydrostatic pressure, which is inherently less prone to errors as opposed to if we were sampling a dynamic pressure system. B. Transmission Related Once the server acquired the data, it was transmitted to the client destination. The transmission protocol used was TCP/IP. Calculating the error introduced to sensor measurements is as follows: firstly, TCP/IP is a connection-based protocol, which contains a 16-bit checksum with a resend on error (triple-ack or timeout). Therefore, the measurement data must contain an error that still passes the checksum; however, this is also complemented with layer 2 from OSI (Open Systems Interconnection model) CRC checks. Secondly, the quantity of errors introduced into the transmitted measurement depends on the path of transmission. Different networks, nodes, and transmission media have different bit error rates. For our testing, we used a local metro-sized network. Another important issue in discussing measurement transmission error is the significance of that error. Measurements in our sensor grid were transmitted as doubles. A double data type consists of: 1 bit for the sign, 52 bits for mantissa, and 11 bits for exponent. Therefore, bit errors to different parts of the double have different effects. Depending on the measurement range, exponent errors can be neglected as well as sign errors; however, errors to the mantissa—especially in the order of significance the user wishes to study—can be problematic. Thus, to calculate the source-to-destination error rate, we must know the bit-error rate (BER) of each link, the transfer point error, and the probability that this will result in a correct checksum with corrupted data on the TCP side. This can be estimated as follows: first, assuming a transmission rate of 1000 packets/second on a very of not detecting an error prone link with a probability of
Authorized licensed use limited to: Universite du Quebec en Outaouais. Downloaded on July 22, 2009 at 11:36 from IEEE Xplore. Restrictions apply.
BOCK et al.: INTERNET-BASED DISTRIBUTED DATA ACQUISITION SYSTEM
37
VI. DISCUSSION
Fig. 4. Pressure measurement over a metro network at temperatures of (a) 14 C, (b) 24 C, and (c) 34 C.
One hurdle for the current architecture is the firewall. Firewalls only allow communication through certain well-known ports. Since communication is based on dynamic socket allocation (different port numbers), socket traffic will be blocked. There are three main solutions to this problem. 1) HTTP-tunneling: We encapsulate the socket connection with an HTTP POST request. Another flavor of this is CGItunneling. Often HTTP proxies fail nonpublic ports [11]. In this case we use CGI-tunneling, which is based on a Java CGI script that must be run on the server-side. This script marshals the HTTP POST message to the proper target. 2) Socket Factories: A feature of Java RMI, which enables clients and servers to create custom socket connections over firewalls. 3) SOCKS: A protocol that proxies socket connections. The first two solutions are designed for RMI. The third solution is an emerging technology that is not widely used. The simplest and least robust answer to the firewall problem is HTTP-tunneling. The problem with that is it often does not work, and Java must settle for CGI-tunneling. This is a great security risk, resulting in all ports “becoming” public [11]. Our solution is to use an IP-over-IP wrapper, much like VPN encapsulate IP for security reasons. This approach allows for tunneling within a socket-based solution. The other issue with internet-based distribution is that of real-time requirements. With TCP/IP, one has no guarantees about packet route, delay, or dropping. However, our experiments show that this is not associated with any loss of accuracy to the sensor system. As packet labeling technologies grow in prominence, internet-based measurement grids will come closer to data-on-demand systems.
error by a lower level protocol (typical BER values are with a 16-bit layer 2 CRC having a probability of detecting that error). We assume 100 of these links need to be traveled to reach the destination. Second, in a 16-bit checksum, the probability of packet corruption with a resulting identical checksum is 1:65536 (assuming randomly distributed checksums). Using these estimates, we can expect about one corrupt measurement packet (correct checksum but faulty data) over 2 years. Of course, this is a very simplistic estimate, but it illustrates that in our sensor grid transmission errors are insignificant—especially since we are not transmitting packets near 1000 per second or the fact that the link error estimate is grossly conservative. Using our local metro-network, we did several remote measurements, which were stored on the local server and compared to the measurements that were transmitted to the client. We found no difference between the two measurement sets of before and after transmission. This was an intuitive result due to the above transmission error estimate. Fig. 4 shows remote pressure measurements from 0 Bar to 240 Bar, and back to 0 Bar. Measurements were conducted at three temperatures of 14 C, 24 C, and 34 C to show the temperature insensitivity of the pressure sensor. The resulting measurements were identical to the measurements stored on the sensor’s server (i.e., before transmission).
[1] W. J. Bock, M. R. H. Voet, M. Beaulieu, T. R. Wolinski, and J. Chen, “Prototype fiber-optic pressure cell for stress monitoring,” IEEE Trans. lnstrum. Meas., vol. 41, no. 6, pp. 1045–1049, Jun. 1992. [2] W. J. Bock, “Fiber-optic sensors for applications in engineering mechanics,” Proc. SPIE, vol. 3189, pp. 68–73, 1997. [3] I. Foster and C. Kesselman, Eds., The Grid. San Francisco, CA: Morgan Kaufmann, 1998. [4] The Globus Alliance, Globus Toolkit [Online]. Available: http://www. unix.globus.org/toolkit [5] I. Akyldiz, W. Su, and Y. Sankarasubramanaim, “Wireless sensor networks: A survey,” Comput. Netw., vol. 38, no. 4, pp. 393–422, Mar. 2002. [6] F. Toran, D. Ramirez, S. Casans, A. E. Navarro, and J. Pelegri, “Distributed virtual instrument for water quality monitoring across the internet,” in Proc. IEEE Instrum. Meas. Technol. Conf., Baltimore, MD, May 2000, pp. 652–656. [7] M. Bertocco and M. Parvis, “Platform independent architecture for distributed measurement systems,” in Proc. IEEE Instrum. Meas. Technol. Conf., Baltimore, MD, May 2000, pp. 648–651. [8] E. R. Harold, Java Network Programming O’Reilly & Associates, 2000. [9] B. Morgan, Distributed Object Alternatives Java World, 1997. [10] B. Druegge and A. H. Dutoit, Object-Oriented Software Engineering: Conquering Complex and Changing Systems. Englewood Cliffs, NJ: Prentice Hall, 2000. [11] “The Java Tutorial: A Practical Guide for Programmers” Sun Corp., 2002 [Online]. Available: http://java.sun.com/docs/books/tutorial/ [12] R. Winder and G. Roberts, Developing Java Software. New York: Wiley, 1998. [13] B. Oestereich, Developing Software With UML Object-Oriented Analysis and Design in Practice. Norwell, MA: Addison Wesley, 1999. [14] Omega Corp, User’s Guide: OMB-Wavebook-512 High-speed Portable Digitizer Omega, 1996.
REFERENCES
Authorized licensed use limited to: Universite du Quebec en Outaouais. Downloaded on July 22, 2009 at 11:36 from IEEE Xplore. Restrictions apply.
38
IEEE TRANSACTIONS ON INSTRUMENTATION AND MEASUREMENT, VOL. 56, NO. 1, FEBRUARY 2007
Przemek J. Bock received the M.Eng. degree in biomedical engineering from McGill University, Montreal, QC, Canada, in 2005. He is currently pursuing the Ph.D. degree in electrical engineering at the Centre for Research in Photonics, University of Ottawa, Ottawa, ON, Canada. He is currently with the National Research Council of Canada, Institute of Microstructural Sciences, Optoelectronic Devices Group, where he is working on advanced spectroscopy techniques for the silicon-on-isolator platform. His research interests are integrated optics, silicon photonics, spectroscopy, and biomedical applications of integrated optics.
Wojtek J. Bock (M’85–SM’92–F’03) received the M.Sc. degree in electrical engineering and the Ph.D. degree in solid-state physics from the Warsaw University of Technology, Warsaw, Poland, in 1971 and 1980, respectively. He is currently a Full Professor of electrical engineering, the Canada Research Chair in Photonics, and Director of the Photonics Research Center at the Université du Québec en Outaouais, Hull, QC, Canada. His research interests include fiber optic sensors and devices, multisensor systems, and precise measurement systems of nonelectric quantities. He has authored and co-authored more than 230 scientific papers, patents, and conference papers in the fields of fiber optics and metrology. Dr. Bock was a member of the Administrative Committee of the IEEE Instrumentation and Measurement Society.
Shikharesh Majumdar (M’89) received the B.S.degree in electronics and telecom engineering and a Diploma in computer science (hardware) from Jadavpur University, Calcutta, India, and completed the Corso Di Perfezionamento from the Politecnico Di Torino, Torino, Italy. He received the M.Sc. and Ph.D. degrees in computational science from the University of Saskatchewan, Saskatoon, SK, Canada. He is a Professor and the Director of the Real Time and Distributed Systems Group, Department of Systems and Computer Engineering, Carleton University, Ottawa, ON, Canada. He worked at the R&D Wing of Indian Telephone Industries (Bangalore) for six years. His research interests are in the areas of gridbased systems, operating systems, middleware, and performance evaluation. Dr. Majumdar has received two awards related to publications in his areas os interest. He is a member of ACM and was a Distinguished Visitor for the IEEE Computer Society from 1998 to 2001.
Authorized licensed use limited to: Universite du Quebec en Outaouais. Downloaded on July 22, 2009 at 11:36 from IEEE Xplore. Restrictions apply.