Cybernetics and Human Knowing. Vol. 17, nos. 1-2, pp. xx-xx
Interpretation of Absolute Judgments Using Information Theory: Channel Capacity or Memory Capacity? Lance Nizami1 Shannon’s information theory has been a popular component of first-order cybernetics. It quantifies information transmitted in terms of the number of times a sent symbol is received as itself, or as another possible symbol. Sent symbols were events and received symbols were outcomes. Garner and Hake reinterpreted Shannon, describing events and outcomes as categories of a stimulus attribute, so as to quantify the information transmitted in the psychologist’s category (or absolute judgment) experiment. There, categories are represented by specific stimuli, and the human subject must assign those stimuli, singly and in random order, to the categories that they represent. Hundreds of computations ensued of information transmitted and its alleged asymptote, the sensory channel capacity. The present paper critically re-examines those estimates. It also reviews estimates of memory capacity from memory experiments. It concludes that absolute judgment is memorylimited and that channel capacities are actually memory capacities. In particular, there are factors that affect absolute judgment that are not explainable within Shannon’s theory, factors such as feedback, practice, motivation, and stimulus range, as well as the anchor effect, sequential dependences, the rise in information transmitted with the increase in number of stimulus dimensions, and the phenomena of masking and stimulus duration dependence. It is recommended that absolute judgments be abandoned, because there are already many direct estimates of memory capacity. Keywords: Shannon, information, absolute judgment, channel, communication, memory
Introduction: Cybernetics, Information Theory, and Psychology In 1948, Professor Norbert Wiener published Cybernetics, or Control and Communication in the Animal and the Machine (Wiener, 1948/1961) and Dr. Claude Shannon published “A Mathematical Theory of Communication” (Shannon, 1948/ 1974). In 1951, Garner and Hake published “The Amount of Information in Absolute Judgments” (Garner & Hake, 1951). The three publications are intimately related. Regarding information, Wiener’s introduction noted that We had to develop a statistical theory of the amount of information, in which the unit amount of information was that transmitted as a single decision between equally probable alternatives. This idea occurred at about the same time to several writers, among them the statistician R.A. Fisher, Dr. Shannon of the Bell Telephone Laboratories, and the author. (Wiener, 1961, p. 10)
Garner and Hake (1951) introduced an experimental method that allowed a Shannon information theory analysis of “how much information an O [observer] obtained about 1. Boys Town National Research Hospital, Omaha, NE (Present address: 1312 Grayson Place, Decatur, GA 30030, USA) Email:
[email protected]
2
Lance Nizami
which of several alternative stimuli occurred” (Garner & Hake, p. 446) in an act of perception. The Garner and Hake approach was quickly and widely accepted in experimental psychology. To date, hundreds of experiments have been done, and concurrent estimates of information-transmitted made, using the Garner and Hake approach. But from the start, theorists expressed reservations about what the Garner and Hake approach actually quantifies (e.g., Cronbach, 1955). Thus, an important question remains: Do we need an alternate interpretation of what the Garner and Hake approach actually does, and if so, can a convincing one be constructed? The present paper answers those questions without presenting new experimental data; it turns out that more than enough already exists in the literature. The Broad Constituency for the Garner-Hake Information Measure Why should we care about the Garner and Hake (1951) measure of information transmission? Because it has been enormously influential in the study of behavior, and it continues to be so. As the psychology historian Alan Collins noted, “By the mid1950s ‘information’ was so deeply embedded in the technical vocabulary of psychology that it has remained there ever since” (Collins, 2007, p. 67). The GarnerHake measure appears in contemporary textbooks and is taught in classrooms. A search of the ISI database reveals that Garner and Hake (1951) has been cited at least 171 times to date in psychology papers, reviews, and abstracts. However, that citation count is misleadingly small. In fact, the chosen reference of those using the GarnerHake computations is the first review of the method and its results, that of Miller (1956a), whose highly readable summary has been cited at least 4,589 times to date. Furthermore, the citing constituency is truly enormous, covering psychology, systems theory, management, information engineering, human factors, music, neurology, and general cybernetics. The present paper will focus on the core papers, those published in psychology and concerning “normal” experimental subjects. Attneave (1959) produced a compact book on the computation of the information transmitted in psychology experiments, which (unlike Miller) included a detailed description of all of the algebra needed for calculating information transmitted. Attneave (1959) has been cited at least 809 times to date. The information measure that Garner and Hake introduced and that was popularized by Miller (1956a) and Attneave (1959) catered to the contemporary desire to describe the brain as an information-processing machine. That desire has not waned. But despite the ongoing interest in the Garner-Hake method, there has been a slow creeping realization that it has not revealed how the brain processes information. Nobody seems to understand why. It seems both important and startling that the brain apparently does not obey a model of information processing for which the experimental conditions appear to be explicitly designed. The present paper offers an explanation that, remarkably, may have been sitting in plain sight all along. It starts with the realization that neither of Garner and Hake (1951) nor Miller (1956a) nor Attneave (1959) provided any actual mathematical or logic proof that the Garner-
Channel Capacity or Memory Capacity?
3
Hake method measured transmitted information. The method was simply assumed correct, and nobody questioned the assumption. Before proceeding to the analysis of the Garner-Hake approach, the author recognizes that there was a concurrent parallel application of Shannon information theory to psychology, that begun by Hick (1952). Hick studied choice reaction times. Many others took up the approach, and it became so popular that the Cambridge mathematician Donald Laming devoted an entire book to it (Laming, 1968). Later, however, Luce (2003) cites Laming as expressing extreme doubts about the whole approach. Note also that there was yet another parallel track, one in which Shannon information theory was applied to the firing of neurons (e.g., MacKay & McCulloch, 1952). That application, too, may prove to be irrelevant (e.g., Andrew, 1984), and is sufficiently complicated as to require a detailed separate examination; an adequate treatment of the topic is well beyond the scope of the present paper. In composing the present paper, the author could have used any and all of a number of psychology review papers that have appeared in the literature over the years since Miller (1956a). Some of those reviews are quite recent. They cover a wealth of experimental results. But all the reviews start with the stipulation that the Garner-Hake method quantifies transmitted information. Perhaps because of this, the reviewers concluded their reviews by expressing frustrations, rather than conclusions, about why the Garner-Hake method did not revolutionize our understanding of the brain. The present author felt that trying to summarize a plethora of opinions would only introduce needless confusion. Rather, a fresh essay was undertaken, by returning to the basics. Wever and Zener (1928) popularized the experimental method that was later used by Garner and Hake (1951). Shannon (1948/1974) provided the algebra that Garner and Hake used to process their data. Three contemporaries, Eriksen, Hake, and Pollock (all to be cited below), did much of the seminal early work that is still cited as archetypal. Not all of the instructive literature is old, however. The most recent paper to be cited here was published in 2008. Nonetheless, the present paper’s reference list is not a reflection of the rate of production of literature over time. Rather, the list is necessarily bottom-heavy, because generally, the earlier the cited reference, the more likely it was that its authors chose to cross-examine the behavior of transmitted information in absolute judgments, rather than taking it for granted. The earlier literature was therefore more likely to supply evidence, if only inadvertently, for alternative hypotheses about what the Garner-Hake analysis of absolute judgments was actually measuring. Presently, short quotations will be used to introduce the various investigators’ own words, to represent the flavor of the concepts as they were originally laid down, and to give credit where credit is due. Special consideration is given to the present author’s own field, the psychology of hearing, which attracted more use of the GarnerHake method than did vision, taste, smell, skin sensation, motion, or kinesthesis, the other senses to be discussed. It was felt necessary to review the 60 years of experimental literature that favored the information theory interpretation, in order to demonstrate that (1) such an
4
Lance Nizami
interpretation is insufficient and, in fact, inappropriate, and that (2) there is an alternative interpretation that is well justified. Cybernetics Background (1): A Very Brief Review of Shannon’s General Communication System Shannon (1948/1974) wished to quantify the amount of information transmitted through a general communication system. Shannon gave a simple box-and-stick model of his system. The present author used Shannon’s accompanying description of his model to produce a somewhat more explanatory illustration of the Shannon system. Figure 1 shows the Shannon system. According to Shannon, a message from a source is passed to a transmitter, which transmits through a channel to a receiver, which passes the received message to a destination. Probabilities lead to information as follows (Shannon, 1948/1974): n events are possible; the event that occurs is the outcome. When n > 1, the outcome is uncertain. What is certain is each event’s probability of occurrence, pi , i = 1,..., n. Figure 2 illustrates these ideas. Shannon argued that (1) uncertainty must be a continuous function of the pi , (2) when all events are equiprobable (pi = 1/n), then uncertainty must increase monotonically with n, and finally (3) uncertainty must be the same whether the outcome occurred through a single step, or through successive steps. Shannon proved that the requisite [amount of] uncertainty, choice, or information, called the stimulus information IS , is IS = −K
n
∑p i =1
i
log p i (1),
K is constant, K > 0. (1)
Shannon noted that K’s value can be adjusted to reflect the choice of units. He set K = 1. Shannon proved that when pi = (1/n) for all i, IS is maximal, thus IS = log n. Events can be symbols k, in which case I S = − ∑ p ( k ) log p ( k ) . (2) k
Cybernetics Background (2): Information Transmitted and the Confusion Matrix Shannon’s Computation of Information Transmitted Shannon (1948/1974) assumed that, for simplicity’s sake, any symbol received is one of the set of symbols sent. Not all symbols will be received as transmitted; unintended errors occur. Let the probability of transmission of symbol k given reception of symbol j be denoted p j (k). Then
Channel Capacity or Memory Capacity?
5
E S = − ∑∑ p j ( k ) log p j ( k ) (3) is the stimulus equivocation/uncertainty/entropy, j
k
and information transmitted I t = I S − E S = − ∑ p ( k ) log p ( k ) + k
∑∑ p ( k ) j
j
log p j ( k ) . (4)
k
Altogether, It can be computed knowing (a) what symbols were transmitted, (b) what symbols were received, and (c) for each symbol sent and each symbol received, the number of times that the latter corresponded to the former. Those values are the elements of the confusion matrix. The confusion matrix in Shannon’s computation of information transmitted The confusion matrix has columns labelled by the symbol sent (the event) and rows labelled by the symbol received (the outcome). Each matrix entry is the number of times that the particular outcome corresponded to the particular event. Figure 3 shows the Shannon confusion matrix for a set of transmitted symbols k. Non-zero off-diagonal elements in the confusion matrix represent lack of transmission fidelity (noisiness). When what is transmitted is identically received, all off-diagonal entries are zero, and It = IS . Cybernetics Background (3): The Use of Shannon Information in Sensory Psychology The Conduct of the Category or Absolute Judgment or Absolute Identification Experiment Garner and Hake (1951) introduced the use of Shannon’s information theory to quantify a human subject’s performance in the sensory psychology experiment called categorization, absolute identification, or absolute judgment. That type of experiment predates Garner and Hake; indeed, it was reviewed in 1928 by Wever and Zener. In absolute judgment, a set of sensory stimuli vary only in the attribute(s) of interest. For simplicity, consider a single attribute, such as physical intensity. Other physical aspects of the stimulus (such as frequency, for example, for a tone, or hue, for a color or a light) are held constant. The experimenter partitions the continuum of the stimulus attribute (the event continuum) into adjacent ranges called stimulus categories. The experimenter chooses the total number of stimulus-attribute categories to be used; for example, Garner (1953) used either of 4, 5, 6, 7, 10, or 20 categories. The latter were named or numbered, usually in a fashion consecutive with increase in the magnitude of the attribute. For example, for intensity, the categories could be labeled “very weak” to “very strong,” or perhaps 1-10 if there were 10 categories. From each category a value of the stimulus attribute was chosen; these
6
Lance Nizami
were the experimental stimuli, the chosen members of the stimulus continuum. Garner and Hake (1951, p. 452) explained that “we are representing ranges or classes of events with a single stimulus value.”2
I mpe rfe c t ( i. e . nois y ) c ha nne l I n f o r m a ti o n S ource
T r a n s m i tte r
R e c e ive r
R e c e iv e d M e s s a ge
+
M e s s a ge
D e s tin a ti o n
R e c e iv e d s igna l ( o u tc o m e )
S igna l ( e v e n t)
N ois e
N ois e S ource
Information flow Figure 1. A general communication system (after Shannon, 1948/1974), to which Shannon applied his information theory. Quoting from Shannon, the system comprises (1) “An information source which produces a message or sequence of messages to be communicated to the receiving terminal” (Shannon, p. 5); (2) “A transmitter which operates on the message in some way to produce a signal suitable for transmission over the channel” (p. 5); (3) “The channel is merely the medium used to transmit the signal from transmitter to receiver” (p. 5); (4) “The receiver ordinarily performs the inverse operation of that done by the transmitter, reconstructing the message from the signal” (p. 5); and finally (5) “The destination is the person (or thing) for whom the message is intended” (p. 5).
The principle behind absolute judgment was well described by Gibson (1953, p. 408): given a sensory stimulus, such as color or odor or weight, “The range of stimuli may be placed along a dimension or continuum; furthermore, the responses which O [the subject or observer] is to learn may be scaled and placed in a consistent relationship or correlation with the stimulus continuum.” Each subject is given an orientation session in which each category is represented by a stimulus from that category. The presentation order of the stimuli is always randomized according to the physical attribute that is varied. There is also a set of response categories, which are adjacent ranges of the stimulus attribute continuum, just like the stimulus categories. The subject states the response category that they believe a given stimulus belongs to (the act of categorization or absolute judgment). The number of response categories need not equal the number of stimulus categories. For example, the experimental subject might be asked to assign 10 different stimuli, representing respectively 10 stimulus 2. The ultimate limit of the size of any category is the psychophysical just-noticeable-difference (jnd), whose value can presently only be established through experimentation.
Channel Capacity or Memory Capacity?
7
categories, to 12 response categories. In that case the number of different given stimuli (one for each stimulus category) does not equal the number of possible responses (the number of response categories). The subject must forcibly evenly distribute the stimuli among the response categories. How that mismatch affects It was thoroughly investigated by Eriksen and Hake (1955a), who found that It tended to be highest when stimulus and response categories were equal in number. That condition quickly became the norm, such that each subject’s task became merely to correctly identify the presented stimuli, the task called absolute identification. The subject repeats that entire process until no further improvement in their performance is apparent. The subject’s performance on that preliminary experiment is used to construct an equaldiscriminability scale of the stimulus attribute for that subject (viz., Garner, 1952). Stimuli equidistant on that scale are used for the remainder of the experiment (the trials from which final Its are computed) because they should be the easiest to discriminate, hence giving the maximum It . Once again, subjects practice the task first. For most stimuli (e.g. auditory tone frequency and intensity, brightness and hue of colors, concentration of tastants or odorants), equal discriminability amounted to equal spacing along logarithmic scales of the physical variable. The exceptions were such things as length or distance judgments, and kinesthetic judgments involving muscular force (e.g., lifted weights), for which equal spacing on linear scales was used.3
3. The effect of stimulus range on It was examined by Bechinger, Kongehl, and Kornhuber (1969) for 3 sensory modalities —time perception, perception of rotary accelerations, and length—and for three distributions of stimuli: linear, power function, and exponential. They found that It was worst for a linear distribution, was best for a power function distribution for one modality (they did not say which), and was best for an exponential distribution for the other two modalities. Remember that an exponential distribution is equivalent to a linear distribution in a logarithmic scale. Thus Bechinger et al. confirmed the long-held view that absolute judgment is easiest when stimuli are spaced equally along a logarithmic scale.
8
Lance Nizami
1 Before: events with probabilities
pi
0 1
2
3
4
n
Event #
Transmission
A fter: The outcome = one of the events (gain of information, reduction of uncertainty)
Figure 2. Events and outcomes.
Events and Transmitters According to Garner and Hake: Conjoining Information Theory and Perception One of the principle concepts that Garner and Hake (1951) used to connect Shannon information to psychology was that “the stimulus can be thought of as an event which occurs with a certain probability” (Garner & Hake, 1951, p. 446). Figure 4 shows the Garner and Hake model in terms of elements of their category experiment. For any particular stimulus attribute, Garner and Hake illustrated an event continuum, such that events had any possible value of the stimulus attribute of interest. From the event continuum, specific stimulus values were drawn at regular intervals. These were deemed members of the stimulus continuum. Each chosen stimulus projects to a response continuum, thus being an intermediate between event and response. Because the stimuli in an absolute judgment experiment are presented one at a time, each stimulus in turn becomes the transmitter, the component of the Shannon general communication system that operates on an event to make an outcome. The computed value of It then expresses “the amount of information about the event continuum which a particular range of stimulus values [those used in the experiment] can transmit” (Garner & Hake, 1951, p. 452) or “the amount of information which the stimuli transmit to an O” (p. 452). For example, Hartman, whose subjects judged tone frequency (pitch naming), noted that “we were to regard our [nine] tones as representing nine items of knowledge about a particular continuum” (Hartman, 1954, p. 6).
Channel Capacity or Memory Capacity?
9
Symbol sent (event)
1
2
-
k
-
n
Row totals
1
N 11
N 12
-
N 1k
-
N 1n
N 1.
2
N 21
N 22
-
N 2k
-
N 2n
N 2.
-
-
-
-
-
-
-
N j2
-
N jk
-
N jn
-
-
Symbol received (outcome)
j
N
j1
-
-
-
-
-
n
N n1
N n2
-
N nk
- N nn
Column totals
N .1
N .2
-
N .k
-
n
total number of symbols received = ∑ N j =1
N .n
N
j.
N
n.
N
n
j.
= ∑ N . k = total number of symbols sent = N. k =1
Figure 3. The Shannon confusion matrix. Njk = the number of times a symbol transmitted as k is received as j . p(j) = Nj. /N = the probability that j was received; p(k) = N.k /N = the probability that k was transmitted; pk (j) = Njk /N.k = the probability that j was received if k was transmitted; and pj (k) = Njk /Nj. = the probability that k was transmitted, if j was received.
If the stimulus was the transmitter in the absolute judgment experiment, what then were the other components of the Shannon general communication system (figure 1), that is, the source, channel, receiver, and destination? The experimenter determines what the subjects judge, and is therefore the source of the message (the string of successive stimuli). If the stimulus is the transmitter, then the subject must be some or all of the remaining components of the system. But it is the experimenter who decodes (receives) the message, recording the subject’s responses, and computing the information transmitted. The experimenter is also the destination. Thus the human subject is the channel. Garner and Hake (1951) actually explained little about the role of the human experimental subject in a communication system. Miller (1956b) stated what Garner and Hake (1951) had likely been thinking: “If a human operator is regarded as a communication channel with stimuli for inputs and responses for outputs, it is possible to estimate maximum rates of transmission through him” (Miller, 1956b, p. 129). That is, what is computed from the psychologist’s confusion matrix is “the amount of information transmitted (by the human channel) from the set of stimuli to the set of responses” (Landau, Buchsbaum, Coppola, & Sihvonen, 1974,
10
Lance Nizami
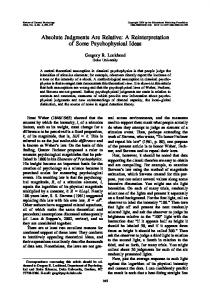
p. 239) or, as Kintz, Parker, and Boynton (1969, p. 241) put it, the “information transmitted through the subject.” The Confusion Matrix for Absolute Judgments Garner and Hake computed information transmitted using Shannon’s algebra (described above), but the confusion matrix for absolute judgments differs from that of Shannon (1948/1974) for transmission of symbols, as follows: The Garner-Hake confusion matrix has columns labelled by stimulus category, and rows labelled by response category. That is, stimulus categories are treated as Shannon events and response categories are treated as Shannon outcomes. Each matrix entry is the number of times that a stimulus taken from the respective stimulus category was classified by the subject as falling within the respective response category. Figure 5 shows the Garner-Hake confusion matrix. The transmitted information It computed from the matrix entries represents “how accurately the O [observer] perceived which of several alternative stimuli occurred on a particular presentation, or how much information the O obtained about which stimulus occurred” (Garner & Hake, 1951, p. 459). Recall that the matrix entries are used to compute the elements of equation (4), from which It is obtained. Base 2 was typically usually used for the logarithms of equation (4), so that information transmitted was quantified in binary units per stimulus, or bits/ stimulus, the units adopted henceforth. As Landau et al. (1974, p. 239) succinctly explained, “The transmission of one bit of information per stimulus is equivalent to the perfect identification of two stimulus categories; transmission of two bits/stimulus to perfect identification of four categories and so on.” The Sensory Channel Capacity Early on, a limit was assumed to the amount of information transmitted through the subject. Miller explained the concept, which had escaped mention by Garner and Hake: If the human observer is a reasonable kind of communication system, then when we increase the amount of input information the transmitted information will increase at first and will eventually level off at some asymptotic value. This asymptotic value we take to be the channel capacity of the observer... (Miller, 1956a, p. 82)
That is, when the number of categories is small enough and each category is wide enough, the subject will make no errors, and information transmitted It will equal the information available from the distribution of the presentation probabilities of the stimulus, the stimulus information IS (equation 2). As the number of categories increases for a fixed range of the stimulus attribute, the subject more frequently makes mistakes, assigning stimuli to the wrong categories. It may nonetheless increase because the number of stimuli increases with the number of categories, hence there is more stimulus information (equation 2). At some point, however, further subdivision of the event (stimulus attribute) continuum into narrower and narrower categories
Channel Capacity or Memory Capacity?
11
(hence more and more given stimuli) can extract no more information. It will plateau, its asymptote dubbed the channel capacity, a notion that was especially encouraged by Miller (1956a) and by Alluisi (1957). Figure 6 illustrates channel capacity. Miller’s (1956a) summary of the early literature led him to state that On the basis of the present evidence it seems safe to say that we possess a finite and rather small capacity for making such unidimensional judgments and that this capacity does not vary a great deal from one simple sensory attribute to another. (Miller, 1956a, p. 86)
Miller’s estimate of the channel capacity was 7 ± 2 categories, memorialized for psychology students the world over in the title of his paper, “The Magical Number Seven, Plus or Minus Two.” Miller’s estimate corresponds to a lower limit of 2.32 bits/stimulus, a mean value of 2.81 bits/stimulus, and an upper limit of 3.17 bits/ stimulus. Miller’s paper encouraged further estimates of channel capacity from absolute judgments because, as MacRae (1970a, p. 112) noted: “The quantitative correspondence between quite different sensory modalities with this technique (Miller, 1956) made it seem likely that some fundamental aspect of performance was being measured.” Tables 1, 2, and 3 detail the maximum empirical Its for a broad range of absolute judgment experiments. The Tables show that the experiments were spread over a great span of time, over many laboratories, and over a vast variety of different stimulus conditions. Only tabulated are Its that were explicitly specified by their discoverers. In contrast, some well-known papers only presented measurements as data points, from which It is too difficult to infer. The number of studies differs by sensory modality, reflecting the different degrees of interest given to those modalities. Regardless of modality, the early measurements of It cluster around 2-3 bits/stimulus, corresponding to 4-8 correctly identified stimuli. This is the quantitative correspondence to which MacRae referred. Problems Caused by the Empirical Behavior of Channel Capacity The Actual Behavior of Information Transmitted With Increase in Number of Judged Stimuli Not everyone accepted the notion of a channel capacity in absolute judgments. A wellcited early proceeding on the use of information theory in psychology contained the first, albeit thinly-veiled, criticism of channel capacity. Therein, Lee J. Cronbach noted: “Pseudo-constancies can arise because of the way measuring procedures are devised, or from balancing of opposing effects. In many studies where some degree of invariance is reported, the experimental design has been insufficiently penetrating” (Cronbach, 1955, p. 15). The significance of the latter sentence, in particular, should soon become apparent in light of the actual behavior of It with increase in number of stimuli. It does not always follow the behavior which had been prescribed by Miller (1956a) and Alluisi (1957). For example, in audition, Pollack (1952) computed It for identification by frequency of tones spanning 0.1-8 kHz. The number of tones judged in any one stimulus series was either of 3, 4, 5, 6, 7, or 10. It rose with number of
12
Lance Nizami
Category 7
Stimulus = Transmitter
Category 7
Category 6
Stimulus = Transmitter
Category 6
Category 5
Stimulus = Transmitter
Category 5
Category 4
Stimulus = Transmitter
Category 4
Category 3
Stimulus = Transmitter
Category 3
Category 2
Stimulus = Transmitter
Category 2
Category 1
Stimulus = Transmitter
Category 1
Response (stimulus attribute) continuum
Event (stimulus attribute) continuum
tones, reaching a maximum for 7 tones, then fell. In a similar experiment, in which tones were presented through earphones rather than through a loudspeaker, the number of tones in each series was either 3, 4, 5, 6, 7, 8, 10, or 14. It rose with number of tones, reaching a maximum for 7, then declined, but suddenly rose again for 14. A peak in the plot of It versus number of judged stimuli is also evident for visual stimuli; the Its for color identification of spots of light of 430-642 nanometers wavelength varied from 3.20 bits/stimulus for 10 colors to 3.35 for 12 colors to 3.66 for 15 colors to 3.20 for 17 colors (Chapanis & Halsey, 1956). Similar behavior was found for odor intensity. Engen and Pfaffmann (1959) had a single, well-practiced subject identify the odor of amyl acetate (banana) when 3, 5, 7, 10, or 13 concentrations were presented. It peaked for 7 concentrations and then gently declined. The same pattern of rise and slow fall was found by Beebe-Center, Rogers, and O’Connell (1955) for the intensity of salt taste using either of 3, 5, 9, or 17 saline solutions.
Figure 4. Information transmission in perception according to Garner and Hake (1951), illustrated here for 7 categories. For the stimulus attribute of interest (for example, physical intensity), and for each experimental subject, preliminary testing allows the experimenter to choose stimuli at equal increments along an equal-discriminability scale. Each such stimulus represents a stimulus category, and transmits information about the continuum of the attribute. Stimuli are presented to the subject in random order and the subject states what they think is the corresponding category (dashed lines). The subject sometimes makes mistakes, assigning stimuli to the wrong category.
But the empirical behavior of It is anything but clear in the literature. Sometimes It seems to gradually asymptote with increase in number of stimuli, and sometimes it seems to peak and decline. But there is a resolution of the conundrum, which lies within statistical arguments. An unintentional clue to that resolution was provided by Garner (1953) whose subjects identified tones of 15-110 dB SPL according to perceived intensity (i.e., loudness). The number of stimuli judged per listening session was either of 4, 5, 6, 7, 10, or 20. Garner processed the subjects’ accuracy scores by
Channel Capacity or Memory Capacity?
13
two methods: first, he gathered all judgments across-subjects and computed It from that data mass; also, he computed It separately for each subject, subject-by-subject, and then averaged across subjects. For Garner’s computations from mass data, It peaked for 5 given stimuli (It = 2.32 bits/stimulus) and then continuously declined, reaching 1.62 bits/stimulus (3 categories) for 20 given stimuli. Conversely, for the computations done subject-by-subject, the across-subject average It appeared to asymptote rather than peak. Clearly, the two methods of computation yielded different results. In fact, the majority of studies compute It using Garner’s second method, perhaps because sometimes a separate equal-discriminability scale (and hence a different set of stimuli) had been constructed for each subject.
Stimulus category
1
2
-
-
k
n
Row totals
Response category
1
N
11
N 12
-
N
1k
-
N
1n
N
1.
2
N
21
N 22
-
N
2k
-
N
2n
N
2.
-
-
-
j2
-
N
-
j
N
j1
-
N
n
N
n1
N n2
Column totals
N
.1
N
-
.2
-
-
jk
-
N
-
N nk
-
N
nn
-
N
-
N
.n
n
total number of responses = ∑ N j =1
.k
jn
N
j.
N
n.
N
n
j.
= ∑ N . k = total number of stimuli = N. k =1
Figure 5. Garner and Hake’s (1951) version of the Shannon confusion matrix. Njk = the number of times a stimulus from category k was stated by the subject as being in category j . p(j) = Nj. /N = the probability that the subject stated that the stimulus was of category j; p(k) = N.k /N = the probability that the stimulus of category k was presented; pk (j) = Njk /N.k = the probability that category j was stated when the stimulus of category k was presented; and pj (k) = Njk /Nj. = the probability that the stimulus of category k was given, if category j was stated.
Lance Nizami
Information transmitted, I t (bits/stimulus)
14
Hypothetical maximum
3 2 1 0 0
10
20
number of stimuli Figure 6. Channel capacity: Miller (1956a), Alluisi (1957), and others postulated that It would increase as the number of categories in a category experiment increased, and hence as the number of different presented stimuli increased, eventually approaching a plateau value to be found through category experiments.
Table 1: Maximum values of information transmitted, It in bits/stimulus, for hearing.* Study
Sense
Frequency (Hz)
Duration (ms)
Feedback (Y/N/U)
It
Note
Garner (1953)
Loudness
See note
1,000
U
2.32
a
Pollack (1953a)
Pitch
100-8,000
2,500
Y
2.32
b
Pitch
60-14,000
2,500
Y
2.40
c
Pitch & loudness
See note
2,500
Y
3.07
d
Loudness
1,000
20
Y
1.54
-
Loudness
1,000
50
Y
1.51
-
Loudness
1,000
2,000
Y
1.74
-
Pitch
100-1,000
50
Y
1.92
e
Tulving & Lindsay (1967)
Channel Capacity or Memory Capacity?
15
Table 1: Maximum values of information transmitted, It in bits/stimulus, for hearing.* (Continued) Sense
Frequency (Hz)
Duration (ms)
Feedback (Y/N/U)
It
Note
Pitch
100-1,000
50
Y
1.62
f
Pitch
100-1,000
2,000
Y
1.98
e
Pitch
100-1,000
2,000
Y
1.89
f
Vianello & Evans (1968)
Pitch
See note
See note
N
2.38
g
Ward & Lockhead (1970)
Loudness
1,000
100
Y
1.27
h
Loudness
1,000
100
N
0.95
h
Landau, Buchsbaum, Coppola, & Sihvonen (1974)
Loudness
500
500
N
1.38
i
Fulgosi & Zaja (1975)
Pitch
50-11,000
5,000
Y
3.092
j
Fulgosi, Bacun, & Zaja (1975)
Pitch & loudness
See note
5,000
U
3.824
k
Locke (1975)
Duration
1,000
See note
U
2.13
l
McNicol (1975)
Loudness
500
1,000
See note
1.731.90
m
Fulgosi, Knezovic, & Zarevski (1984)
Pitch
80-4,400
4,000
Y
3.30
n
Ward (1991)
Loudness
1,000
See note
Y
1.91
o
Loudness
1,000
See note
Y
1.70
p
Loudness
1,000
50
Y
1.5
q
Pitch
100-8,000
50
Y
2.31
-
Pitch
500-3,000
50
Y
2.02
-
Loudness
1,000
500
See note
1.4
r
Loudness
1,000
500
See note
0.8
s
Pitch
100-8,000
500
See note
2.023
t
Study
Mori & Ward (1992)
Mori & Ward (1995)
16
Lance Nizami
Table 1: Maximum values of information transmitted, It in bits/stimulus, for hearing.* (Continued) Study
Sense
Frequency (Hz)
Duration (ms)
Feedback (Y/N/U)
It
Note
Pitch
100-8,000
500
See note
1.91
u
Pitch
100-8,000
500
See note
2.122
v
* Not all cited papers are discussed in the text, and vice versa. Whether feedback was given is indicated by Y (=Yes), N (=No), or U (=Unclear). Estimates may not have been corrected by their authors for the sampling bias noted by MacRae (1970a) and discussed in the text, which overestimates It. Notes: a. Frequency of tone was not mentioned. Intensities of 15-110 dB SPL. b. Nine tones. c. Eleven tones. d. Five frequencies from 125-7,000 Hz, at each of 5 intensities from 20-90 dB SPL. e. Tone intensity was 85 decibels above the detection threshold for a 1,500 Hz tone. f. Tone intensity was 15 decibels above the detection threshold for a 1,500 Hz tone. g. Pure tones corresponding to 3 musical scales from A to G. The authors did not state the tone duration. h. Ten intensities, centered on 60 dB SPL, 1 decibel apart. i. Square wave at 62, 72, 79, 88, or 95 dB SPL. j. It was averaged here over 5 subjects. k. It was averaged here over 5 subjects. Frequencies from 250-3,000 Hz, at intensities that could differ slightly by frequency in order to achieve equal subjective intensity (i.e., loudness); see table I of Fulgosi et al. (1975). l. For normal subjects; 9 tones all at 70 dB SPL, equally spaced from 100 ms to 1,900 ms duration. The 1,000 ms tone preceded each tone as a “mid-range anchor.” Without that anchor, It was 2.01 bits/stimulus. m. By subject group, subjects were either (1) given accurate feedback all the time, and were informed that the feedback was accurate, or (2) were given feedback that was correct on either 100%, 50%, or 20% of the trials, and informed only that the feedback might not be accurate, or (3) not given feedback at all. Respective Its were 1.87, 1.82, 1.85, 1.90, and 1.73 bits/stimulus. n. Median It for 5 subjects. Feedback given in first half but not second half of experiment. o. Intensities of 40100 dB SPL in 3-dB steps; It averaged over durations of 15, 45, 135, 405, 1,215, and 3,645 ms (stimulus duration was not statistically significant). p. Intensities of 45-95 dB SPL in 5dB steps; It averaged over durations of 15, 45, 135, 405, and 1,215 ms. q. Intensities of 6580 dB SPL in 3-dB steps. r. Intensities of 50-86 dB SPL in 4-dB steps; special test method in which sequences of judgments with feedback are alternated with sequences of judgments without feedback. s. Intensities of 77-86 dB SPL in 1-dB steps; special test method in which sequences of judgments with feedback are alternated with sequences of judgments without feedback. t. Six frequencies used; special test method in which sequences of judgments with feedback are alternated with sequences of judgments without feedback. u. Eleven frequencies used; special test method in which sequences of judgments with feedback are alternated with sequences of judgments without feedback. v. Sixteen frequencies used; special test method in which sequences of judgments with feedback are alternated with sequences of judgments without feedback.
Channel Capacity or Memory Capacity?
17
Table 2: Maximum values of information transmitted, It in bits/stimulus, for vision.* Study
Sense
Wavelength (nm)
Duration (ms)
Feedback (Y/N/U)
It
Note
Eriksen & Hake (1955a)
Size
See note
See note
N
2.08
a, b
Eriksen & Hake (1955b)
Size
See note
See note
N
2.84
a, c
Hue
See note
See note
N
3.08
a, d
Brightness
See note
See note
N
2.34
a, e
Size-hue
See note
See note
N
1.92
a, f
Sizebrightness
See note
See note
N
1.62
a, f
Huebrightness
See note
See note
N
1.98
a, f
Size-huebrightness
See note
See note
N
1.89
Chapanis & Halsey (1956)
Hue
430-642
See note
N
3.66
g
Pylyshyn & Agnew (1962)
Distance
See note
10
Y
3.32
h
Distance
See note
1,000
Y
3.42
h
Keene (1963)
Line slope
N/A
2,500
N
3.00
i
Garner & Creelman (1964)
Size
See note
See note
Y
2.685
j, k
Hue
See note
See note
Y
2.345
j
Size-hue
See note
See note
Y
3.295
j
Line length
N/A
200
Y
1.07
l, m
Line position
N/A
200
Y
0.99
l, n
Line length and position
N/A
200
Y
1.22
l, m, n
Line length
N/A
8
Y
0.19
m, o
Line position
N/A
8
Y
0.47
n, o
Lockhead (1966)
18
Lance Nizami
Table 2: Maximum values of information transmitted, It in bits/stimulus, for vision.* (Continued) Sense
Wavelength (nm)
Duration (ms)
Feedback (Y/N/U)
It
Note
Line length and position
N/A
8
Y
0.58
m, n, o
Overall color
N/A
See note
See note
4.32
p, q
Overall color
N/A
See note
See note
4.59
p, r
Garner, Kaplan, & Creelman (1966)
Size
See note
See note
Y
2.19
s
Friedman (1967)
Line length
N/A
See note
Y
4.26
t
Distance
See note
See note
Y
5.48
u
Spitz (1967)
Pointer position along line
See note
See note
Y
3.43
v
Steedman (1967)
Size
See note
2,500
See note
3.38
w
Tulving & Lindsay (1967)
Brightness
See note
20
Y
1.86
x
Brightness
See note
50
Y
1.84
x
Brightness
See note
2,000
Y
2.16
x
Size
N/A
50
Y
2.56
y
Size
N/A
50
Y
2.51
z
Size
N/A
2,000
Y
2.60
y
Size
N/A
2,000
Y
2.77
z
Bevan & Avant (1968)
Size
See note
See note
U
2
aa
Egeth & Pachella (1969)
Size
N/A
1,000
Y
0.70
bb
Eccentricity
N/A
125
Y
1.30
cc
Hue
See note
125
Y
1.48
dd
Size
N/A
1,000
Y
1.11
bb
Study
Feallock, Southard, Kobayashi, & Howell (1966)
Channel Capacity or Memory Capacity?
19
Table 2: Maximum values of information transmitted, It in bits/stimulus, for vision.* (Continued) Sense
Wavelength (nm)
Duration (ms)
Feedback (Y/N/U)
It
Note
Eccentricity
N/A
125
Y
1.34
cc
Hue
See note
125
Y
1.78
dd
Kintz, Parker, & Boynton (1969)
Hue
450-640
250
U
2.6
ee
Fulgosi & Bartolovic (1971)
Size
See note
See note
Y
3.75
ff
Landau, Buchsbaum, Coppola, & Sihvonen (1974)
Line length
N/A
500
N
2.07
gg
Brightness
See note
500
N
1.21
hh
Fulgosi, Lugomer, & Fulgosi (1986)
Size
N/A
See note
N
2.6
ii
Ward (1991)
Brightness
565
See note
Y
1.46
jj
Petrov & Anderson (2005)
Distance
N/A
3,300
Y
1.68
kk
Study
* Not all cited papers are discussed in the text, and vice versa. Whether feedback was given is indicated by Y (=Yes), N (=No), or U (=Unclear). Estimates may not have been corrected by their authors for the sampling bias noted by MacRae (1970a) and discussed in the text, which overestimates It . Notes: a. Duration of stimulus exposure was not mentioned. b. It reported here is an average over two ranges of grey squares (2-42 mm/side and 2-82 mm/side) and three conditions (5 stimuli and 5 response categories; 11 stimuli and 11 response categories; and 21 stimuli and 21 response categories). The experiment was repeated by Eriksen and Wechsler (1955) using 11 stimuli and 11 response categories and squares of 20-50 mm/side in 3 mm increments; It = 1.87 bits/stimulus. c. Stimuli were 20 squares of dark grey paper, of 1/8 inch per side up to 20/8 inches per side. d. Stimuli were 7/8 inch square Munsell papers (see text) having hues from red through yellow, green, and blue, to reddish purple. Brightness was held constant. e. Twenty brightnesses presented at a neutral hue. f. See explanation in text in section on stimuli that vary in more than one dimension. g. Self-paced, i.e., exposure determined by the subject. h. Twenty horizontal distances of 1.9 to 38 inches in 20 equal steps, between 2 white light spots in the dark. Subjects described as having “low anxiety score,” in contrast to patients showing high anxiety. i. It averaged over three different response codes. j. Stimuli were those of Eriksen and Hake (1955b, see table entries above) except that stimulus exposures were 40 ms and 100 ms. It was averaged for those exposures.
20
Lance Nizami
k. Squares were twice as large as those used by Eriksen and Hake (1955b). l. High viewing illumination. m. Lengths of 2.0-2.9 cm in 0.1-cm steps. n. Vertical position, changed in 10 steps of 0.1 cm each. o. Low viewing illumination. p. Duration of stimulus exposure not mentioned. Feedback was given during training but not during testing. q. 10 subjects, 30 colors. r. 16 subjects, 24 colors. s. Black square on white background, projected upon a ground-glass screen. “Stimuli were presented at the rate of approximately one every 7.5 sec” (Garner et al., 1966, p. 637). t. Length of black horizontal line on white background. Duration not mentioned. Final performance of median subject. u Horizontal distance between small white-light bulbs seen as point sources. Duration not mentioned. Final performance of median subject. v. It is averaged over best subject group. Stimulus was a black vertical line (pointer) placed along a narrow white strip illuminated by white light. w. “Green” light of 400-650 nm wavelength. Feedback not given during early sessions, but given during later sessions. It is averaged over four subjects for later sessions. x. White light patch. y. Black circle on white background. Illumination level was 4.2 foot-candles. z. Black circle on white background. Illumination level was 0.003 foot-candles. aa. Projected gray squares; exposure time paced by subject. It estimates were corrected for the statistical bias later reviewed by MacRae (1970a, 1970b). bb. Ellipses, their major axes being 3-4 inches in 0.25-inch steps. cc. An ellipse tilted at either 40, 45, 50, 55, or 60 degrees. dd. Six shades of orange paper. ee. Three-degree-diameter spots of light. It reported here is an average over two subjects and is high due to sampling bias; the real value may be 2 bits/stimulus (MacRae, 1970b). ff. Projected circles of 4-53 cm diameter in 1-cm steps. Maximum exposure duration of 15 seconds. White light from projector. gg. Lines of 1-5 inches in 1inch steps. hh. Iconix photostimulator, diffuse screen; 3-250 ft.-L intensity. ii. Exposure duration not mentioned. Median value of transmitted information for 5 subjects, computed from the second half of the experiment. jj. Point-source LED with luminances of 1.030, 2.318, 5.214, 11.73, 26.40, and 59.39 ft.-L. It reported here is an average over durations of 1, 5, 15, 45, and 135 ms. kk. There were 9 stimuli, each the horizontal space between two white dots on a black background, presented on a computer monitor. It was averaged over 24 subjects.
A Hidden Error in the Computation of Information Transmitted The overestimation noted above was originally traced to a computational phenomenon that has been well-explored in mathematical psychology. That is, there is a sampling bias that gets worse as the total number of stimulus presentations used in computing It shrinks relative to the number of stimulus categories multiplied by the number of response categories. MacRae (1970a) reviewed the bias and its implications for the behavior of It with increase in the number of judged stimuli. In actuality, the number of judged stimuli (which is not the number of stimulus presentations) is usually also the number of stimulus categories and also the number of response categories. Hence, for a fixed total number of stimulus presentations, the overestimation of It increases with the number of different stimuli employed. As such, as MacRae explained, the degree of overestimation can be computed (under reasonable statistical assumptions) and It adjusted accordingly. The stimulus information IS (equation 2) is predetermined by the number of stimuli employed; recall that usually the n different stimuli are made equiprobable, such that IS = log n. IS therefore has no sampling bias. But computation of It (equation 4) also uses ES (equation 3), which is data-based and therefore biased. Treating ES as a random variable with a known distribution allows estimation of the bias and hence the needed adjustment to the respective Its. MacRae (1970a) applied
Channel Capacity or Memory Capacity?
21
this method to published data and concluded that the channel capacity, the apparent asymptote of It with increase in IS , was an artefact of sampling bias. Or, as Cronbach (1955) had put it, the experimental design had been insufficiently penetrating, that is, by failing to use enough stimulus presentations. In fact, for a typical absolute judgment experiment, one that uses more than one human subject, the sampling bias can be mitigated by computing It from a single confusion matrix, as if X subjects judging Y presentations each were replaced by a single subject judging XY presentations. In contrast, calculating Its separately for each subject and then averaging the Its maintains (and, in fact, worsens) the sampling bias. This neatly explains the differing curves found by Garner (1953). Why, then, the continuing references to channel capacity, long after MacRae (1970a)? For the same reason that these references occurred in the first place: The view that transmission remains constant with increasing stimulus information survived in spite of some contrary evidence because the usual effect of bias was to produce a μ-shaped curve with sufficient irregularity for no trend to be compellingly evident. This allowed experimenters and reviewers to plot a best-fitting horizontal line and identify it as the channel capacity ... When a choice of curves was available to represent an experimental design the most flat-topped has usually been chosen ... (MacRae, 1970a, p. 119)
That is, the warning offered by Garner’s (1953) computations either went unnoticed or was intentionally ignored. Despite the eventual warnings of MacRae (1970a), subsequent experimenters continued to use large numbers of stimuli in an apparent effort to discern a channel capacity. For example, Russell and Marteniuk (1974) used 16, Ward (1991) used 21, and Mori and Ward (1995) used 16, all with subjects whose training was merely typical. Table 3: Maximum values of information transmitted, It in bits/stimulus, for senses other than hearing and vision.*
Study
Sense
Substance or treatment
Duration (ms)
Feedback (Y/N/U)
It
Note
Beebe-Center, Rogers, & O’Connell (1955)
Taste intensity
Sucrose
See note
Y
1.6880
a, b
Salt
See note
Y
1.70
a, c
Sucrose & salt
See note
Y
2.2500
a, d
Odor intensity
Amyl acetate
See note
Y
1.52
e
Odor intensity
N-heptanal
See note
Y
1.53
e
Engen & Pfaffmann (1959)
22
Lance Nizami
Table 3: Maximum values of information transmitted, It in bits/stimulus, for senses other than hearing and vision.* (Continued)
Sense
Substance or treatment
Duration (ms)
Feedback (Y/N/U)
It
Note
Odor intensity
N-heptane
See note
Y
1.51
e
Odor intensity
Phenylethyl alcohol
See note
Y
1.58
e
Odor quality
See note
See note
Y
4.03
e, f, g
Odor quality
See note
See note
Y
3.86
e, f, h
Hawkes & Warm (1960)
Electric current intensity
Electric current
500
See note
1.72
i
Bechinger, Kongehl, & Kornhuber (1969)
Rotation
Rotation
See note
U
1.7
j
Time perception
See note
See note
U
2.5
j
Marteniuk (1971)
Arm movement
See note
See note
U
2.48
k
Locke (1974)
Time perception
See note
See note
U
2.07
l
Russell (1981)
Muscular force
See note
See note
U
1.67
m
Sherrick (1985)
Vibration
Vibration rate
See note
Y
2.23
n
Blamey & Clark (1987)
Electric pulsetrain intensity
Electric current
300
Y
1.608
o
Electric pulsetrain intensity
Electric current
300
Y
1.02
p
Lifted weight
Weights
See note
N
1.91
q
Study
Engen & Pfaffmann (1960)
Fulgosi, Bezinovic, Mimica, & Taksic (1987)
Channel Capacity or Memory Capacity?
23
Table 3: Maximum values of information transmitted, It in bits/stimulus, for senses other than hearing and vision.* (Continued)
Study
Sense
Substance or treatment
Duration (ms)
Feedback (Y/N/U)
It
Note
Hettinger, Gent, Marks, & Frank (1999)
Taste quality
See note
See note
N
2.25
a, r
* Not all cited papers are discussed in the text, and vice versa. Whether feedback was given is indicated by Y (=Yes), N (=No), or U (=Unclear). Estimates may not have been corrected by their authors for the sampling bias noted by MacRae (1970a) and discussed in the text, which overestimates It . Notes: a. Self-paced sipping of the solution followed by expectoration (“sip-and-spit”). Estimates of information transmitted were corrected, by Beebe-Center et al. (1955), for the sampling bias which was later reviewed by MacRae (1970a, 1970b). b. Nine concentrations of sucrose, from 1 to 115 grams sucrose per 100 ml tap water. c. Nine concentrations of NaCl, from 0.30 to 34.7 grams NaCl per 100 ml tap water. It here was averaged over 2 subjects. d. One, 4, 19, or 115 grams sucrose in all possible combinations with 0.30, 1.0, 4.8, or 34.7 grams NaCl, all per 100 ml tap water. e. Self-paced sniffing. f. Stimuli identified according to unique labels invented separately by each subject. g. Twenty-four odorants chosen for their differences in odor quality; unequal subjective intensities. h. Twenty-four odorants of similar odor quality (i.e., sweet, fruity); unequal subjective intensities. i. Feedback was given to one subject group but not to another, with no apparent difference in effect. Stimulus was a 1,500 Hz sinusoidal current with intensities between the detection threshold and the pain threshold. Electrodes were applied to the pad of the index finger and the palm of the same hand. j. Many details of the experiment were not specified by Bechinger et al. in their Brief Report. k. “Judgments of the extent to which their extended right arm was voluntarily moved in the horizontal plane” (Marteniuk, 1971, p. 69). The pace of the task was not described. l. Durations of 1 kHz tones presented at 70 dB SPL in each earphone of a headset. It listed is for 9 tones evenly spaced between 0.10 and 1.90 seconds duration. For 3 tones (0.10, 1.0, and 1.90 seconds), It = 1.52; for 5 tones, It = 1.99. m. Stimulus was described by Russell as torque. Subject’s wrist was placed in a vertical sling attached to a post, and his elbow rested on a table; subject exerted increasing downward force until experimenter indicated that target force had been reached and had to be identified. Self-paced. n. Stimulus was frequency of haversine waveform of vibration of a reed applied to the fingertip. Stimulus duration set by subject’s reaction time. o. Trains of biphasic electrical current pulses, varied in width of each pulse in order to vary current intensity. Electrodes at finger and wrist. It averaged over 5 subjects. p. Trains of biphasic electrical current pulses, varied in number of pulses/second (pulse rate) in order to vary current “frequency.” Electrodes at finger and wrist. It averaged over 7 subjects. q. Weights of 22-292 grams. Comfortable pace set by the experimenter. r. Ten tastants in solution: 0.1 M NaCl, 0.1 M KCl, 0.1 M MSG, 0.1 mM quinine HCl, 3.0 mM citric acid, 0.3 M sucrose, 3.0 mM aspartame, NaCl-sucrose mixture, citric acid-sucrose mixture, quinine HCl-sucrose. Tastant concentrations in the mixtures were the same as in the single stimuli.
24
Lance Nizami
The Actual Behavior of Information Transmitted in Absolute Judgments The Role of the Subject’s Rate of Making Mistakes It is generally acknowledged that the experimental subject makes mistakes in stimulus identification. If we consider the rate at which the subject makes mistakes, and we respect sampling bias, we can interpret how It changes with increase in number of stimuli. If the rate of mistakes does not change, It will monotonically increase, yielding an asymptotic channel capacity. As noted above, however, the latter is an illusion. Hence, the subject does not make mistakes at a constant rate. Rather, as the number of stimulus categories increases, some crucial number of categories will be reached at which the subject’s rate of mistakes will have increased enough to make It peak. Further increase in the number of categories will cause the rate of stimulus misassignments to outstrip the growth of IS , so that It will then monotonically decrease. Figure 7 illustrates the proposed interplay of IS and ES that produces the sort of curve that characterizes It when data are corrected for the sampling bias. The Change in the Rate of Making Mistakes Why would mistakes be made at different rates? Ironically, the answer lies with Garner and Hake (1951). They admitted that category or absolute judgments “are probably made by comparing the present stimulus with some average subjective standard” (Garner & Hake, p. 446). That is, the subject’s absolute judgments may actually be comparisons. What then is being compared to what in the absolute judgment experiment, in terms of actual events and outcomes? Empirically, a detectable stimulus evokes a sensation. Generally, sensation rises monotonically with intensity. Thus, to the experimental subject, the stimulus is a sensation and the stimulus/response categories correspond to ranges of sensations; that is, the rows and columns of the psychologist’s confusion matrix correspond to ranges of sensations. The subject’s task is therefore to place a sensation within a sensation range. To do so, the stimulus-evoked sensation is compared to what remains, in the subject’s mind, of the sensations of the exemplar stimuli that were given during training and practice. This comparison process is repeated many times in order to obtain the elements of the confusion matrix. Comparison gets harder as the number of categories increases. For example, when there are just 4 categories, categorization by the subject will be easy. For 7 categories, categorization becomes harder, but It may exceed the case for 4 categories because of the rise in IS with rise in number of categories. By 12 categories, however, the rise in IS is not enough to compensate for the rising value of ES , so that It drops. The reason that performance is worse with 12 categories than with 7 is that the memory traces of the exemplars are not as distinct for 12 categories as they were for 7 categories.
I S , E S , or I t (bits/stimulus)
Channel Capacity or Memory Capacity?
25
IS 4
ES
3 2 I t (actual) 1 0 0 1
10
20
Number of categories Figure 7. The interplay of stimulus information IS (equation 2) and stimulus equivocation ES (equation 3) to produce information transmitted It = IS – ES (equation 4), with increase in the number of categories in a category experiment. The stimuli are assumed to be presented with equal probabilities, and logarithms to base 2 are used. The It curve is empirical, based on Garner (1953, figure 1) for the loudness of tones of 15-110 dB SPL and Beebe-Center et al. (1955) for saline solutions of 0.0030 - 0.347 kg/l. ES was not given, and had to be inferred from IS and It .
The Role of Memory in Channel Capacity What is Measured During Absolute Judgments? Miller’s now-famous review of the Garner-Hake application of Shannon information to perception (Miller, 1956a) not only introduced “the magical number seven,” it also summarized some contemporary literature on memory capacity. Miller offered that summary because he had found a curious coincidence, namely, that we can correctly recall about 7 items, just as “there is a span of absolute judgment that can distinguish about seven categories” (Miller, 1956a, p. 91). Elsewhere that same year, Miller described how tests of memory capacity were done: In the simplest test of mnemonic capacity, a sequence of symbols (usually decimal digits) is read aloud or shown to the person at a regular rate (usually one per second) and at the end of the sequence he is asked to repeat or write the symbols in the correct order. The experiment begins with short sequences and increases the length [sic] until the person is no longer able to repeat the entire sequence without error. This point is called the “span of immediate memory.” (Miller, 1956b, p. 131)
Miller (1956a) failed to mention that a great deal of evidence had accumulated between 1887 and 1925 in favor of a memory span of 7 ± 2 items. Guilford and Dallenbach (1925) summarized that evidence, obtained from 27 variations of the method later described by Miller (1956b; above). Guilford and Dallenbach (1925)
26
Lance Nizami
suggested that the memory tests lacked sufficient computational rigor, and should be replaced by the limen: “The limen of immediate memory or the memory span is defined as that length of series which has the probability 0.5 of being retained; in other words, that length of series which is as likely to be remembered as not” (Guilford & Dallenbach, p. 626). Guilford and Dallenbach obtained limens of 6.713 to 9.985 digits. In another experiment they found a limen of 7.583 digits. The 7 ± 2 span was confirmed by Broadbent (1975) in a review of memory measurements which were done from 1956 to 1973. Cowan (2000) thoroughly canvassed the literature since Broadbent, and concluded that “there is a relatively constant limit in the number of items that can be stored [in memory] in a wide variety of tasks” (Cowan, p. 88). However, Cowan concluded that the limit was 4 ± 1 rather than 7 ± 2. Miller’s famous 7 ± 2 is then the sum of two memory groups, 4 ± 1 and 3 ± 1. Further, replacing Miller’s 7 ± 2 by Cowan’s 4 ± 1 does not obviate a connection between memory capacity and It . Numerous experiments have shown that the It that is typical for minimally-trained subjects is 2 bits/stimulus, corresponding to 4 correctly identified stimuli (e.g., Eriksen & Hake, 1955a; Hawkes & Warm, 1960; Tulving & Lindsay, 1967; Vianello & Evans, 1968; Bechinger et al., 1969; Landau et al., 1974; Locke, 1974, 1975; Fulgosi, Bezinovic, Mimica, & Taksic, 1987; Mori & Ward, 1992; Mori & Ward, 1995; Hettinger, Gent, Marks, & Frank, 1999). It > 2 bits/stimulus likely reflects greater practice by the subjects, as will be explored below (e.g., Pollack, 1953a; W.D. Ward, 1953; Hanes & Rhoades, 1959; Pylyshyn & Agnew, 1962; Terman, 1965; Feallock, Southard, Kobayashi, & Howell, 1966; Friedman, 1967; Steedman, 1967; Cuddy, 1968; Egeth & Pachella, 1969; Fulgosi & Bartolovic, 1971; Heller & Auerbach, 1972; Fulgosi & Zaja, 1975; Fulgosi, Knezovic, & Zarevski, 1984; Fulgosi, Lugomer, & Fulgosi, 1986). Memory Capacity Does Not Depend on Information Content The provisional equality of information transmitted and memory capacity first noted by Miller (1956a) seemed to imply two things. First, it seemed to imply that the information load encapsulated within the memory capacity is constant; and secondly, it seemed to imply that the memory load encapsulated within the maximum information transmitted is constant. Regarding the latter possibility, Miller himself noted that If the amount of information in the span of immediate memory is a constant, then the span should be short when the individual items contain a lot of information and the span should be long when the items contain little information. (Miller, 1956a, p. 91)
Miller reviewed the literature and found that It is the length of the sequence, rather than the amount of information per item, that is the critical factor. For example, a person who can repeat nine binary digits will have a span of about eight decimal digits, seven letters of the alphabet, or five monosyllabic English words. These represent 9, 25, 33, and about 50 bits [per stimulus of information transmitted], respectively. Clearly, the
Channel Capacity or Memory Capacity?
27
memory span is more nearly invariant when we measure it in terms of the length of the sequence than when we measure it in terms of the amount of information stored. (Miller, 1956b, p. 131)
That is, the number of items correctly remembered is far less variable than their information content, so that the amount of information carried within the memory capacity is unlikely to be constant. Of course, this applies “when the material to be learned does not form a familiar sequence” (Miller, 1956b, p. 133), that is, the memorized material should not contain such things as words or known telephone numbers, as “The organization into units is easier with familiar text than with random sequences of symbols” (Miller, p. 134). Miller’s conclusion was based upon papers such as that of Pollack (1953b), which will now be described in order to demonstrate that Miller was right. Pollack gave his subjects messages that were strings of equiprobable and randomly-ordered numerals and consonants. The information in each message can be made to be independent of message length, as follows. A message can be characterized by the number of choices made between two equally-likely alternatives, that is, the stimulus information in bits. For a simple message, for example, one of 8 equally-likely consonants or numerals, 3 choices are required in order to characterize the message, and the stimulus information is log 2 8 = 3 bits. Alternatively, a message can be a string of three letters, each letter a Y or an N, for which there is still 8 possible strings for which the order matters, so that 3 choices between 2 alternatives each are required to specify any given string, that is, log 2 8 = 3 bits. In the actual experiment, strings of numerals and consonants were dictated to the subjects at a reasonable pace. Each listener then wrote what they heard, from which Pollack computed the Shannon information transmitted. The difference between stimulus information and information transmitted was found to depend upon message length, but not upon the number of possible alternatives per each constituent item. That is, length was crucial to correct recall, but information content was not. Information per item was then held constant, for which the stimulus information is log ([# alternatives/constituent]message length) = message length • [# alternatives/ constituent], that is, the stimulus information is directly proportional to the message length. For those messages, It increased with message length up to 7-15 constituent items, then gradually declined thereafter as the number of constituent items continued to increase up to twenty-four. It also transpired that for short messages having many alternatives per constituent item, It was larger than for long messages with few alternatives per constituent item. Altogether, Pollack showed that information content was not the crucial factor in message recall. The latter conclusion has since been solidly confirmed, for example by Slak (1974) using several increasingly complicated sets of stimuli. The simplest consisted of the numbers 0 and 1, as two equally likely alternatives thus having a stimulus information of 1 bit/digit (21 = 2). Slak also employed the numerals 0, 1, 2, and 3 (2 bits/digit), the numbers 0-7 (3 bits/digit), and the numbers 0-9 together with the letters u-z (altogether 4 bits/digit). Each set of stimuli was arranged into many strings, each a
28
Lance Nizami
sequence of randomly-picked stimuli from the stimulus set. The strings varied from 3 to 12 items in length. After each string was revealed the subject had to recall it. On average, the subjects recalled correctly 7.92 items for the stimulus set having two constituents, 6.68 items for the stimulus set having 4 constituents, 6.76 items for the stimulus set having 8 constituents, and 6.15 items for the stimulus set having 16 digits. In other words, 7 ± 1 digits were correctly remembered. In terms of a memory capacity of 4 items (Cowan, 2000), the 7 correctly remembered digits was presumably the sum of a group of 4 correctly remembered digits and a group of 3 correctly remembered digits. Memory is Crucial to Channel Capacity There is firm evidence that memory capacity is independent of the information content of messages. The converse question remains: Is maximum information transmitted in absolute judgment experiments independent of memory capacity? To answer this question, the present author reviewed roughly 60 empirical reports of information transmitted in absolute judgment. General evidence that memory is crucial to channel capacity. The absolute judgment task predates Garner and Hake (1951). In a detailed review, Wever and Zener (1928) concluded that absolute judgments involve some “mental formation through which knowledge of the [stimulus] series is carried” (Wever & Zener, p. 471), formed only after familiarization with all or most of the stimuli, and persisting for some time. Wever and Zener found evidence for persistence from judgments of weights, evidence replicated by Di Lollo (1964). Wever and Zener (1928) noted persistence for judged frequency (pitch), data that was reinforced by Campbell, Lewis, and Hunt (1958) for pitch and by Miller and Engen (1960) for identification of straight lines by their lengths. Inadvertent evidence for memory involvement came from Klemmer and Frick (1953), who had subjects perform a so-called “absolute judgment” task in which each stimulus was one or more white dots inside a white square outline on a black background, briefly flashed upon a screen. But rather than identifying the stimulus by a name or a number, the subjects were required to simply record what they saw, that is, reproduce what was in their immediate memory, on gridded paper. Comparison to mental archetypes of stimuli was obviated. For each of numerous different numbers and placements of dots, It turned out to be very close to IS , even what the latter rose to 8 bits/stimulus! That is, information transmission became extraordinarily good when the memory strain involved in genuine absolute judgments was removed. The lower Its found in standard absolute judgment scenarios suggests that memory strain is inherent to absolute judgment. Klemmer and Frick (1953) was replicated and extended by Petiot and Parrot (1980). What transpires when the need to remember a set of learned archetypes is removed was also shown by Chapanis and Overbey (1971). Their subjects identified 36 colors, covering the whole color spectrum. First, however, a unique name, chosen to be as intuitive as possible, was given to each color. Each stimulus was presented just once per trial block, and the subjects were given a
Channel Capacity or Memory Capacity?
29
list of all 36 names during testing. After the second block of judgments, subjects were also told the correct answer on each judgment. Overall, then, the subjects could mentally check off the received stimuli. After at most 12 test blocks, the subjects all gave perfect identifications, such that It = IS = log 2 36 = 5.17 bits. Naturally, It rose to its maximum when memory strain was reduced to a minimum. Rather than reducing memory load, Tulving and Lindsay (1967) added a distraction to the absolute judgment task. Their subjects judged the intensities of 1 kHz tones (loudness) and white light patches (brightness). Either just tones were presented, or just lights, or both simultaneously. In the latter case, the subjects either judged just one stimulus type, or both, one after the other. Judging lights and tones reduced the respective Its relative to the Its found when only one or the other had to be judged. The same effect was subsequently found for sizes of black circles versus tone frequencies. Tulving and Lindsay considered various models for their results, finally concluding that It is also possible that the bottleneck in information flow in the absolute judgment task involving simultaneous stimuli from two modalities lies at the output side, and that the observed impairment in performance under these conditions is attributable to response conflict or memory factors rather than to perceptual processes. (Tulving & Lindsay, 1967, p. 109)
In other words, the observed restrictions on It were caused by distraction at the brain, rather than information capacity at the sensory receptor. Egeth and Pachella (1969) found a similar effect for tasted solutions that contained both salt and sugar and that were judged on both saltiness and sweetness. Particular evidence that memory is crucial to channel capacity. There are some unique features of absolute judgment experiments that imply that memory plays a crucial limiting role in absolute judgments. One feature is the effect of feedback. Giving feedback means that the subject is informed, judgment by judgment, of the correctness of their responses. Empirically, feedback improves the subjects’ correctness scores overall, hence improving It (e.g., Hartman, 1954; Engen & Pfaffmann, 1959; Agnew, Pyke, & Pylyshyn, 1966; Friedman, 1967; Steedman, 1967; Ward & Lockhead, 1970; Siegel, 1972; McNicol, 1975; Mori & Ward, 1995). Certainly, no-one suggests that feedback should reduce It . The possibility of improvement through feedback was ignored early on, such that many of the earliest It estimates (i.e., some of the lowest values in Tables 1-3) likely represented minimal values. Recall that calculating It (equation 4) requires knowing what was transmitted and what was received. But the Shannon general communication system does not use that knowledge, either symbol-by-symbol or even retroactively, to improve its efficiency. Judgment-by-judgment feedback in absolute judgment thus violates the Shannon general communication system, the model that underlies Shannon’s algebra. However, this point is generally ignored in the absolute judgment literature; feedbackinfluenced results are given equal weight to those that are not.
30
Lance Nizami
There is another influence that is not generally questioned in the absolute judgment literature, that of practice. Since Garner and Hake (1951), psychologists have taken the attitude that obtaining valid estimates of It from human subjects requires only a brief initial familiarization of the subject with the absolute judgment task, notwithstanding the number of the different stimuli to be categorized. It transpires, however, that repeating the absolute judgments (with appropriate breaks) improves It (e.g., Pollack, 1953a; W. D. Ward, 1953; Eriksen & Hake, 1955a; Hanes & Rhoades, 1959; Pylyshyn & Agnew, 1962; Terman, 1965; Feallock et al., 1966; Friedman, 1967; Steedman, 1967; Cuddy, 1968; Vianello & Evans, 1968; Egeth & Pachella, 1969; Fulgosi & Bartolovic, 1971; Fullard, Snelbecker, & Wolk, 1972; Heller & Auerbach, 1972; Fulgosi & Zaja, 1975; Costall, Platt, & MacRae, 1981; Fulgosi et al., 1984; Fulgosi et al., 1986; Hettinger et al., 1999; Petrov & Anderson, 2005). Practice is a form of training, and training consolidates a task in memory. In contrast, Shannon’s general communication system has no built-in learning algorithms, and needs no training. Logically, then, a process that improves with training can hardly be characterized by Shannon information measures. Further, after discontinuation of practice, forgetting sets in, and absolute judgment performance declines (Gibson, 1953), although the decline can be gradual; for example, the ability to correctly identify sizes of discs, once learned, persisted for five weeks (Steedman, 1967). There is, however, no forgetting within a Shannon general communication system. Human memory is imperfect; thus, no matter how good the subject’s training, the dependence of It on the number of stimuli for an absolute judgment task (figure 7) will always maximize and then decline; the peak will merely shift rightwards with practice. The Shannon general communication system has no emotional contents. Therefore, for humans to be channels as imagined in the psychologist’s interpretation of information transmission, the subject’s level of motivation cannot affect It . Among psychologists, however, it is widely agreed that when subjects are better motivated, they perform better, and that is true of absolute judgments (e.g., Rouder, Morey, Cowan, & Pfaltz, 2004). Another interesting finding is that for a given number of stimuli, It tends to increase with the physical range covered by those stimuli (e.g., Eriksen & Hake, 1955a; Pollack, 1956; Engen & Pfaffmann, 1959; Garner, Kaplan, & Creelman, 1966; Mori & Ward, 1992; Brown, McCormack, Smith, & Stewart, 2005). This is not a characteristic of the Shannon general communication system. In terms of memory, however, there is a straightforward explanation; as the stimuli get farther apart from each other, they are easier to tell apart, hence easier to recall. We might therefore expect that if the number of stimuli drop but their physical separation increases, then It remains constant. Alluisi (1957) confirmed that trade-off. There are also two kinds of shifts in performance that are peculiar to absolute judgments. One is illustrated by Heintz’s experiments on absolute judgment of lifted weight (Heintz, 1950). Heintz’s experiment was atypical in that Heintz’s subjects did not do just the usual absolute judgments, but also did additional series in which a heavier comparison weight was lifted before lifting and judging each of the test
Channel Capacity or Memory Capacity?
31
weights. In the latter sessions, the masses of the test weights were consistently underestimated relative to when the comparison weight was absent. The comparison weight was made heavier from session to session, and the underestimation, dubbed contrast, became more extreme. Salzinger (1957) replicated contrast using heavier comparison weights than Heintz. Now, in the Shannon general communication system, the equivalent to judging only the test weights is to only receive the symbols comprising the sent message, even if a fixed symbol (corresponding to the comparison weight) is inserted between each transmitted symbol. Thus, if the human being is a Shannon system, It should not have changed with the introduction of the comparison weight in the Heintz experiment. But It did indeed change. One explanation for Heintz’s findings is that the sensation of the comparison weight used in each session was retained in memory and used as a reference standard in identifying the weights. Besides contrast, another kind of shift in performance that is peculiar to absolute judgments is the observed tendency, in the absence of an introduced standard, “for a response to a given stimulus category to be higher when the preceding stimulus is higher than the one being judged, and lower when the preceding stimulus is lower” (Garner, 1953, p. 377). This is an example of sequential dependence, a known property of absolute judgments (Tresselt, 1947) in which each judgment depends upon the previous stimulus or stimuli, or even upon the responses given to those stimuli. This particular sequential effect was dubbed assimilation. It occurs even when subjects are given feedback (e.g., Holland & Lockhead, 1968), which should have allowed the subjects to adjust their responses away from any systematic prejudices. Both assimilation and contrast were found for lifted weights by Sherif, Taub, and Hovland (1958), which was replicated and extended by Parducci and Marshall (1962). Assimilation and contrast also occur for judged intensities of 1 kHz tones and for judged lengths of lines (McKenna, 1984). Assimilation was also seen for durations of a tone and for tone frequency (Brown et al., 2005), for line lengths (Rouder et al., 2004), and for distances between spots of light (Petrov & Anderson, 2005), in experiments in which contrast was not employed. Assimilation has no counterpart in a Shannon general communication system. However, a sophisticated and elaborate experiment on sequential dependences carried out by Luce, Nosofsky, Green, and Smith (1982) implied that the stimulus on the trial preceding the one of interest acts as a memory aid when the two stimuli are similar, and as a memory confuser when the two stimuli differ. Certainly, if the preceding stimulus is the same as the given stimulus, the latter is identified with much greater accuracy than otherwise (Costall et al., 1981). Another peculiar property of absolute judgments is that accuracy of identification tends to be higher for the stimuli that have the lowest and highest values of the judged physical characteristic, with a concomitant decrease in the variability of the assigned identity. This phenomenon, called end-anchoring, was found by Pollack (1952, 1953a), Garner (1953), Eriksen and Hake (1955a), Engen and Pfaffmann (1959), Pylyshyn and Agnew (1962), Terman (1965), Spitz (1967), Steedman (1967), Cuddy (1968), Holland and Lockhead (1968), Snelbecker and Fullard (1972), Lacouture and
32
Lance Nizami
Lacerte (1997), Elvevag, Brown, McCormack, Vousden, and Goldberg (2004), Rouder et al. (2004), Brown et al. (2005), and Petrov and Anderson (2005), among others. Eriksen and Hake (1955a) explained end-anchoring in a hypothesis that has never been disproven. That is, in the absence of any introduced artificial comparison stimulus, the lowest and highest stimuli in the employed stimulus set form natural standards for judgment. The further the judged stimulus is from either of these end standards, the less likely it will be correctly identified. Eriksen and Hake confirmed their hypothesis through several experiments that are too elaborate to be described here. Pollack (1953a) had already shown that end-anchoring decreased when the use of end stimuli as standards was prevented or obstructed by various means. That finding was confirmed by Cuddy (1968), Heller and Auerbach (1972), and Locke (1975), among others. In another approach, the influence of the end stimuli can be obviated by presenting a stimulus set having no apparent ends, such as the color wheel of colors perceived by human subjects. Absolute judgment of colors from the color wheel shows no obvious anchoring (Volkmann & Engen, 1961). It is also possible to construct a set of complex tones that give the illusion of a “circle” of pitches. Using such a stimulus set, no distinct anchoring appears (Costall et al., 1981). In a different twist, Neath, Brown, McCormack, Chater, and Freeman (2006) found that the middle stimulus (by judged characteristic) of an odd (i.e., uneven) number of different stimuli is identified just as well as the end stimuli of the set, when that middle stimulus is separated further than usual (by judged characteristic) from its nearest neighbors. This occurred for four different judged characteristics: tone frequency, weight, rod length, and numerosity of squares presented on a computer monitor. Hypothetically, making the middle stimulus more perceptually distinct aided its remembrance and hence its identification (Neath et al., 2006). Perhaps the most conclusive single set of experiments on absolute judgments was that of Siegel (1972). Siegel’s experiments concerned all of feedback, sequential dependences, and anchoring. Siegel tested a crucial hypothesis: that when subjects are told the correct answer after each judgment (feedback), the correct answer is remembered and makes that particular stimulus easier to identify on its next appearance. Of course, memories fade, so the strength of the effect should decline as the retention interval between any two identical test stimuli lengthens. That is, the smaller the retention interval, the higher should be the information transmitted by that stimulus. And, broadly, this is what Siegel found. Siegel (1972) bolstered his results through three further similar experiments. Altogether, he concluded that “If there is a channel capacity for absolute judgments of unidimensional stimuli, it is an asymptote on forgetting” (Siegel, p. 125). Siegel’s findings were confirmed by Aiken, Abrams, and Shennum (1973). His finding of greater accuracy for zero retention interval than for longer intervals was repeated by Costall et al. (1981). So far, we have only considered stimuli that vary along one physical dimension, such as the intensity or frequency of an auditory stimulus or a reflected light, or the concentration of a substance in a liquid solution (for odors or tastes), or even the length of a straight line. However, stimuli used for absolute judgments can be made to
Channel Capacity or Memory Capacity?
33
vary physically in more than one dimension. For each given stimulus the subject then categorizes each dimension in turn. For example, for a tone, the experimenter can change both the intensity and the frequency, and the subject then categorizes each tone by its intensity and then by its frequency (or vice versa). There are multidimension versions for equations (2-4) that can be used to compute It (e.g., Attneave, 1959). For each individual physical dimension, It is still calculated using equations (2-4). The unidimension Its computed from stimuli that are varied in more than one dimension (1) are empirically less than found in experiments where only one dimension is varied, and (2) sum (across dimensions) to less than the multidimension It (e.g., Pollack, 1953a; Pollack & Ficks, 1954; Beebe-Center et al., 1955; Eriksen & Hake, 1955b; Garner & Creelman, 1964; Lockhead, 1966; Egeth & Pachella, 1969; Fulgosi, Bacun, & Zaja, 1975). The connection to identification is that “Our high level of performance in identifying human faces, speech sounds, and other familiar stimuli is probably attributable to the fact that such objects differ from one another on a very large number of observational dimensions” (Attneave, 1959, p. 76). A stimulus identified by multiple characteristics is more likely to be correctly categorized by comparison to stored archetypes involving multiple features than will a stimulus identified by one feature within a set of archetypes that vary just in that one feature. There is yet another phenomenon of absolute judgment experiments that favors a memory interpretation of those judgments. Note that in psychophysics generally, one stimulus can impede some psychological aspect of another stimulus. When simple detection or discrimination tests are done, for example, the interference is called masking, and the relevant stimuli are called the masker stimulus and the masked stimulus. Those stimuli need not be simultaneous; perceptual masking can occur when the masker precedes the masked stimulus (forward masking) and even when the order is reversed (backward masking). Remarkably, masking also happens in absolute judgments. The masker accompanies each stimulus to be judged, and the masking shows as a significant drop in It. Ward (1991) found backward masking of absolute judgments of tone intensity (loudness) for tones that were followed by a broadband noise (a hiss). Mori and Ward (1992) demonstrated simultaneous, forward, and backward masking of absolute judgments of tone intensity (loudness) for tones masked by broadband noise. The physiological loci of forward and simultaneous masking are still debated. However, backward masking is thought to occur physiologically centrally, involving memory, rather than peripherally (see Nizami, Reimer, & Jesteadt, 2002). Thus apparently the processes responsible for It in absolute judgments are more likely to be central, like memory, rather than peripheral. The effect of masking can be treated as a form of the contrast seen with lifted weights (see above), as follows. In the Shannon general communication system, the equivalent to judging only the test tones is to only receive the symbols comprising the sent message, even if a fixed symbol (corresponding to the forward or backward masking noise) is inserted between each transmitted symbol. Thus, if the human being is a Shannon system, It should not have changed with the introduction of the forward or backward noise masker. But It did indeed change, so we may speculate that the sensation of the
34
Lance Nizami
noise masker used in each session was retained in memory and used as a reference standard in identifying the tones. Finally, sensory memory is generally independent of stimulus duration. Thus, if It from absolute judgments is memory-dependent, then it too should be independent of stimulus duration, insofar as the stimulus is made long enough to not affect its perceivability. When the latter condition is indeed met, independence of It from duration is confirmed (e.g., Garner & Creelman, 1964; Garner et al., 1966; Egeth & Pachella, 1969; Ward, 1991). In comparison, when a visual stimulus is not easily perceived due to insufficient contrast, then the duration, contrast, and range of the employed stimulus trade off, such that increasing each such characteristic tends to improve It (Garner et al., 1966). So, What Is the Channel/Memory Capacity? In the literature on absolute judgments, the empirical values of information transmitted It were always found to be less than their possible maxima, the values of the stimulus information IS . The explanation proffered was always some version of the following: “In the process of transforming physical energy into physiological energy and judgments, a significant amount of information is lost” (Fulgosi et al., 1986, p. 380). In short, the human being was treated as what engineers term a “lossy transmission line.” However, the present paper has summarized a great deal of empirical evidence for an alternative interpretation: that It is determined by memory capacity, not by channel capacity. Tables 1, 2, and 3 show that It appears to have a minimum around 2 bits/stimulus, corresponding to 4 perfectly identifiable categories. Those 4 categories correspond to contemporary assessments of memory capacity (e.g., Cowan, 2000). Thus, channel capacity equals memory capacity. But tables 1, 2, and 3 also show that information transmitted can greatly exceed 2 bits/stimulus, such that channel capacity would greatly exceed memory capacity. The improvement in It seems largely due to practice, as reviewed above. Practice consolidates a task in memory; hence, improvement in channel capacity depends upon improvement in memory. How can memory improve while memory capacity remains constant? A solution, to which no contrary evidence has yet arisen, came from a remarkable memory experiment done by Ericsson, Chase, and Faloon (1980), in which the single experimental subject was able to increase his memory capacity for random digits from 7 digits to 80 digits over the course of 20 months. The subject achieved the 80-digit capacity by dividing the stream of digits into 7 supergroups of three groups of 3 or 4 digits per group, plus a final group of 5 digits. The subject’s behavior gave no reason to believe that their capacity of immediate memory had ever exceeded 4 ± 1 digits; the storage of digits in groups was attributed to long-term memory. Improvements in It with practice likely represent a similar phenomenon, by which It and channel capacity can continue to improve while memory capacity remains constant. Recall that in the plot of empirical It versus number of categories (figure 7), the peak of the It curve
Channel Capacity or Memory Capacity?
35
represents the real channel capacity; that peak shifts to the right when channel capacity increases. The idea that psychological channel capacity reflects memory capacity will be a surprise to some experimental psychologists. Consider a brief review by Shiffrin and Nosofsky (1994) in the influential journal Psychological Review. Comparing channel capacity to memory capacity, Shiffrin and Nosofsky sardonically concluded that “the relation between these two limitations remains somewhat less tight than some might view as desirable, chiefly consisting of the fact that both involve numbers less than ten” (Shiffrin & Nosofsky, p. 360). Shiffrin and Nosofsky did acknowledge (much more briefly than done here) some of the idiosyncracies of absolute judgments, such as range effects, practice effects, end-anchoring, and sequential dependences. They especially dwelled upon the greater It found for multidimension versus unidimension stimuli. But Shiffrin and Nosofsky discuss little of how these phenomena might relate to memory, while pointing out that there are aspects of memory performance that do not seem to easily connect to aspects of absolute judgments. In light of all of the evidence summarized herein, Shiffrin and Nosofsky’s conclusion of no connection seems extraordinary. Summary Over 60 years ago, Dr. Claude Shannon produced a groundbreaking paper on the computation of the information transmitted by a general communication system. That now-famous method was adopted, with some reinterpretations, by the experimental psychologists Garner and Hake as a way of analyzing absolute judgments (Garner & Hake, 1951). The Garner-Hake approach is still employed. In it, a human subject is typically presented with a set of stimuli varying in one or more dimensions within a single sense (vision, hearing, taste, smell, touch, or kinesthesis). The stimuli are assigned categories by the experimenter. Each stimulus is then presented to the subject multiple times in randomized order, one stimulus at a time, and the subject must identify it by category. A Shannon-style confusion matrix is formed, its columns representing the given stimuli and its rows representing the identification categories, all labeled in the order of the varied stimulus characteristic. The matrix entries are the proportion of times that the experimental subject identifies a given stimulus as being in a given category. The confusion matrix allows computation of Shannon’s information transmitted measure, It ; subjects’ performances are also scored as the percentages of correct assignments of stimulus to category (correct identifications). It allegedly reaches an eventual maximum, the channel capacity, as the number of stimuli increases, reflecting a maximum number of stimuli that can be consistently identified correctly. The present author examined the behavior of It by critically reviewing 60 years of absolute judgment literature. Empirically, percentage correct identifications and It both grow when subjects are given judgment-by-judgment feedback as to judgment correctness. (Feedback is a concept embraced in cybernetics, but it is not a feature of the Shannon general communication system.) Stimulus
36
Lance Nizami
identification improves with greater subject training and motivation, and with greater range and spacing of the stimuli. Anchor effects are found in which a stimulus, or even a response, affects the identification of a later stimulus. Masking is found, in which identification can be affected by noise that appears before, or even after, the stimulus to be judged. (Non-simultaneous noise is not a feature of Shannon’s general communication system.) Further, intensive training can increase performance far beyond the typical average of 4, or at best 7, consistently correctly identified stimuli; no actual channel capacity is evident. All of these behaviors are incompatible with the operation of the Shannon general communication system. They can, however, be explained if the absolute judgment experiment is viewed as a test of human memory. Memory capacity has been quantified for decades in other psychology experiments. Those studies suggest that without special training only 7 stimuli, and perhaps really just 4, can be consistently correctly identified—precisely the numbers that are typically found in absolute judgment experiments under basic familiarization. Discussion Continuing Use of the Garner-Hake Method of Analysis of Absolute Judgments Given the gradual accumulation of a great mass of solid evidence against a channelcapacity interpretation of Garner-Hake information-transmission computations, it might be thought that the Garner-Hake approach would be abandoned. Not so. The channel-capacity interpretation of sensation is still very much alive. For example, on the theory side, Wong and Norwich (1997), Norwich, Wong and Sagi (1998), Sagi, Wong, and Norwich (2001), and Sagi and Norwich (2002) all accept the Garner-Hake use of Shannon information at face value. Norwich et al. (1998), Sagi et al. (2001), and Sagi and Norwich (2002) reiterated the old belief that transmitted information It reaches an asymptotic plateau, and Sagi et al. (2001) went even further, seeking to justify the belief in an informational plateau by using theory and simulations. Then there are the experiments. Since the early 1970’s, for example, Lawrence Ward and his co-authors have turned out no fewer than 10 peer-reviewed journal papers regarding information transmission in absolute judgments, of which four are presently cited. That is not the behavior of investigators who realize the connection of channel capacity to memory capacity, because absolute judgments themselves are hardly needed to quantify memory. Granted, there is a relatively recent, lively, and ongoing debate about how absolute judgments are actually made, and therefore what mental resources they rely upon (for an example, see Brown, Marley, Dodds, and Heathcote, 2009). But, the relevant papers often contain elaborate conceptual models, sometimes accompanied by equally elaborate mathematical models and computer routines, all of which are not likely to be transparent to a general audience, and that are well beyond the scope of the present review.
Channel Capacity or Memory Capacity?
37
Ongoing Theory Attempts to Legitimize the Garner-Hake Interpretation of Shannon Information Theory Garner and Hake (1951) proposed an intimate connection of Shannon information theory to sensation. However, Garner and Hake were experimentalists, not mathematicians, and their ideas found greatest acceptance among other experimentalists. Therefore, the present paper concentrated on the use of the GarnerHake approach by experimentalists. Doubtless, the experimentalists would benefit nonetheless from any greater theory of perception that justified the Garner-Hake interpretation of Shannon information theory. In fact, an a posteriori justification for the Garner-Hake approach has been presented in a long-lived stream of ongoing theory papers entitled “The Entropy Theory of Perception,” produced by K. H. Norwich and co-authors (with some independent contributions being made by Norwich’s former students and associates, e.g., Mori, 1993; Schulze & Mori, 1993; Wong & Figuieredo, 2002; Wong 2005, 2007). Norwich et al.’s entropy theory actually derives from 1958 (noted in Norwich, 1993), just ten years after Shannon’s seminal paper, but the entropy theory first appeared in print in 1975 (Norwich, 1975). The theory prescribes perceptual response using “a mathematical function similar to Shannon’s informational entropy function” (Norwich, 2005, p. 176). The mathematical function in question ultimately depends upon the Garner-Hake interpretation of Shannon information theory (Norwich 1987, 1991a, 1991b, 1991c, 2001, 2005; Norwich & Wong, 1997). The entropy theory was based on several notions, namely, that (1) “multiple, parallel receptor-neuron units” (Norwich, 1981, p. 414) without collaterals “carry essentially the same message to the brain,”(p. 414); (2) sensation is proportional to the firing rate of the neuron abutting the sensory receptor; (3) neuronal firing rate is proportional to the sensory receptor’s resolvable uncertainty; and (4) the resolvable uncertainty is computed from Shannon information theory. The uncertainty, which Norwich called H (which he identified with ES of text equation 3), allegedly depends upon microscopic thermodynamic fluctuations of the stimulus. H decreases with time through repeated and regular sampling of the stimulus by the sensory receptor. That is, exposing the single sensory receptor with its single primary afferent (Norwich, 1981) to a constant stimulus causes firing-rate adaptation, in which a sensory neuron’s firing rate hypothetically drops smoothly and monotonically from an initial maximum to a steady minimum. Thus, “If a given stimulus is left in place for a prolonged period, uncertainty, H, and hence impulse frequency, F, decrease progressively. The informational explanation for the phenomenon of sensory adaptation is, therefore, a progressive increase in the certainty of the sensory receptor [i.e., a decrease in entropy] about the magnitude of its stimulus” (Norwich & McConville, 1991, p. 152). Norwich joined neuronal adaptation to adaptation of sensation by noting that the physiological adaptation curve has the same general shape as the psychophysical adaptation curve, that is, the drop in sensation with time for a constant stimulus (Norwich, 1981). One adaptation phenomenon was assumed to mirror the other. Altogether, in the entropy theory,
38
Lance Nizami
neuronal entropy and psychophysical (sensation) entropy both hypothetically decrease over time, and at the same rate. The entropy theory was promoted in roughly 40 abstracts, proceedings, and peerreviewed papers, the most recent being Norwich (2010). However, one paper has long been recognized as key, Norwich’s “Perception & Psychophysics” paper of 1981. That paper drew the scrutiny of an expert on Garner-Hake computation, Dr. A. W. MacRae. After a thorough examination of the paper, MacRae concluded that the entropy theory was “nonsensical, having no clear meaning” (MacRae, 1982, p. 593). Nevertheless, additions to the entropy theory continued to appear in print, and in 1993 Norwich published a book that summarized most of the entropy theory work up to that time (with the unexplained exception of a paper by Norwich in 1984). The book was reviewed by a Cambridge mathematician, Donald Laming, who concluded that “It does not transpose into any coherent theory of perception” (Laming, 1994, p. 1494). Another review, by the established experimental psychologist F. Gregory Ashby, concluded that “Many current psychophysicists and cognitive scientists will find their views to be incompatible with the basic tenets of Norwich’s book” (Ashby, 1995, p. 613). Surprisingly, crucial assumptions underlying the entropy theory were not put to experimental test until 1991. Then, L. M. Ward compared the drop in H for absolute judgments over time to the adaptation with time of neuronal firing rate (Ward, 1991). According to the entropy theory, these follow the same time course. For Ward’s stimuli, time was manifested as a variable through different stimulus durations, as modeled in the entropy theory (Norwich, 1981). That is, absolute judgments of stimuli of different durations were used to yield H as a function of time. For primary afferent firing rate vs. time, empirical plots were available from the literature. The behavior of H with stimulus duration was examined separately for light and sound. For either, psychophysical H adapted much faster than neuronal firing rate, and further, the respective lags were not constant. Thus the Norwich et al. requirement of synchronicity of firing rate and absolute judgment entropy was disconfirmed. The omission of the material of Norwich (1984) from his book of 1993 allowed Laming (1994) to miss an egregious mathematical error that had been committed in Norwich (1984), namely, that Norwich’s very first equation was demonstrably incorrect, rendering the rest of the paper superfluous (Nizami, 2009a). Other recent analyses have demonstrated that the entropy theory fails to provide a consistent interpretation of the Shannon general communication system (Nizami, 2008a), and that it fails to fulfill a requirement of any model said to be based solely upon information theory, that is, avoidance of the use of mechanisms (Nizami, 2008b; recall that Shannon information is a mechanism-independent statistic). The entropy theory allegedly produces the Weber fraction for audition (McConville, Norwich & Abel, 1991), but that derivation actually contains indisputable mathematical and conceptual errors (see Nizami, 2008c); a later, somewhat different entropy theory derivation of the same quantity depended crucially on a broad assumption that has proven, upon testing, to be unjustified (Nizami, 2009b). Further, throughout the entirety of the
Channel Capacity or Memory Capacity?
39
entropy theory’s publication history, Norwich et al. claimed that the theory simultaneously derived two well-known laws of sensation, Stevens’ power law and the Weber-Fechner law. Remarkably, Norwich et al. never tested those claims against data. The latter test was recently done by the present author, and the entropy theory claims proved false (Nizami, 2009c). Also, a derivation of equal-loudness contours within the entropy theory (Wong & Norwich, 1995) is actually based on inappropriate limits and provably false assumptions (Nizami, 2009d). Finally, it transpires that the entropy theory’s concept of sensory adaptation as information transmission has a hidden drawback that makes it unsuitable for the majority of the published data (Nizami, 2009e), regardless of any root concerns about the theory’s derivations. In short, several workers with mathematical backgrounds have demonstrated over the years that the entropy theory contains intractable problems. In fairness it should be noted that the entropy theory was preceded by an attempt by J. C. Baird to connect Garner-Hake information computation to empirical laws governing the growth of sensation with growth of stimulus intensity, and the discriminable steps in that growth (Baird, 1970a, 1970b). Unfortunately, Baird’s efforts contained fatal flaws in reasoning (MacRae, 1972). The separate failures of Baird and of Norwich et al. are altogether highly illuminating. That is, those theories were clearly intended to provide the ultimate generalization of the Garner-Hake interpretation, but they inadvertently did the opposite: they showed, should any further demonstration be needed, that applying Shannon information theory to absolute judgments has nothing whatsoever to do with actual information transmission through communication channels. Conclusions and Recommendations For 60 years, psychologists have processed the results of absolute judgment measurements using the Garner-Hake interpretation of Shannon’s information theory, on the unsubstantiated assumption that humans are communication channels and that performance on absolute judgments reflects the operation of such channels. Examination of a substantial portion of the relevant literature reveals a great deal of evidence that absolute judgments are limited by memory, rather than the capacity of a Shannon general communication channel. The information transmission analyses reveal not the channel capacity but rather the memory capacity of human subjects. The memory capacity had already been confirmed many times over using methods other than information-theoretic analyses of absolute judgments. Thus, the latter procedure is redundant and needs to be abandoned in the absence of any other developed use in psychology. Indeed, its use has distracted psychologists from other potential interpretations of cognitive abilities. Why was “information” adopted and retained by experimental psychologists? Perhaps, as Collins mused, because
40
Lance Nizami
Information was reassuringly grounded in material entities—the telephone wire, the computer, and the neuron—that spanned the human-made and the natural. Information did not respect apparent barriers such as the skin or the skull, and it was a concept readily applied to events inside and outside the person. (Collins, 2007, p. 58)
Psychologists continue to speak of channel capacity, but it has slowly become apparent that “Information was required to address a diversity of psychological issues that its narrower definition could not sustain” (Collins, 2007, p. 47). In some quarters, realization dawned early; in an editorial entitled “The Bandwagon,” Claude Shannon himself noted the usefulness of information theory to engineering, but warned that “Workers in other fields should realize that the basic results of the subject are aimed in a very specific direction, a direction that is not necessarily relevant to such fields as psychology, economics, and other social sciences” (Shannon, 1956, p. 3). On the same page Shannon complained that “the subject of information theory has certainly been sold, if not oversold.” In 1998, the same journal, IEEE Transactions on Information Theory, produced an issue devoted entirely to summarizing information theory’s applications and accomplishments on the 50th Anniversary of Shannon’s breakthrough. Not one paper concerned the social sciences. The introductory editorial briefly acknowledged that information theory had found early applications in psychology, but concluded that “Information Theory eventually failed to become the ‘theory of everything’ that a few had envisioned” (Verdu, 1998, p. 2042). Indeed, as Rosen had noted: It is well known that “information” is one of the murkiest and most overworked words in the scientific lexicon (perhaps only the word “model” can be compared to it). Indeed, there is almost no relation between the “information” of the Information Theory of Shannon (which beguiles many through its superficial relation to [thermodynamic] entropy), the “genetic information” upon which development, physiology and evolution devolve in their several ways, and the “information” appearing diversely in the functioning of the brain. (Rosen, 1985, p. 34)
Acknowledgments This paper was prepared from a talk given at the 2009 Annual Meeting of the American Society for Cybernetics. I am indebted to Professors Ranulph Glanville and Arun Chandra for allowing me to participate. Professor Claire S. Barnes (Emory University) rendered invaluable assistance in the researching and editing of the paper. Finally, Associate Editor Dr. Jeanette Bopry, CHK, and the two anonymous reviewers did much to further improve the manuscript. References Agnew, N. McK., Pyke, S., & Pylyshyn, Z. W. (1966). Absolute judgment of distance as a function of induced muscle tension, exposure time, and feedback. Journal of Experimental Psychology, 71, 649-654. Aiken, E. G., Abrams, A. J., & Shennum, W. A. (1973). Memory processes in the method of absolute judgment: A robust effect. Perceptual & Motor Skills, 36, 338. Alluisi, E. A. (1957). Conditions affecting the amount of information in absolute judgments. Psychological Review, 64, 97-103.
Channel Capacity or Memory Capacity?
41
Andrew, A. M. (1984). Information transmission in nerves. In R. Trappl (Ed.), Cybernetics and system research 2 (pp. 257-260). Amsterdam: Elsevier. Ashby, F. G. (1995). Resurrecting information theory: Information, sensation, and perception by Kenneth H. Norwich. American Journal of Psychology, 108, 609-614. Attneave, F. (1959). Applications of information theory to psychology. Toronto: Holt, Rinehart and Winston. Baird, J. C. (1970a). A cognitive theory of psychophysics. I. Information transmission, partitioning, and Weber’s Law. Scandinavian Journal of Psychology, 11, 35-46. Baird, J. C. (1970b). A cognitive theory of psychophysics. II. Fechner’s Law and Stevens’ Law. Scandinavian Journal of Psychology, 11, 89-102. Bechinger, D., Kongehl, G., & Kornhuber, H. H. (1969). Dependence of human sensory information transmission on distribution of stimuli. Naturwissenschaften, 56, 419. Beebe-Center, J. G., Rogers, M. S., & O’Connell, D. N. (1955). Transmission of information about sucrose and saline solutions through the sense of taste. Journal of Psychology, 39, 157-160. Bevan, W., & Avant, L. L. (1968). Response latency, response uncertainty, information transmitted and the number of available judgmental categories. Journal of Experimental Psychology, 76, 394-397. Blamey, P. J., & Clark, G. M. (1987). Psychophysical studies relevant to the design of a digital electrotactile speech processor. Journal of the Acoustical Society of America, 82, 116-125. Broadbent, D. E. (1975). The magic number seven after fifteen years. In A. Kennedy & A. Wilkes (Eds.), Studies in long-term memory (pp. 3-18). New York: Wiley. Brown, G. D. A., McCormack, T., Smith, M., & Stewart, N. (2005). Identification and bisection of temporal durations and tone frequencies: common models for temporal and nontemporal stimuli. Journal of Experimental Psychology: Human Perception & Performance, 31, 919-938. Brown, S. D., Marley, A. A. J., Dodds, P., & Heathcote, A. (2009). Purely relative models cannot provide a general account of absolute identification. Psychonomic Bulletin & Review, 16, 583-593. Campbell, D. T., Lewis, N. A., & Hunt, W. A. (1958). Context effects with judgmental language that is absolute, extensive, and extra-experimentally anchored. Journal of Experimental Psychology, 55, 220-228. Chapanis, A., & Halsey, R. M. (1956). Absolute judgments of spectrum colors. Journal of Psychology, 42, 99-103. Chapanis, A., & Overbey, C. M. (1971). Absolute judgments of colors using natural color names. Perception & Psychophysics, 9, 356-360. Collins, A. (2007). From H=log sn to conceptual framework: a short history of information. History of Psychology, 10, 44-72. Costall, A., Platt, S., & MacRae, A. (1981). Memory strategies in absolute identification of “circular” pitch. Perception & Psychophysics, 29, 589-593. Cowan, N. (2000). The magical number 4 in short-term memory: reconsideration of mental storage capacity. Behavioral & Brain Sciences, 24, 87-185. Cronbach, L. J. (1955). On the non-rational application of information measures in psychology. In H. Quastler (Ed.), Information theory in psychology (pp. 14-30). Glencoe, IL: The Free Press. Cuddy, L. L. (1968). Practice effects in the absolute judgment of pitch. Journal of the Acoustical Society of America, 43, 1069-1076. DiLollo, V. (1964). Contrast effects in the judgment of lifted weights. Journal of Experimental Psychology, 68, 383387. Egeth, H., & Pachella, R. (1969). Multidimensional stimulus identification. Perception & Psychophysics, 5, 341-346. Elvevag, B., Brown, G. D. A., McCormack, T., Vousden, J. I., & Goldberg, T. E. (2004). Identification of tone duration, line length, and letter position: an experimental approach to timing and working memory deficits in schizophrenia. Journal of Abnormal Psychology, 113, 509-521. Engen, T., & Pfaffmann, C. (1959). Absolute judgments of odor intensity. Journal of Experimental Psychology, 58, 2326. Engen, T., & Pfaffmann, C. (1960). Absolute judgments of odor quality. Journal of Experimental Psychology, 59, 214219. Ericsson, K. A., Chase, W. G., & Faloon, S. (1980). Acquisition of a memory skill. Science, 208, 1181-1182. Eriksen, C. W., & Hake, H. W. (1955a). Absolute judgments as a function of stimulus range and number of stimulus and response categories. Journal of Experimental Psychology, 49, 323-332. Eriksen, C. W., & Hake, H. W. (1955b). Multidimensional stimulus differences and accuracy of discrimination. Journal of Experimental Psychology, 50, 153-160. Eriksen, C. W., & Wechsler, H. (1955). Some effects of experimentally induced anxiety upon discrimination behavior. Journal of Abnormal and Social Psychology, 51, 458-463. Feallock, J. B., Southard, J. F., Kobayashi, M., & Howell, W. C. (1966). Absolute judgment of colors in the Federal Standards System. Journal of Applied Psychology, 50, 266-272. Friedman, H. (1967). Absolute judgment of more than 32 categories (5 bits) with a unidimensional visual stimulus. Psychonomic Science, 8, 225-226. Fulgosi, A., Bacun, D., & Zaja, B. (1975). Absolute identification of two-dimensional tones. Bulletin of the Psychonomic Society, 6, 484-486. Fulgosi, A., & Bartolovic, B. (1971). Practice and some methodological problems in unidimensional information transmission. Perception & Psychophysics, 10, 283-285.
42
Lance Nizami
Fulgosi, A., Bezinovic, P., Mimica, I., & Taksic, V. (1987). Channel capacity in the magnitude estimation of weight. Perception & Psychophysics, 42, 328-332. Fulgosi, A., Knezovic, Z., & Zarevski, P. (1984). Individual differences, type of identification response, and practice in absolute identification of pitch. Bulletin of the Psychonomic Society, 22, 205-207. Fulgosi, A., Lugomer, G., & Fulgosi, L. (1986). An informational analysis of some comparative psychophysical judgments of apparent sizes. Bulletin of the Psychonomic Society, 24, 379-380. Fulgosi, A., & Zaja, B. (1975). Information transmission of 3.1 bits in absolute identification of auditory pitch. Bulletin of the Psychonomic Society, 6, 379-380. Fullard, W., Snelbecker, G. E., & Wolk, S. (1972). Absolute judgments as a function of stimulus uncertainty and temporal effects: Methodological note. Perceptual & Motor Skills, 34, 379-382. Garner, W. R. (1952). An equal discriminability scale for loudness judgments. Journal of Experimental Psychology, 43, 232-238. Garner, W. R. (1953). An informational analysis of absolute judgments of loudness. Journal of Experimental Psychology, 46, 373-380. Garner, W. R., & Creelman, C. D. (1964). Effect of redundancy and duration on absolute judgments of visual stimuli. Journal of Experimental Psychology, 67, 168-172. Garner, W. R., & Hake, H. W. (1951). The amount of information in absolute judgements. Psychological Review, 58, 445-459. Garner, W. R., Kaplan, G., & Creelman, C. D. (1966). Effect of stimulus range, duration, and contrast on absolute judgments of visual size. Perceptual & Motor Skills, 22, 635-644. Gibson, E. J. (1953). Improvement in perceptual judgments as a function of controlled practice or training. Psychological Bulletin, 50, 401-431. Guilford, J. P., & Dallenbach, K. M. (1925). The determination of memory span by the method of constant stimuli. American Journal of Psychology, 36, 621-628. Hanes, R. M., & Rhoades, M. V. (1959). Color identification as a function of extended practice. Journal of the Optical Society of America, 49, 1060-1064. Hartman, E. B. (1954). The influence of practice and pitch-distance between tones on the absolute identification of pitch. American Journal of Psychology, 67, 1-14. Hawkes, G. R., & Warm, J. S. (1960). Maximum It for absolute identification of cutaneous electrical intensity level. Journal of Psychology, 49, 279-288. Heintz, R. K. (1950). The effect of remote anchoring points upon the judgment of lifted weights. Journal of Experimental Psychology, 40, 584-591. Heller, M. A., & Auerbach, C. (1972). Practice effects in the absolute judgment of frequency. Psychonomic Science, 26, 222-224. Hettinger, T. P., Gent, J. F., Marks, L. E., & Frank, M. E. (1999). A confusion matrix for the study of taste perception. Perception & Psychophysics, 61, 1510-1521. Hick, W. E. (1952). On the rate of gain of information. Quarterly Journal of Experimental Psychology, 4, 11-26. Holland, M. K., & Lockhead, G. R. (1968). Sequential effects in absolute judgments of loudness. Perception & Psychophysics, 3, 409-414. Keene, G. C. (1963). The effect of response codes on the accuracy of making absolute judgments of lineal inclinations. Journal of General Psychology, 69, 37-50. Kintz, R. T., Parker, J. A., & Boynton, R. M. (1969). Information transmission in spectral color naming. Perception & Psychophysics, 5, 241-245. Klemmer, E. T., & Frick, F. C. (1953). Assimilation of information from dot and matrix patterns. Journal of Experimental Psychology, 45, 15-19. Lacouture, Y., & Lacerte, D. (1997). Stimulus modality and stimulus-response compatibility in absolute identification. Canadian Journal of Experimental Psychology, 51, 165-170. Laming, D. R. J. (1968). Information theory of choice-reaction times. New York: Academic Press. Laming, D. R. J. (1994). Review: Information, Sensation, and Perception by K. H. Norwich. Perception, 23, 14911494. Landau, S. G., Buchsbaum, M. S., Coppola, R., & Sihvonen, M. (1974). Individual differences and reliability of information transmission in absolute judgments of loudness, brightness and line lengths. Perceptual & Motor Skills, 39, 239-246. Locke, S. A. (1974).Temporal discrimination of brief auditory stimuli by schizophrenics, neurologically impaired, and normals. Perceptual & Motor Skills, 39, 1111-1120. Locke, S. A. (1975). Effect of a mid-series anchor on absolute judgments of duration by schizophrenics, neurologically impaired, and normals. Perceptual & Motor Skills, 40, 671-677. Lockhead, G. R. (1966). Effects of dimensional redundancy on visual discrimination. Journal of Experimental Psychology, 72, 95-104. Luce, R. D. (2003). Whatever happened to information theory in psychology? Review of General Psychology, 7, 183188. Luce, R. D., Nosofsky, R. M., Green, D. M., & Smith, A. F. (1982). The bow and sequential effects in absolute identification. Perception & Psychophysics, 32, 397-408. MacKay, D. M., & McCulloch, W. S. (1952). The limiting informational capacity of a neuronal link. Bulletin of Mathematical Biophysics, 14, 127-135.
Channel Capacity or Memory Capacity?
43
MacRae, A. W. (1970a). Channel capacity in absolute judgment tasks: An artifact of information bias? Psychological Bulletin, 73, 112-121. MacRae, A. W. (1970b). Information measures in perceptual experiments: Some pitfalls encountered by Kintz, Parker & Boynton. Perception & Psychophysics, 7, 221-222. MacRae, A. W. (1972). Information transmission, partitioning and Weber’s law: Some comments on Baird’s cognitive theory of psychophysics. Scandinavian Journal of Psychology, 13, 73-80. MacRae, A. W. (1982). The magical number fourteen: making a very great deal of none-sense. Perception & Psychophysics, 31, 591-593. Marteniuk, R. G. (1971). An informational analysis of active kinesthesis as measured by amplitude of movement. Journal of Motor Behavior, 3, 69-77. McConville, K. M. V., Norwich, K. H., & Abel, S. M. (1991). Application of the entropy theory of perception to auditory intensity discrimination. International Journal of Biomedical Computing, 27, 157-173. McKenna, F. P. (1984). Assimilation and contrast in perceptual judgments. Quarterly Journal of Experimental Psychology, 36(A), 531-548. McNicol, D. (1975). Feedback as a source of information and as a source of noise in absolute judgments of loudness. Journal of Experimental Psychology: Human Perception and Performance, 104, 175-182. Miller, C.-A., & Engen, T. (1960). Context effects on absolute judgments of length. Journal of Experimental Psychology, 59, 276-277. Miller, G. A. (1956a). The magical number seven, plus or minus two: some limits on our capacity for processing information. Psychological Review, 63, 81-97. Miller, G. A. (1956b). Human memory and the storage of information. Institute of Radio Engineers Transactions on Information Theory, IT-2, 129-137. Mori, S. (1993). Toward a unified theory of psychophysics: Norwich’s entropy theory of perception. Japanese Psychological Review, 36, 244-264. Mori, S., & Ward, L. M. (1992). Intensity and frequency resolution: masking of absolute identification and fixed and roving discrimination. Journal of the Acoustical Society of America, 91, 246-255. Mori, S., & Ward, L. M. (1995). Pure feedback effects in absolute identification. Perception & Psychophysics, 57, 1065-1079. Neath, I., Brown, G. D. A., McCormack, T., Chater, N., & Freeman, R. (2006). Distinctiveness models of memory and absolute identification: evidence for local, not global, effects. Quarterly Journal of Experimental Psychology, 59, 121-135. Nizami, L. (2008a). Is the computation of Shannon entropy justified in Norwich’s Entropy Theory of Perception (1975-present)? Presented as a poster at the 41st Annual Meeting of the Society for Mathematical Psychology, Washington, D.C., July 26-29, 2008. Nizami, L. (2008b). Does Norwich’s Entropy Theory of Perception avoid the use of mechanisms, as required of an information-theoretic model of auditory primary-afferent firing? Proceedings of the 155th Meeting of the Acoustical Society of America, the 5th Forum Acusticum of the EA, the 9e Congres Francais d’Acoustique of the SFA, and the 2nd ASA-EAA Joint Conference, Paris, pp. 5745-5750. Nizami, L. (2008c). Is auditory intensity discrimination a comparison of entropy changes? Proceedings of the 155th Meeting of the Acoustical Society of America, the 5th Forum Acusticum of the EA, the 9e Congres Francais d’Acoustique of the SFA, and the 2nd ASA-EAA Joint Conference, Paris, pp. 5739-5744. Nizami, L. (2009a). On the misapplication of cybernetics to sensory neurons: Norwich’s informational Entropy Theory of Perception has not derived Stevens’ Law for taste. Proceedings of the World Congress on Engineering 2009, London (Lecture Notes in Engineering and Computer Science), International Association of Engineers, pp. 1075-1079. Nizami, L. (2009b). On the hazards of deriving sensory laws from first-order cybernetics: Norwich’s Entropy Theory of Perception does not derive the Weber fraction for audition. Proceedings of the 13th World Multi-Conference on Systemics, Cybernetics and Informatics (WMSCI 2009): Vol. 2. International Institute of Informatics and Systemics, pp. 235-241. Nizami, L. (2009c). A computational test of the information-theory based Entropy Theory of Perception: does it actually generate the Stevens and Weber-Fechner Laws of Sensation? Proceedings of the World Congress on Engineering 2009, London (Lecture Notes in Engineering and Computer Science), International Association of Engineers, pp. 1853-1858. Nizami, L. (2009d). Norwich’s Entropy Theory of Perception does not derive equal-loudness contours a heuristic on inappropriate limits and unexamined assumptions in mathematical biology. World Academy of Science, Engineering, and Technology, Proceedings Vol. 55 (International Conference on Mathematical Biology), pp. 694699. Nizami, L. (2009e). A lesson in the limitations of applying cybernetics to sensory systems: hidden drawbacks in Norwich’s model of transmitted Shannon information. Proceedings of the 21st International Conference on Systems Research, Informatics and Cybernetics and the 29th Annual Meeting of the International Institute for Advanced Studies in Systems Research and Cybernetics, Baden-Baden. Nizami, L., Reimer, J. F., & Jesteadt, W. (2002). The mid-level hump at 2 kHz. Journal of the Acoustical Society of America, 112, 642-653. Norwich, K. H. (1975). Information, memory, and perception. Institute of Biomedical Engineering, University of Toronto, Vol. 17.
44
Lance Nizami
Norwich, K. H. (1981). The magical number seven: Making a “bit” of “sense.” Perception & Psychophysics, 29, 409-422. Norwich, K. H. (1984). The psychophysics of taste from the entropy of the stimulus. Perception & Psychophysics, 35, 269-278. Norwich, K. H. (1987). On the theory of Weber fractions. Perception & Psychophysics, 42, 286-298. Norwich, K. H. (1991a). Toward the unification of the laws of sensation: Some food for thought. In H. T. Lawless & B. P. Klein (Eds.), Sensory science theory and applications in foods (pp. 151-183). New York: Marcel Dekker Inc. Norwich, K. H. (1991b). On the fundamental nature of perception. Acta Biotheoretica, 39, 81-90. Norwich, K. H. (1991c). The psychophysical response is equal to the potential stimulus information. Proceedings of the 7th Annual Meeting of the International Society for Psychophysics, International Society for Psychophysics, pp. 15-19. Norwich, K. H. (1993). Information, sensation, and perception. San Diego: Academic Press. Norwich, K. H. (2001). Determination of saltiness from the laws of thermodynamics—estimating the gas constant from psychophysical experiments. Chemical Senses, 26, 1015-1022. Norwich, K. H. (2005). Physical entropy and the senses. Acta Biotheoretica, 53, 167-180. Norwich, K. H. (2010). A mathematical exploration of the mystery of loudness adaptation. Bulletin of Mathematical Biology, 72, 298-313. Norwich, K. H., & McConville, K. M. V. (1991). An informational approach to sensory adaptation. Journal of Comparative Physiology, A168, 151-157. Norwich, K. H., & Wong, W. (1997). Unification of psychophysical phenomena: The complete form of Fechner’s law. Perception & Psychophysics, 59, 929-940. Norwich, K. H., Wong, W., & Sagi, E. (1998). Range as a factor determining the information of loudness judgments: Overcoming small sample bias. Canadian Journal of Experimental Psychology, 52, 63-71. Parducci, A., & Marshall, L. M. (1962). Assimilation vs. contrast in the anchoring of perceptual judgments of weight. Journal of Experimental Psychology, 63, 426-437. Petiot, J. C., & Parrot, J. (1980). Transmission d’information visuelle à très courte durée d’exposition. Effets de contraste signal-fond. Comptes Rendus de la Société de Biologie de Dijon, 174, 1046-1052. Petrov, A. A., & Anderson, J. R. (2005). The dynamics of scaling: a memory-based anchor model of category rating and absolute identification. Psychological Review, 112, 383-416. Pollack, I. (1952). The information of elementary auditory displays. Journal of the Acoustical Society of America, 24, 745-749. Pollack, I. (1953a). The information of elementary auditory displays. II. Journal of the Acoustical Society of America, 25, 765-769. Pollack, I. (1953b). Assimilation of sequentially encoded information. American Journal of Psychology, 66, 421-435. Pollack, I. (1956). Identification and discrimination of components of elementary auditory displays. Journal of the Acoustical Society of America, 28, 906-909. Pollack, I., & Ficks, L. (1954). Information of elementary multidimensional auditory displays. Journal of the Acoustical Society of America, 26, 155-158. Pylyshyn, Z. W., & Agnew, J. N. (1962). Absolute judgment of distance as a function of anxiety and exposure time. Perceptual & Motor Skills, 14, 411-418. Rosen, R. (1985). Information and cause. In S. L. Mintz & A. Perlmutter (Eds.), Information processing in biological systems (pp. 31-54). New York: Plenum Press. Rouder, J. N., Morey, R. D., Cowan, N., & Pfaltz, M. (2004). Learning in a unidimensional absolute identification task. Psychonomic Bulletin & Review, 11, 938-944. Russell, D. G. (1981). Channel capacity for kinesthetic torque information. Perceptual & Motor Skills, 52, 387-390. Russell, D. G., & Marteniuk, R. G. (1974). An informational analysis of absolute judgments of torque. Perception & Psychophysics, 16, 443-448. Sagi, E., & Norwich, K. H. (2002). Weighing the anchor in categorization of sound level. Canadian Acoustics, 30(2), 15-24. Sagi, E., Wong, W., & Norwich, K. H. (2001). Mathematical studies of the information in the stimulus-response matrix. Journal of Mathematical Psychology, 45, 99-114. Salzinger, K. (1957). Shift in judgment of weights as a function of anchoring stimuli and instructions in early schizophrenics and normals. Journal of Abnormal and Social Psychology, 55, 43-49. Schulze, G., & Mori, S. (1993). Increases in environmental entropy demand evolution: a consequence of the Entropic Theory of Perception. Acta Biotheoretica, 41, 149-164. Shannon, C. E. (1956). The bandwagon. IEE Transactions on Information Theory, IT-2, 3. Shannon, C. E. (1974). A mathematical theory of communication. In D. Slepian (Ed.), Key papers in the development of information theory (pp. 5-18). New York: IEEE Press. (Reprint of “A mathematical theory of communication,” Bell System Technical Journal, 27, 379-423, 1948) Sherif, M., Taub, D., & Hovland, C. I. (1958). Assimilation and contrast effects of anchoring stimuli on judgments. Journal of Experimental Psychology, 55, 150-155. Sherrick, C. E. (1985). A scale for rate of tactual vibration. Journal of the Acoustical Society of America, 78, 78-83. Shiffrin, R. M., & Nosofsky, R. M. (1994). Seven plus or minus two: a commentary on capacity limitations. Psychological Review, 101, 357-361.
Channel Capacity or Memory Capacity?
45
Siegel, W. (1972). Memory effects in the method of absolute judgment. Journal of Experimental Psychology, 94, 121131. Slak, S. (1974). Memory span as a function of amount of information. Perceptual & Motor Skills, 39, 619-622. Snelbecker, G. E., & Fullard, W. (1972). The influence of feedback and stimulus characteristics on absolute judgments of auditory stimuli. Journal of General Psychology, 87, 245-250. Spitz, H. H. (1967). Information transmission in an absolute judgment task with feedback, using normal and retarded subjects. Journal of Comparative and Physiological Psychology, 64, 85-92. Steedman, W. C. (1967). Absolute judgments of size in a restricted visual environment. Perceptual & Motor Skills, 24, 731-736. Takeuchi, A. H., & Hulse, S. H. (1993). Absolute pitch. Psychological Bulletin, 113, 345-361. Terman, M. (1965). Improvement of absolute pitch naming. Psychonomic Science, 3, 243-244. Tresselt, M. E. (1947). The influence of amount of practice upon the formation of a scale of judgment. Journal of Experimental Psychology, 37, 251-260. Tulving, E., & Lindsay, P. H. (1967). Identification of simultaneously presented simple visual and auditory stimuli. Acta Psychologica, 27, 101-109. Verdu, S. (1998). Guest editorial. IEEE Transactions on Information Theory, 44, 2042-2043. Vianello, M. A. B., & Evans, S. H. (1968). Note on pitch discrimination learning. Perceptual & Motor Skills, 26, 576. Volkmann, F. C., & Engen, T. (1961). Three types of anchoring effects in the absolute judgment of hue. Journal of Experimental Psychology, 61, 7-17. Ward, L. M. (1991). Informational and neural adaptation curves are asynchronous. Perception & Psychophysics, 50, 117-128. Ward, L. M., & Lockhead, G. R. (1970). Sequential effects and memory in category judgments. Journal of Experimental Psychology, 84, 27-34. Ward, W. D. (1953). Information and absolute pitch. Journal of the Acoustical Society of America, 25, 833. Wever, E. G., & Zener, K. E. (1928). The method of absolute judgment in psychophysics. Psychological Review, 35, 466-493. Wiener, N. (1961). Cybernetics or control and communication in the animal and the machine. Cambridge, MA: The MIT Press. (Originally published in 1948 by The MIT Press) Wong, W. (2005). A perceptual Maxwell’s demon. Proceedings of the 21st Annual Meeting of the International Society for Psychophysics, J. S. Monahan, S. M. Sheffert, & J. T. Townsend (Eds.), International Society for Psychophysics, pp. 377-382. Wong, W. (2007). On the physical basis of perceptual information. Proceedings of the 51st Annual Meeting of the ISSS, Tokyo, Japan, pp. 1-4. Wong, W., & Figueiredo, S. (2002). On the role of information and uncertainty in auditory thresholds. Proceedings of the 2002 International Conference on Auditory Display, Kyoto, Japan, pp. ICAD02-1 – ICAD02-6. Wong, W., & Norwich, K. H. (1995). Obtaining equal loudness contours from Weber fractions. Journal of the Acoustical Society of America, 97, 3761-3767. Wong, W., & Norwich, K. H. (1997). Simulation of human sensory performance. BioSystems, 43, 189-197.