CONTINUOUS VARIABLES: A NEW METHOD AND ... describe a new method of recording interre- ... chology, Brown University, Providence 12, Rhode Is- land.
VOLUME
JOURNAL OF THE EXPERIMENTAL ANALYSIS OF BEHAVIOR
6,
NUMBER
2
APRIL, 1963
INTERRESPONSE TIME AS A FUNCTION OF CONTINUOUS VARIABLES: A NEW METHOD AND SOME DATA1 DONALD S. BLOUGH BROWN UNIVERSITY2 A cathode-ray oscilloscope and a Polaroid camera record interresponse times as a function of time, stimulus wavelength, and similar variables. Each response flashes a point of light on the oscilloscope screen; the vertical position of the point gives IRT, the horizontal position gives the value of the other variable. Several thousand such points may be recorded on a single frame of film, and the density of the points indicates the relative frequency of various IRTs. The method has the advantages of a two-dimensional display of continuous variables, flexibility, speed, and relatively low cost. It lacks the advantage of a digital output. Figures show IRTs of pigeons on VI, FR, DRL and extinction, and transitions among these, and also the results of stimulus generalization tests. The results have some provocative features that require much further exploration. Among other things, they suggest that "response rate" as a measure usually includes a response-dependent component that is insensitive to changes in other variables.
data may also help to answer other questions about the generalization test. Most tests are run in extinction; how does the IRT distribution shift during extinction? Most tests are run with brief stimulus exposures; how do these affect the patterns of responding? These questions led me to seek a new method for collecting IRT data. To answer them it seemed necessary to collect IRT data as a function of continuous or multi-valued variables. Most IRT research has been done with apparatus that yields a one-dimensional IRT distribution. Typically, this appears on a row of counters, each counter recording the number of responses that occur in a specified interval-say, between 3 and 4 sec-following the last response. The arrangement makes no provision for following a continuous change in the IRT distribution (though this may be approximated by reading the counters repeatedly), and it allows only one distribution to be recorded at a time. At least 90 counters would be needed to record simultaneous distributions on nine generalization stimuli. These counters would be hard to read and expensive; the IRT apparatus commercially "This research was supported by USPHS research available, with just one row of counters, costs grant MY-2456. The author wishes to thank Mrs. Jane several thousand dollars. Such considerations Voichick and Mrs. Cornelia Clark, who aided in runled ultimately to the choice of the cathode-ray ning the experiments here reported. 'For reprints write the author, Department of Psy- oscilloscope as the basic item of recording chology, Brown University, Providence 12, Rhode Is- equipment. It is fast-acting, flexible, and provides the required two-dimensional display. land.
The main purpose of this paper is to describe a new method of recording interresponse times, and to suggest some of its potential uses. An interresponse time (IRT) distribution shows something of the dependence of responses upon one another, a dependence that plays a role, together with other variables, in determining overall rate. I became concerned with IRTs while studying stimulus generalization in experiments similar to those of Guttman and Kalish (1956) and their associates. In these experiments, a pigeon was trained to peck a key illuminated by a single wavelength of light, and it was then tested with other wavelengths. If the test wavelength differs much from the training wavelength, the bird usually pecks it more slowly. What "more slowly" means has not been entirely clear. Does it peck rapidly for a short time when the stimulus comes on and then stop, or peck at a low but constant rate, or follow some other pattern? Interresponse times (IRTs), recorded separately to the different stimuli that appear during the generalization test, should help to answer this question. IRT
237
DONALD S. BLOUGH
238 METHOD
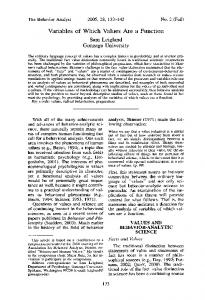
Subjects Twelve adult male White Carneaux pigeons served in the IRT experiments. The birds were run at 75% of their ad lib weights. Most of the data here reported come from one bird, as specified below. Apparatus Input to the CRO. A cathode-ray oscilloscope (CRO) depicts the simultaneous value of two voltages. In the present experiments, one of these voltages represents IRT, and it is applied as follows (Fig. 1). Each response acts through a standard pulse-former to close a relay for about 30 msec. During this time a mercury cell charges a 100 mfd capacitor; full charge is reached in about 5 msec. When the relay releases at the "end" of the response, the capacitor discharges through a resistor. The voltage drops exponentially during discharge-rapidly at first, then more and more slowly, approaching a zero asymptote. Changing the resistance adjusts the speed of this discharge. The voltage remaining at the beginning of the next response indicates the time that has elapsed between the two responses. This voltage is applied to the vertical amplifier of the CRO, hence, the vertical displacement of the electron beam at the beginning of a response represents this IRT. Since the position of the beam is of interest only at the moment of response,>another set of contacts on the response relay (Fig. 1) controls the intensity of the spot on the screen of the CRO. As the response begins, these contacts open, removing 22.5 volts from the external intensity input of the CRO. This change acts through an internal capacitor to flash the spot on the screen for about 1 msec. Since this flash occurs as contacts open, the flash appears just at the maximum beam displacement. The capacitor starts to recharge only after the relay armature has traveled across to close normally open contacts. Then the beam, again invisible, resets to the zero time position as the resistor-capacitor circuit is recycled. Voltage representing another variable is applied to the horizontal input of the CRO. One such variable of particular interest is also time: time elapsing during a session, time from reinforcement, time from stimulus onset,
time from a particular response, and so on. The CRO has a built-in "sweep" mechanism that produces the voltage necessary for displaying short times linearly on the horizontal axis. This sweep can be triggered by a critical event -e.g., reinforcement-by applying a small voltage to a trigger input. When triggered, the CRO beam sweeps across the scope face from left to right at a constant rate of speed. This speed can be set to pre-calibrated values by a knob on the instrument; on our instrument (see Appendix), it will go anywhere from 1 cm per micro-second to 0.2 cm per sec., or even slower if the pre-set calibration points are not used. At its slowest, it takes more than 1 min to traverse the screen. This sweep provided timing in Fig. 5 and 6.
Fig. 1. Basic circuits providing input to the oscilloscope. One circuit times IRTs (to "vert in'), one provides a flash to mark each IRT on the screen (to "flash in'), and one transduces wavelength or some other independent variable (to "horiz in'). The latter includes a "dither" circuit (see text).
A simple potentiometer circuit will supply voltage for timing intervals longer than 1 min; a synchronous motor is attached to the shaft of a precision potentiometer, across which is wired a small battery. If a stepping mechanism drives the potentiometer, the circuit can be used to indicate cumulative responses. The stepping mechanism is geared down by a worm drive similar to that used in a Gerbrands cumulative recorder, so that the desired number of responses (in our case, 900) rotate the potentiometer one full turn. The timing and
INTERRESPONSE TIME AS A FUNCTION
cumulative response circuits were used to produce Fig. 2, 3, 8 and 9. In Fig. 1, a stepping switch is wired as a potentiometer; it indicates stimulus wavelength on the CRO screen. A resistor is attached across each pair of adjacent contacts, and a battery applies voltage across the whole string of resistors. The CRO receives the voltage that appears between the armature and one end of the set of resistors. The position of the switch is synchronized with the wavelength drive of a monochromator, so that, for each wavelength projected on the pigeon's response key, the armature of the switch rests at a given contact. As a result, the horizontal displacement of the CRO beam is uniquely related to the stimulus wavelength being presented. Used alone, the circuit just described would make IRTs at each wavelength fall exactly on one vertical line on the CRO screen. If there were many responses, the flashes on this line would overlap a great deal. To spread out the flashes at each wavelength, a low voltage, 60 cycle "dither", derived from the AC line, is applied to the CRO along with the DC voltage from the stepping switch. Response flashes occur at random with respect to this rapidly oscillating voltage, some coming near the peak, others near the trough and in between. Consequently, the dither voltage spreads the flashes out into a band, rather than a line, across the CRO screen. The stepper and dither circuits were used in Fig. 4, 7 and 10. Photographic recording of response flashes. A Polaroid Land camera (see Appendix) records the brief flash produced by each response. The camera fits snugly in front of the screen, but the experimenter may open a port and see what is transpiring without fear of spoiling the picture. High-contrast transparency film (see Appendix) registers the flashes as white dots on a black ground. The process is not much bother, for focus and exposure, once set, may be left alone. When the experiment begins, the shutter is opened and left open for the duration of the session. The film does not fog even after three hours with the shutter open. When the run is over, the film is pulled through one frame, developed for 10 sec, and the finished transparency is labelled (by writing through the emulsion, which stays wet for about a minute),
239
"dipped", and stored. A new printing device (see Appendix) quickly renders black on white prints of the data. Reliability of oscilloscopic recording. The present method is possible only because very stable oscilloscopes have become available in recent years. The most critical feature is the registration of DC voltages without appreciable drift over long periods of time. Stability of other features, like sweep and intensity, is also important, of course. After our Tektronix instrument has been warmed up for about 45 min it has proven very stable. It has even been left on overnight and used again in the morning without a noticeable change in the beam position or any other characteristic. After about 300 hours of use, our instrument seems to need adjustment to produce a neat round dot for responses at all positions on the screen. There has been no other difficulty. The largest element of error appears to be in the IRT timing circuit. Although we have not studied this problem extensively, runs with mechanically timed "responses" have produced a variation in spot position, for a given IRT, of up to about 2%. The source of this error is uncertain. It may be in the pulse timing mechanism, but most likely it comes from extraneous voltages being picked up from relay sparking etc. Careful shielding, a stable capacitor, and noise-free resistors should all contribute to timing reliability. Exponential timing of IRTs. Why should the non-linear (exponential) capacitor discharge be chosen as the IRT timing voltage, rather than using the linear sweep circuit built into the CRO? One reason is, of course, that the sweep is thus freed for other timing jobs. Secondly, data suggest that more interesting events are crowded together in the short IRT range, so more resolution is needed there. A third reason derives from basic considerations of probability. The purpose of an IRT distribution is to show response-response dependency. For comparison purposes, we should consider how the IRT distribution would look if each response were independent of the time since the last response. As it turns out, in such cases, IRTs are distributed exponentially-many short ones, fewer and fewer as IRT becomes longer.3 The IRTs can be evenly spread along the time axis, however,
by just the transformation that the resistance capacitance circuit provides, if the value
240
DONALD S. BLO UGH
R x C is correctly chosen.3 If this time constant is too large, independent IRTs cluster toward the short IRT part of the time scale; if it is too small, they cluster toward the long end. None of our data have indicated perfect independence of IRTs; there is always a gap in the range below 1 sec, and usually strong peaks around 0.1 and/or 0.4 sec. Also, the timing constant R x C that would be proper in a given case is never definitely known until after the experiment. Further, the theory involved rests on the assumption that the overall rate is uniform during a session, and it often is not. To an approximation, though, evenly spread dots on the exponential IRT display suggest relative independence of responses, against which may be seen the peaks and valleys of dependency. At the very least, the exponential display has proven an efficient way to represent a given number of responses in a limited space. Other apparatus. The birds worked in a standard experimental box, pecking a 1 in. milk plastic key set in a flat black panel. Approximately 10 g. pressure was required to activate the key. Stimuli of selected wavelength (10 m/ bandwidth) were projected on the key from a Ferrand monochromator. These stimuli were of approximately equal brightness for birds working on DRL schedules; for other birds they were not adjusted for intensity. Relays, timers, and punched tape programmers controlled the presentation of stimuli and reinforcements. Cumulative records were made of all responses, and counters recorded responses at each wavelength.
was trained to peck a key illuminated by a light of 559 m,u. After key training, 5 hr were spent on VI schedules of length gradually increasing to VI 4 min. After 5 more hr on VI 4, it received a generalization test in extinction. In this test, each of nine stimuli was presented nine times, 20 sec presentations alternating with 6 sec blackouts. After 10 more hr on VI 4 at 559 mu, the bird received another generalization test. The next day, half an hour on VI 4 was followed by extinction at the training stimulus, with no blackouts. Four more hours elapsed on VI 4, and in the middle of a session the bird was abruptly put on FR 30 for about 2 hr. The experiment terminated with the next session, in which the bird received 190 reinforcements on FR 25. All runs on VI 4 were 2 hr long. Except during the generalization tests, the bird worked at all times on its training wavelength, 559 mu. The IRT data for Fig. 2-7 were recorded during some of the sessions just described, as specified below. Eight birds were run on a variety of DRL or related schedules, and the results of two of them appear in Fig. 8-10. Their experimental histories are long and complex, and it would serve no purpose to recount them here. The conditions on the days in question are specified in the Results.
Procedure To avoid entangling the exposition of the method and its potential uses with experimental histories and other procedural matters, and to lend continuity to the figures, I shall refer primarily to the data of a single bird. Its data look like those from three other birds similarly trained, except that it is the only bird run on ratio schedules. This bird, #773,
(0 I-
3Mueller (1950) and Anger (1956) have discusse(d this point in the context of operant responding. See Feller (1950) for a discussion of the theory of waiting times. The adjustment required to balance the timing circuit exponential against the theoretical IRT exponential is: resistance X capacitance = total time in sec/total responses.
.J. .
8
.
..z..
4 0 z
0
*I-*,,,
V2
e"A.g.....,
1-
of,,,
0
*
:
.
10 20 30 40 50 60 MINUTES OF EXTIN CTION
Fig. 2. A session of extinction after VI 4 mini. Each dot marks one IRT; blank spaces indicate periods of no response.
RESULTS
IRT as a function of session time Figures 2 and 3 show some raw data from single sessions, with time-in-session on the
INTERRESPONSE TIME AS A FUNCTION
241
0
0.2
s~~~~~~~~~~~~~~w
6
60 40 0 80 20 100 MINUTESAFTER SHIFT FROM VI4MIN. TO FR30 Fig. 3. Transition from VI 4 to FR 30. Each dot marks one IRT. No IRT appears for the first response ifter reinforcement. Two successive exposures placed side by side constitute the record.
abscissa and IRT on the ordinate. In these ferentiates strongly, but lasts only about 1 hr; figures, as in all that follow, each dot repre- it is almost gone at the end of the session. A sents a single response; its vertical position third peak at about 1.2 sec has an even more shows the time that elapsed between the re- tenuous existence. sponse and the one just before it. A dark area, A plausible account of these transient IRT where the dots run together, indicates a peak peaks at about 0.7 sec and about 1.2 sec has in the IRT distribution. Figure 2 shows bird 773 on its extinction day, after VI 4 training. To the left are IRTs typical of this bird on VI: a peak at about 0.4 sec and a scattering of longer ones, with a somewhat unusual number between 2 and 3 sec. Few exceed 5 sec. As extinction progresses, the number of long IRTs increases, but the peak at 0.4 sec remains. Another peak of very short IRTsabout 0.1 sec-becomes noticeable. The blank places in the record show where the bird stopped pecking altogether. Figure 3 shows the transition from VI 4, on which the bird had had some 20 hr of training, to FR 30. To the left, the bird is working on VI 4; note the responses at 0.1 sec, the cluster around 0.4 sec, and the rather even scattering from 0.7 sec on up. By following across, one can see the FR contingency gradually take hold. IRTs above 1.5 sec, diminish and drop out briefly at around 50 min, only to reappear in minor way. The figure does not show that these long IRTs late in the session are primarily from responses early in the FR sequence (see Fig. 4). It is most interesting to see what happens to the peak IRTs. The peak at 0.4 sec gradually attracts most of the IRTs, and in the process shifts down slightly to about 0.35 sec. A second peak at 0.7 sec dif-
been suggested by D. G. Anger (personal communication). The longer peaks are approximate multiples of the basic peak at 0.35 sec. Perhaps the longer peaks result, then, from the occasional failure of one or two of the fast pecks to operate the response key. Should this happen, the next peck to register would show an IRT equal to the sum of its own IRT plus the IRTs of the abortive pecks. As the ratio differentiation proceeds, pecking becomes more forceful; eventually all pecks register and the longer IRT peaks disappear. We may conclude that if we looked into our boxes more often, we might more clearly understand the behavior produced by some of our schedules. IRT as a function of serial order in a response sequence Figure 4 shows the IRT distribution of bird 773 during the last 100 reinforced runs on its day of FR 25. Here the FR run is spread along the abcissa. The 100 dots at each sequential position are spread out horizontally by the "dither" circuit mentioned in the Method above. At the left-position "1 "-are the IRTs for the first response after reinforcement; thus they are really end-of-reinforcement-to-response times, or latencies. Most are
DONALD S. BLO UGH
-242 20
during the first half. In pondering these data, one should remember that this is only the bird's second day on FR.
.4..
ID
iIKiIgIIixiiihiai 9
1.
.
31a1 1I
.
0J
~~~~~~~~I
i
I
I
X, I
25 20 is 10 5 SERIAL POSITION IN FR RUN
Fig. 4. IRTs of a bird during 100 successive runs through FR 25. Response latencies after reinforcement are shown in serial position 1; all other dots represent true IRTs.
less than 2 sec-there was little post-reinforcepausing in this session. Note the time scale, which results from a low resistance in the timing circuit (R = 2,000 ohms). Times above 2 sec are scarcely discriminated, but IRT differences down to a few milliseconds are visible in the 0 to I sec range. This is are only four responses just as w'ell, forinthere the sequence) longer than (after the first scattered at a secondary-peak 2 sec. A few are around 0.6 sec-perhaps left over from the transition shown in Fig. 3. The early responses in the sequence are distinguished by some IRTs between 0.7 and 2 sec, but this warmup" does not occur very often. By far the most IRTs are concentrated in a range perhaps 0.1 sec wide, between 0.21 and 0.31 sec. This peak stays almost constant through the ratio run; it may be a bit broader ment
1519
te0
IRT as a function of time from stimulus onset In the generalization tests, stimuli appear for 20 sec intervals alternating with 6 sec blackouts. Does this brief presentation itself produce any response patterning? To display IRT patterns here, the CRO sweep is triggered as the stimulus comes on, and the sweep time is set equal to the stimulus "on" time (20 sec), so IRTs during the presentation are spread evenly across the picture. Figure 5 shows the results of one 2 hr training session (bird 773, VI 4), in which the training wavelength was alternated every 20 sec with a 6 sec blackout. The first "IRT" is actually timed from stimulus onset. The most striking thing about Fig. 5 is the absence of responses in the upper left comer. This, of course, results from the fact that an IRT of given length is impossible before the stimulus has been on for at least that long. Figure 5 shows graphically how short trials in a free-operant situation distort the distribution of responses in time by restricting the opportunities for long IRTs. The locus of "first possible responses" falls on an exponential curve rising from the origin, and they can be seen dusterect there. Most of these first responses have a latency of ,0.5 to 2 sec; very few have longer latency. Second responses are markedly concentrated in the bird's familiar 0.4 sec IRT peak. After the stimulus has been on for more than 5 sec, the relatively even spread of responses above 0.8 sec suggests a large measure of response independence in this range.
14
z
03
M, IP 0,
et'
r'A, " I
3
r. :. 0
Mr J.O
I.-
0
ope,
0
-A
05
-
,
I
.
%
ee.
15 20 I0 5 SECONDS AFTER STIMUWS ONSET
Fig. 5. IRTs of a bird on VI 4; a 6 sec blackout separates 20 sec stimulus presentations. Latencies from stimulus onset are recorded as IRTs.
&
O&
a
0
%.cr4f
.
1 2 4 3 3ECON DS AFTER I RTs > 2 SEC. Fig. 6. Analysis of response pattems that start with long IRT. (See text.)
INTERRESPONSE TIME AS
IRT as a function of time from a selected IRT Figure 6 shows a way to look further into the structure of sequential dependencies among IRTs. It gives IRT as a function of time from any IRT longer than 2 sec. Bird 773 was working here on VI 4, no blackout. Any response following the preceding response by more than 2 sec triggered the CRO sweep, provided the sweep was not already in action. The sweep, moving the beam at 5 mm/sec, spread IRTs for the next 4.5 sec across the screen. Groups of dots show that certain IRTs are relatively more probable following a long IRT. The triggering IRT appears at the upper left (A). The locus of second response IRTs falls on an exponential curve; there are a few at 0.1 sec (B), a major concentration at 0.4 sec (C), some at 0.9 sec (D), some at 1.3 sec (E), and many between 2 and 3.5 sec (F). IRTs for the third responses are harder to locate, for they do not fall along a single locus; the second exponential curve that stands out in Fig. 6 is the locus of third responses after the responses at (C). One can see about the same IRT groupings along this curve as along the other. The location of fourth responses is still more ambiguous; the responses at (H), for example, include both fourth responses following those at (G), and third responses following those at (D). Figure 6 repays further study, but it is perhaps impractical to put it all into words. One interesting point, though, is that in this session, which preceded the transition to FR shown in Fig. 4, groups of IRTs can be seen that are precursors to each of the groups that differentiated during that transition. There are probably better ways to show sequential dependencies. One might be to segregate IRTs for the first, second, third, etc., responses following a given response, rather than putting time on the abcissa. IRT as a function of stimulus wavelength As stated earlier, the following question originally prompted my investigation: what contributes to the "rate differences" that are seen in stimulus generalization. Figure 7 shows a sample of the type of data that gets directly at this question. This is the result of bird 773's second generalization test. At the top, the results appear in the conventional gradient form. The IRT distribution at each wave-
A
FUNCTION
243
z 0 U)
l0 0
21
7
** ,
'
*
6*
'
A
'."
0
In
z
01
*o0
.0
.0
*
U' In IJ .*
,0
**
S
9 ' %0~~~~~~~
AS:
515
541
559
578
603
WAVELENGTH Fig. 7. A generalization gradient from a single session, together with the IRTs of the responses that generate it. The bird was trained on VI 4 at 559 m,u. The displacement of the gradient's mode is not unusual.
length appears in the lower part of Fig. 7. Once again, this bird's characteristic IRT pattern stands out-a major peak at 0.4 sec, a minor one at 0.1 sec, and a more random scatter of longer IRTs. In this case, the gradient is produced mainly by a shift upward of the longer IRTs which leave the time of the short peaks relatively unaffected. It appears, as might be expected, that stimulus control is exerted over the responses following long IRTs; the thing that controls the occurrence of a response with short IRT is the preceding response.
IRTs of birds on DRL schedules Figure 8 shows the development of a temporal discrimination of a bird (#98) on tand
DONALD S. BLOUGH
244
VI 1 DRL 10 sec. On this schedule, a variable interval averaging 1 min first elapsed. Then reinforcement followed the first response after an IRT of 10 sec or more. The exposure for Fig. 8 was started after the bird had 170 reinforcements on DRL 10 sec and 50 reinforcements on the tandem schedule. Figure 8 shows the requirement of a 10 sec wait for reinforcement just taking hold; the number of IRTs above 10 sec is increasing, the number between 1 and 10 sec diminishing. Here again the typical 0.4 sec peak is seen; responses terminating these short IRTs are, of course, never reinforced.
p-
5 z joI V 0
*
I
a
*
0
I
I
v1I1
2
3DRLoI1 a
;
5-
1.
0
U)
I
a5
. . ,.
Ir.
I
I
4-
EXTINCTION
I 0
,gp*O. J:, I
a
I 0*
I
0
a~~~~~~~~ 0~~~~
* X ~2 . 00~~~~
.
0;
*
'le
,4
t.
*
4p'o
pp
oo
0
O
~~~a
I
-~ ~ ~ ~
5~~~~~~
2 30 40 50 60 MINUTES
10
Fig. 9. Extinction after prolonged training on tand VI 1 DRL 10 sec. Extinction starts at the vertical dotted line; the horizontal dotted line indicates the IRT criterion for reinforcement, prior to extinction.
*
see
o
o
a
. 100 200 0 CUMULATIVE RESPS.
I
Fig. 8. Development of a temporal discrimination of a bird on tand VI 1 DRL 10 sec. Responses following the preceding response by less than 10 sec are never reinforced; those with IRTs greater than 10 sec are reinforced once a minute, on the average.
Figure 9 shows the same bird in extinction, 670 reinforcements and three generalization tests after the session shown in Fig. 8. By this time, the bird's 10 sec temporal discrimination has become more marked (though it is poor early in the session-a "warmup" phenomenon). In extinction there are not only more and more long IRTs, but an increasing scattering of shorter ones.
Data from a "steady-state" generalization experiment appear in Fig. 10. This bird (#0) had many hours' experience on DRL and tandem VI-DRL schedules. When the picture was taken, stimuli of various wavelengths were being exposed for 30 sec "on", 6 sec "off" (blackout). Figure 9 shows IRTs on alternate presentations only; on these presentations, the wavelengths appeared in random order and all were associated with reinforcement on tand VI 2 DRL 10 sec. Alternate stimuli, during which responses were not recorded, were all 550 m,; responding to these was reinforced on DRL 3.5 sec. The bird thus got many more reinforcements on 550 m,, and on a shorter DRL, than at any other wavelength. Figure 10 shows the effects of this differential reinforcement at 550 m,u. Once again there are short IRT peaks (strong at 0.1 sec, less at 0.4 sec) that seem insensitive to stimulus variation. As expected, the peak of longer IRTs comes sooner at 550 m, than at other wavelengths. Interestingly, though, there are also fewer intermediate IRTs (around I sec) at and near 550 than elsewhere. Such results
INTERRESPONSE TIME AS A FUNCTION
245
might be added, for those readers who are indifferent to IRTs, that these benefits can be put to good use in many other types of be10 havioral work. 2S A very serious disadvantage of the method is the difficulty in getting quantitative numer, . . . ical data from it. In this it opposes modern .8 . trends; banks of counters are replacing cumuU4 .i V. 4 .-% { lative recorders in the serious analysis of free *. ) ;;. _ operant behavior (although not for "monitorZ 3 :w . .. ing" an experiment), and researchers are at :*. LiJ2 0 , 8 -.least thinking about punched cards and V .* .' magnetic tape. Like the cumulative record, UJ 2 .0. f. the CRO is essentially a graphic device. In this regard, three considerations may be raised. First, there is still cogency to the argument ,., a ~ that, at many times and places in behavioral research, there is danger of over-quantificaI' .,^ .** tion; numbers need to mean something before they are useful. Secondly, even if digital data :. , * * ~V is an eventual goal, graphical methods can IN 4 .1 a highly efficient way to explore. CRO be 568 532 550 506 pictures could reveal, for example, if anyWAVELENGTH - vrp.thing J in a generalization experiment was worth the trouble of using a computer. Third, . Fig. 10. IRTs in a "steady state' generalizatior ex- . b periment. Pecking at 550 my was frrequently reinforced it may be feasible to get digital data from the dot pictures, in certain cases. One can count on DRL 3.5 sec. Pecking at other vwavelengths was infrequently reinforced on-tand VI 2 DRL 7 sec. (See the dots, of course, although in certain cases text.) they overlap to such an extent that this is not possible. A photoelectric process promises are meaningful in the conte3xt of generalizafaster results, and we have used one with some tion theory, but cannot be pursued further success. The raw data transparency is passed here. over a slit of appropriate width, and a photocell densitometer reads the amount of light (thus, the number of dots) coming through. DISCUSSION It converts this to a voltage that may itself The data just reviewed shiow the type of be displayed on the CRO and photographed. work that can be done wit h oscillographic This works, but it is slow and subject to recording of IRTs. Two featuires of the CRO several sources of error. All things considered, make the method worthwhile; the two-dimen- where numbers are essential, counters are sional nature of the display, and, flexibility probably still best. with regard to the variables displayed. The We have already noted a number of informer means that an arbitr.ary variable can teresting points about the results, and the data be added to the usual IRT r ecording system. are too sketchy to lead us to list conclusions. The latter means that anythLing that can be They do support one general hypothesis: converted to voltage can be st;udied and scales certain of the responses that contribute to can be expanded, contracted,,and transformed the "rate" on variable interval and DRL almost at will. In addition, t]he instrument is schedules are almost entirely controlled by easily fast enough to follow anything that a prior responses; their probability does not behavioral scientist will want to look at. The vary with extinction, stimulus change, etc., data can be viewed immediate ly, an important except indirectly through changes in the probconsideration now that comp luters are becom- ability of the responses on which they deing popular. The cost is reli atively low, con- pend. This has been recognized for some time sidering the alternatives (se(e Appendix). It about responding on ratio schedules, where 25
.'
. .
;.
.
4
*
.:
.-
.S *,
()
,.
.
..
V..
a
*
-
'.
5-
246
DONALD S. BLOUGH
special lens, prefocused and mounted in a light-tight hood that fits over the scope face. A viewing window is provided. Tektronix is now making a similar model that may be preferable. Film: Polaroid Land Projection film, PolaLine Type 146-L. $2.61 per eight-exposure role. (Polaroid Corp., Cambridge 39, Massachusetts-carried by local suppliers) This is high-contrast film that produces excellent transparencies. Development time 10 sec. Processing requires use of Polaroid "Dippit", also available locally. Prints of data: Rollaprint. $19.95 (Chemiinvestigation. cals, $1.95/set; paper $2.95/100 sheets) Made by a French concern (Ets Bauchet et Cie) but APPENDIX supplied locally. With this, one can make (These equipment prices and specifications black-on-white contact prints of the Polaroid transparencies in about 15 sec, in ordinary held at the time of our purchase.) Oscilloscope: Tektronix Type 503 X-Y room light. These prints are easier to study oscilloscope. $625. (Tektronix Inc., P.O. Box and handle than the transparencies. 500, Beaverton, Oregon) This CRO has identical horizontal and vertical amplifiers, with REFERENCES sensitivity to 1 mv/cm. This permits free use Anger, D. The dependence of interresponse times upon of any two variables. Its maximum calibrated the relative reinforcement of different interresponse sweep time is unusually large (5 sec/cm), so times. J. exp. Psychol., 1956, 52, 145-161. the sweep is often useful for timing events in Feller, W. An introduction to probability theory and its applications. New York: Wiley, 1950. ranges encountered in behavioral experiN., and Kalish, H. Discriminability and stimments. Other oscilloscopes are available, but Guttman, ulus generalization. J. exp. Psychol., 1956, 51, 79-88. it is extremely important to get a very stable, Hermstein, R. J. Relative and absolute strength of rehigh quality instrument. sponse as a function of frequency of reinforcement. 1. exp. Anal. Behav., 1961, 4, 267-272. Camera: Hewlett-Packard Model 196A OsC. G. Theoretical relationships among some cilloscope Camera. $440. (Tektronix Adapter Mueller, measures of conditioning. Proc. Nat. Acad. Sci., 196A-20, $4.50) (Hewlett-Packard Co., 1501 Wash., 1950, 36, 123-130. Page Mill Rd., Palo Alto, California) This is a standard Polaroid Land camera with a Received June 18,1962
most responses are firmly locked in a chain; consequently, ratio schedules are rarely used where a sensitive dependent variable is needed. It is possible that the insensitive component in behavior on other schedules is benign, and applies only a multiplicative factor to the output of "sensitive" responses. On the other hand, it may have to be given its due, particularly where rate enters into quantitative relationships (e.g., Herrnstein, 1961). Probably the insensitive component increases in importance with training, with significant consequences. At any rate, the matter bears