Hopeman Sandstone in Moray, northern Scotland. These aeolian sandstones are of Permian age and are cut by extensional brittle structures believed to be ...
Introduction Fracture patterns and fracture attributes, such as orientation, intensity, size, and shape, can exert significant control on fluid flow in hydrocarbon reservoirs. The quantification of fracture attributes and their patterns in outcrop analogues can guide the construction of testable expressions for multidimensional scaling relationships, and their application to fracture pattern prediction in the subsurface. Fractal scaling laws are often based on an assumption of random spatial locations, but for clustered patterns of deformation bands these laws require modification. Cataclastic deformation bands and their patterns have been mapped and quantified in outcrops of the Hopeman Sandstone in Moray, northern Scotland. These aeolian sandstones are of Permian age and are cut by extensional brittle structures believed to be Jurassic in age. The collection of structural data from 3 approximately orthogonal planes allows us to explore scaling relationships from 1D to 3D. We analyse the scaling and distribution of deformation band size and orientation.
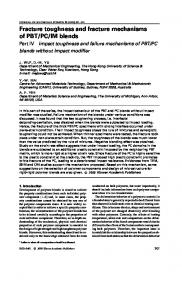
Quantifying patterns of deformation bands This study is based on data from outcrops and samples of aeolian sandstones near Hopeman area in northern Scotland. We used scanlines with circular scan windows to estimate fracture density, intensity and mean trace length. Fracture attribute data have been collected from sub-horizontal wave cut platforms and sub-vertical faces of sea stacks and cliffs. We took 8 samples approximately 25 by 20 by 15 cm in size. Each sample was cut into 12-15 slices approximately 0.8 cm thick to enable the measurement of the geometrical properties of the deformation band network (Figure 3). We use the term lozenge to refer to the area (volume) relatively undeformed sandstone situated between two strands of a composite deformation band. The dimensions of ten lozenges have been measured from each slice. The shapes of the lozenges between deformation bands is identified as anisotropic i.e. lozenges have a long axis parallel to the strike of deformation bands (X axis), an intermediate axis parallel to the dip direction of the bands (Y axis) and a short axis normal to the deformation band strike (Z axis). The dimensions of the lozenges (X, Y, Z) have been measured and are presented in the Flinn diagram (Flinn, 1962, Figure 2). Based on these data, it is clear that the lozenges have oblate shapes. At the grain scale, it has already been recognised that the long axis of oblate-shaped grains lying in the plane of deformation bands and pores tend to be longer and interconnected along the deformation band planes (Antonellini and Aydin, 1995). Deformation band patterns have been quantified at Hopeman. The deformation bands have a distinctive anastomosing and wavy pattern in map view, and straight pattern in cross section. Geometrically, deformation bands form lozenge-shaped compartments at a range of length scales (mm to decametre, over 3 or 4 orders of magnitude. The map shows a hard-linked geometry of connected deformation bands (Figure 1). The main orientation of the deformation bands is East-West and most dips are to the south (60-75o). Eye structures have been observed in the wavecut platform. These structures are considered to have a disc shape in three dimensions (Antonellini and Aydin, 1995). The characteristic of the spatial distribution of deformation bands is essential. Intensity of deformation bands increases towards the Western part of the mapped area. The deformation bands are thinner and more widely spaced towards the South compared to those of the Northern part, where a major normal fault slip surface occurs with a thick zone of deformation bands.
3rd International Conference on Fault and Top Seals - From Characterization to Modelling Montpellier, France, 1-3 October 2012
Eye structure Fig. 4
Ladders
Normal Fault
Figure 1 Map view of the geometry of deformation band patterns in the Hopeman area, northern Scotland, UK. The dark blue inset is a close-up view. These maps show that the deformation bands form a hard-linked system. Equal area rose diagrams show orientation distributions of the mapped deformation bands.
Lozenges 15
K>1 (X ˃˃ Y ≥ Z)
12
AA11/HP1
9
AA11/HP2
X/Y
AA11/HP3 AA11/HP4
AA11/HP5
6
AA11/HP6 AA11/HP7
AA11/HP8
K>Z).
3rd International Conference on Fault and Top Seals - From Characterization to Modelling Montpellier, France, 1-3 October 2012
(a)
(b)
X Z
Y
Figure 3 (a) a photo of the whole rock sample cut into slices and (b) a schematic diagram showing the XYZ reference frame in 3D. Ladder fractures have been found localized between two zones of sub-parallel deformation bands (Figure 4). These fractures are short, sub-parallel deformation bands that span the volume between two parallel zones of deformation bands (Schultz and Balasko, 2003). Their spacing is proportional to the spacing of the master bounding deformation band zones (Antonellini and Aydin, 1995). Furthermore, the dip and slip sense of these ladders develop antithetic to that of the two major parallel zones of deformation bands. (a)
(b)
(c)
8 7
Def ormation bands
Spacing
6
Ladder f ractures
5
4 3
2 1
0 1
5
9 13 17 Number of fractrures
21
Figure 4 Geometry of ladder fractures between a pair of master deformation bands. a) Sub-vertical face of sea stack looking northeast. b) 3D block diagram of master deformation band zones and ladder fractures. c) Relationship between spacing of the deformation band zones and the spacing of ladder fractures. The published scaling relationships for attributes across dimensions depend on the assumption of random spatial distributions, and yet fractures are rarely randomly distributed in space. The fracture attribute data of figure (1) such as orientation and length have been plotted by using FracPaQ2D tool (Healy, 2012) in MATLAB software (Figure 5). These fracture attributes can help to understand the scaling relationships in the clustered zones of deformation bands within fault damage zone.
3rd International Conference on Fault and Top Seals - From Characterization to Modelling Montpellier, France, 1-3 October 2012
5 100 0
0 0
60
120 180 240 Trace angle, degrees
300
360
0
60
120 180 240 Trace angle, degrees
300
360
Trace angles (area weighted), n=69 Trace lengths versus angles, n=69
Trace angles, n=69 25
race angles, n=69
Trace angles, n=69 0
(a) 20 330
800 (b) 700
30
Mapped traces, n=69 0
Frequency
Y, pixels
1000 1500
90
2000 0
1000
15
60
10
40
20
270 2000 3000 X, pixels
4000
90
5000
500 400 300 200
5
100
240
180
120 0
0 0
60
120 180 240 Trace angle, degrees
210
300
360
0
60
150 n=69 Trace lengths,
10
(c)
120 180 240 Trace angle, degrees
300
360
Trace lengths, n=69
180
(d)
9
Trace angles (area weighted), n=69
8 Trace traces, angles, n=69 n=69 Mapped
6
1000
0
1500
Trace angles, n=69 0 330
30
5 300
60
4
2000
3 0
1000 270
2000 3000 X, pixels
4000 90
Cumulative frequency
7
500 Frequency
0
1
10
40
20
5000 2 270
90
1 0 180
0
0
240 100
200
300 400 500 600 Trace length, pixels
700
10
120 800
2
10
3
10 Trace length, pixels
Figure 5 Fracture attributes210of the 2D fracture pattern map (Figure 1) plotted by using FracPaQ2D 150 180 (Healy, 2012) tool in MATLAB. (a) Histogram of trace angles. (b) Area-weighted rose diagram of trace angles. (c) Trace length histogram. (d) Cumulative frequency distributions of trace lengths. Density, pixel-2
Intensity, pixel-1
MTL, pixels
0
0
1500 2000 0
0
1000
0.01
0.02
0
500
500 Y, pixels
Conclusions
500 1000
Y, pixels
Y, pixels
Y, pixels
300
Trace length, pixels
600
0
500
1000
1000
1500 We explore relationships between different fracture 1500 attributes in outcrop analogues of subsurface 2000 2000 reservoirs. We identified the shapes of the lozenges between deformation bands, and mapped 2000 3000 4000 5000 0 1000 2000 3000 4000 5000 0 1000 2000 3000 4000 5000 X, pixels X, pixels pixels deformation band patterns and emphasized their relation with ladderX,fractures. In the future, we aim to relationships and this will 5guide the of 4000testable expressions for 0.03 quantify 0.04 0.05 0.06 these 0.07 1000 construction 1500 2000 2500 3000 3500 4500 5000 0 1 2 3 4 x 10 multidimensional scaling relationships using empirically derived power law exponents. -5
Acknowledgements Kurdistan Regional Government (KRG) is thanked for their sponsorship to this project. We thank Carlos Ponce Escudero from Universitat Autònoma de Barcelona for valuable discussions on the geometry of lozenges in shear zones and deformation bands. References Antonellini, M. and A. Aydin, 1995, Effect of faulting on fluid flow in porous sandstones: geometry and spatial distribution, American Association of Petroleum Geologists Bulletin, vol. 79, no. 5, p. 642-671. Flinn, D., 1962, On folding during three-dimensional progressive deformation, Quarterly Journal of the Geological Society of London, vol. 118, no. 1-4, p. 385-428. Healy, D., 2012, FracPaQ2Dv7, Unpublished MATLAB script. Schultz, R. A. and C. M. Balasko, 2003, Growth of deformation bands into echelon and ladder geometries, Geophysical Research Letters, vol. 30, no. 20, p. SDE 5-1 - SDE 5-4.
3rd International Conference on Fault and Top Seals - From Characterization to Modelling Montpellier, France, 1-3 October 2012