Investigation of students’ experiences with a web-based computer simulation Kay Lipson, Sue Kokonis, Glenda Francis Swinburne University of Technology, Lilydale Locked Bag 218, Lilydale, 3149, Australia
[email protected],
[email protected],
[email protected] This paper reports the findings of a qualitative study undertaken by the authors to investigate what students see when participating in a computer simulation session designed to support the development of conceptual understanding of the role of the sampling distribution in hypothesis testing. We have observed and documented the students’ assisted interaction with a dynamic and interactive computer simulation, and looked for patterns and themes arising from the data. On the basis of the data collected, we have identified four developmental stages through which the students progressed during the activity, and we have termed these stages as recognition, integration, contradiction and explanation. The identification of the stages has given us some direction for the development of further computer interactions.
1
Introduction
There has been widespread concern expressed by members of the statistics education community in the past few years about the lack of any real understanding demonstrated by many students completing courses in introductory statistics. This deficiency in understanding has been particularly noted in the area of inferential statistics, where students, particularly those studying statistics as a service course, have been inclined to view statistical inference as a set of unrelated recipes. As such, these students have developed skills that have little practical application and are easily forgotten. The term understanding here is used to mean conceptual understanding, rather than procedural understanding, as defined by Hiebert and Carpenter (Hiebert & Carpenter, 1992). They use the terms procedural understanding to describe the student’s ability to carry out routine tasks successfully, whilst conceptual understanding implies an understanding of what they are doing and why they are doing it. It has been previously shown that conceptual understanding does not necessarily follow from competence with standard statistical tasks (Lipson, 1995), and yet without the development of conceptual understanding students will find their studies in statistics of little use to them in future. The research reported here describes how a group of students interacted with a computer simulation activity which was designed to support the development of understanding of the sampling distribution, and in particular the role of the sampling distribution in hypothesis testing. There have been some studies which have established that it is possible to increase student understanding after participating in an instructional sequence with computer technology designed for that purpose (delMas, Garfield, & Chance, 1999). The purpose of this study however was not to evaluate either the student or the technology, but rather to gain better understanding of what students actually see when interacting with the activity, and what information they extract from what they see.
2
Theoretical Framework
In this study learning has been viewed from the constructivist position, where students are not regarded as passive receivers of information but rather as active constructors of highly personal mental structures called schema (Howard, 1983; Piaget, 1970). Thus, what one knows is considered to be a product of the individual’s perception of an external experience,
and how that experience has influenced or been influenced by their existing cognitive structure. Here the emphasis is on understanding, with the goal of the learning process that the student undergoes appropriate cognitive development rather than just learning to carry out a task. In earlier research Lipson (Lipson, 2000) examined the role of the sampling distribution in the development of both conceptual and procedural understanding of statistical inference. The results of this study showed that students construct highly individual schemas for statistical inference but that the degree of integration of the concept of sampling distribution within this schema is indicative of the level of development of conceptual understanding in that student. This relationship between sampling distribution and conceptual understanding has long been suspected by other researchers, and a multitude of computer activities have been developed to help promote an understanding of sampling distribution (delMas et al., 1999; Martin, Roberts, & Pierce, 1994). However, despite their popularity, overall the value of these computer-based activities is as yet unclear, with little research based evidence as to their effectiveness. According to delMas, Garfield and Chance (delMas et al., 1999): We found that despite the accepted approach used to integrate simulation software into a statistics class, there is little published research describing and evaluating such an approach (para 7)
However, statistics educators continue to advocate that dynamic computer simulation, which can illustrate both the process and product of sampling, can facilitate the development of student understanding of complex concepts such as sample, population and sampling distribution. The theoretical arguments for the potential of the technology to develop understanding are well documented by Kaput (1992). Firstly, with computers, we are now in the position to create new notations (ways of recording and /or displaying information), that are more capable of conveying a complex idea than the traditional paper based notations. Notations that are dynamic rather than static and interactive rather than inert, offer potential representations which were once not possible. Dynamic representations are those that change as a function of time. Interactive notations are ones with which the learner may undertake a form of dialogue. According to Kaput (1992): .. the key difference with notations instantiated in interactive media is the addition of something new to the result of a user’s actions, something that the user must then respond to. (p.526)
He argues that links that are difficult to establish using inert media can be made visually overt using the dynamic and interactive nature of new technologies. As a consequence it is easer for the learner to establish desirable and appropriate links within and between schemata.
3
Method
The sample used in the study comprised a small group of students, recruited by asking for volunteers to participate in a research project. The students were quite diverse, including male, female, mature-age, and overseas participants. The study was timed so that all students would have completed the descriptive statistics component of the introductory statistics subject, but they would not yet have begun any formal study of statistical inference. The research was based on eight interviews, analysed using a qualitative methodology. The object of the research was to document the students’ experiences as they interacted with a computer simulation which was designed to support the development of the fundamental concepts of statistical inference (Lipson, 2000). For some time we have introduced statistical inference using a real example which was reported in the newspaper. The postal authority, Australia Post, had published a report in which they claimed that at least 96% of letters are delivered on time, and a journalist decided to test that claim by posting several letters. Of the 59 letters that he posted, he found that 52 (88%) were delivered on time, and thus he wrote an article in the newspaper with the headline “Doubt on Letters Promise”. In order to investigate whether the journalist’s claim seemed to
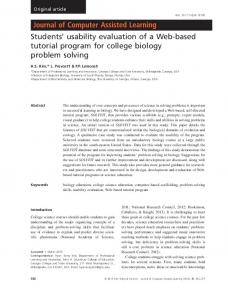
be supported by the data, we used a computer-generated sampling distribution which was written expressly for this purpose (Stirling, 2002). The working components of the computer screen with which the students interacted are shown in Figure 1. The screen is essentially divided into three sections. In the top left hand section the information about the population proportion and the sample size are given in text. On the top right hand side are two representations of the current sample proportion, a pie chart and a frequency table giving both numbers and proportions of letters delivered on time and late. Taking up the remainder of the screen is the empirical sampling distribution (shown in Figure 1 after 200 samples have been drawn). Samples where 52 or fewer letters have been delivered on time are depicted with a blue plus (+), the others with a black cross (x).
Figure 1
The computer simulation screen
The simulation has been constructed to support the development of many other statistical concepts, such as the integration of the empirical and theoretical representations of the sampling distribution, and the notion of the p-value. In this paper we will describe only the journey through the development of the logic of hypothesis testing, using explicitly the empirical sampling distribution only, and without formalising the concept of p-value.
4
Results
The data were gathered during an open-ended relatively unstructured session with students guided in the their interaction with the software by the researchers. We chose not to conduct clinical interviews as we wished to explore the ways in which students would move towards a satisfactory endpoint for the session. For the purpose of the exercise, a satisfactory endpoint entailed the student being able to accurately and succinctly make a brief verbal description of the problem which had been addressed during the session, and the conclusion which had been reached on the basis of the interaction with the simulation software. The sessions were videotaped, and then typed transcripts prepared which were subsequently encoded using the qualitative software analysis package Nvivo ("NVivo," 1999-2002). As a result of the coding process it appeared that reaching a satisfactory endpoint required moving through four identifiable stages, for all students. While some students moved directly through the stages, for others progression was circuitous, requiring much doubling back because moving on did not appear possible until the requirements of the previous stage had been met. We have named these stages as recognition, reconciliation, contradiction and explanation, and each is described in detail in the following sections. In reporting the data we have used the symbol R to identify the researcher, and the symbols S1, …, S8 to indicate responses from the eight students.
4.1
Recognition
In order for the simulation activity to have any potential for assisting the student to construct a schema for empirical sampling distribution, the student needs to interpret and link each of the screen representations. This recognition phase appeared to have three substages. In the first instance, the student needed to appreciate what each of the components of the screen was trying to communicate. Although much of the screen is quite well labelled, when asked to describe the elements of the screen, before any samples had been taken, most of the students were generally not sure what any of the elements meant and tended to read the screen rather than describe it. However, once the simulation began the students attention was drawn to the dynamic aspects of the screen. All of the students who were specifically asked to comment on the pie chart were able to correctly interpret the visual aspect of it. For example: R: And that little pie chart over there, in the red and green, what do you think that’s telling us? S6: That’s telling us, the big green part is how much were on time, and how many were late.
However, the one student who was not directly asked to comment on the pie chart until later in the session had the following comment: S2: If, well maybe, if you did want a suggestion maybe I would say that that should be labelled underneath saying current sample of things, because I couldn’t figure it out. I knew it was changing every time I clicked the sample but I wasn’t really sure as to what was shown.
A similar response of general understanding was found when the students’ attention was drawn to the dynamically forming sampling distribution. All of the students could appreciate that the number of letters on time in each sample was being recorded here, with the current sample result being displayed simultaneously in the pie chart and with a red cross on the empirical sampling distribution. However, we found that the students often had to be asked directly what they thought was happening here, reinforcing the view of Salomon and Globerson (1987), who noted that mindfulness (that is, mindful engagement with the task) is a necessary pre-requisite for a fruitful learning experience. The second substage of recognition involves the appreciation that the actual samples vary, even though they are being drawn from the same population. Once again, all students willingly acknowledged this sample to sample variation, with comments such as: S1: I’d expect a bit of variation S4: Well your total amount of letters stays the same, so your 100% stays the same and your on time and late changes S7: They’re all different, like they wouldn’t be able to control every single influence in an actual experiment
The third and final substage of recognition was concerned with the interpretation of the empirical sampling distribution. Specifically, the student needed to be able to say how often in their particular sampling distribution, a given sample result had been observed. Several students were able to do with little hesitation, as illustrated in the following: R: S5: R: S5:
What, see this column here, it’s got 6 crosses in it. What does that represent? That 55 letters got delivered on time. How come there are 6 crosses there? Cause that’s how many out of the 50 samples, that’s how many times it occurred.
However, other students found that this interpretation was the cause of confusion, such as: R: S3: R: S3: R: S:
Can you tell me what this represents here? Um, that would be the mode. Most of the time 56 of the 59 letters were on time, out of our data sample. Okay. So, here we’re talking about 50. 50 of what? 50. This is confusing. Unpack what’s confusing. I would have thought, this is very, very confusing. Because I first thought that this 50 represents that I have tested, done this test with 50 letters. But this clearly states that I’ve done it more times. Or with more letters. Maybe I’ve done this test 50 times then.
For this student, there was a temporary confusion between the size of the sample, and the number of samples drawn, perhaps because of the similarity of the numbers. Another student, who did not appear initially to have trouble interpreting the sampling distribution, became confused when asked to further interpret the plot by explaining the + denoted in blue (the one in the critical region). R: So these are the number that were on time. So, how many, of the 50 samples that we did, how many times for example were 59 delivered on time? S3: 4? R: That’s right…on the vertical, what would we label that if we were going to label it? S3: the frequency? R: Right, now, we’ve got black crosses and we’ve got one blue cross. What’s that blue cross telling us? S3: That only one letter… that one letter… I don't know. R: Keep going, keep talking. S3: It doesn’t make sense any more. Umm, that there’s only one letter that was delivered. R: So what does each of these crosses represent again? S3: One letter, being delivered.
After further discussion with each of these students it was possible to clarify these confusions, by going back to the generation of the empirical sampling distribution, adding some samples if necessary. However, it becomes clear from these discussions that the interpretation of the frequency plot, an important stage in building a schema for sampling distribution, is a more difficult task for students from the static plot that it is from the dynamic, accumulating plot. In summary, it would appear that the developmental stage that we observed, the recognition stage, involved the formation by the student of a schema for the empirical sampling distribution for the proportion. The apparent inability of the student to proceed without the formation of this schema is consistent with our beliefs about how knowledge is constructed. In particular it confirms the importance of establishing a schema for sampling distribution prior to the development of an understanding of statistical testing. 4.2
Integration
We termed the next stage in the developmental sequence integration, in that it required the student to bring together the separate notions of the sampling distribution from the hypothesised population, and the observed sample result. This involved firstly an explicit attempt to locate the sample result on the sampling distribution which they had generated. Having done this, the student then made a judgment about the likelihood of the observed sample being obtained from the same population as the samples summarised in the computer generated sampling distribution. The completed sampling distribution summarised 200 samples, which may or may not have included samples where 52 letters were delivered on time, the journalist’s result. The researcher then drew the students’ attention to the journalist’s result, and asked the student to locate the journalist’s result on the sampling distribution. They were then asked to comment on the likelihood of observing such a sample. We observed that this deliberation about likelihood seemed to involve for several students two substages: • Recognition that in the sampling distribution very few, often zero, samples like the journalist achieved were shown. • The interpretation of this result to mean that the journalist’s sample was very unlikely if the sample was drawn from this population. Excerpts from the discussions undertaken with all of the students in the study are summarised in table 1. From the table it can be seen that eventually, sometimes after repeated questioning, all students were confident that the observed sample would be extremely unlikely if sampling
from the hypothesised population, and we observed that recognition of this was necessary before the student was able to move on to the next stage. From a consideration of the student schema for sampling distribution, it would seem that the integration stage involved an attempt by the student to assimilate their knowledge of the journalist’s sample result with the schema for sampling distribution which had developed in the recognition stage. Table 1: S1 S2
S3
R: S: R: S: R: S: R: S: R:
S4
S: R:
S6
S: R: S: R: S: R: R: R:
S7
S: R: S: R: S: R:
S5
S: R:
S8
S: R: S: R: S: R: S:
Students responses to the sample result
How likely is it that you’d get 52 out of 59 if they were, with 96% efficiency? Not very likely at all. Not at all, not possible, going on that What do you think, does this look like it kind of belongs in this pattern? Doesn’t fit, no. Is it likely or unlikely? Unlikely. If you have a look at this down here, how often did it happen that, out of the 200 times we did it, we got 52? Is that that one here? Yes, it’s one out of 200 and it’s that one there. Exactly. So would you consider that to be pretty unlikely? Yes. From a population where the proportion was 96%, or .96. Okay, how, were there any samples this time and you’ve got 200 samples now, were there any samples from this population where 96% of letters were delivered on time, were there any samples that were as low as what the journalist had? There was only that one there. …think about the 52 letters delivered on time, does it still look like it’s inconsistent? It still looks pretty unlikely…There were none. Yes. Okay. Alright, so, how will.. can you remember how many he got on time? 52. 52. So 52 looks to be a likely or unlikely result? From the, from that distribution. An unlikely result. …just having taken 50 samples, how likely is it that you’d get a sample of 52 letters arriving on time? According to that, according to what’s on the actual, um, 52? Yeah. Well nothing, there wasn’t, you wouldn’t say there was, there was a chance. So if he got 52 out of 59, how likely is it that his sample comes from this population? Not likely. On the basis of this little experiment that we’ve carried out here on the computer, how likely is it that if Australia Post deliver 96% of letters on time, we’re going to get a sample with 52 out of 59 only on time? Um well yeah it’s like half a percent. So we went through a process of taking a whole lot of samples, assuming that Australia Post were correct, and we wanted to see how likely 52 letters were, and what did we decide about the likelihood of that? Very unlikely. That he’d get 52. Okay…when we were saying the likelihood of getting 52 out of 59 if Australia Post does deliver on time, what’s the likelihood of that? Zero If Australia Post is correct, how likely is it that you’d get a sample of 52? Only 52 delivered on time. Probability is zero, it’s not at all likely. Would it be reasonable to assume that our journalist’s sample came from this population? No.
4.3 Contradiction The third stage in the developmental sequence we have termed as contradiction, in that it involves recognition by the student that there is in fact a tension created at the integration stage. That is, we observed that the students’ needed to recognise that there was an
inconsistency between the sample and the hypothesised population which may lead them to question the hypothesis concerning the population. While all students in the end verbalised that the likelihood of the journalist’s sample coming from the hypothesised population was small, this was not necessarily seen as a problem. On the whole, the students were unperturbed by this apparent contradiction. A summary of the student reactions to the small likelihood of the journalist’s sample is given in Table 2. The range of responses given by students included the following possibilities: • the journalist had actually deliberately or accidentally done something wrong; • the fact that such a result could occur and was not impossible meant that he had just achieved a fairly unlikely sample; • a misinterpretation of the situation, which assumed that hypothesised population was correct, and that the intention was to determine the likelihood of the sample; • the small likelihood of the observed result threw doubt on Australia Post’s claim. The students’ initial responses to the small probability of the journalist’s result are summarised in Table 2. Table 2:
S1 S2 S3 S4 S5 S6 S7 S8
Student responses to the small likelihood of the sample being drawn from the hypothesised population
Well yeah the journalist might have been a bit inaccurate going by this particular information. But then I’d probably want to know where these samples come from. Um, well, what we got in the individual sample was from an actual sample of data, and I guess Australia Post, their findings were based on population data. Probability more than actual sampling. Seeing he’s a journalist he might have actually put something in, you know what I mean? That he um just, wasn’t quite, like he didn’t take enough samples, like he only had the one 52, one group of 52, if he’d have done it again he might have got a completely different answer…Yeah, so he just had a really bad lot of letters. I think it’s unlikely that they actually did that, and got those results. I think they (Australia Post) might have changed it, to make it sound like they’re doing a good job. Ah there’s a 1% chance that the journalist was right. Well if you’ve done like 200 things, and found that only a very small percent is 52, most likely, well he, because that was 88%, and if you put it to like 56, 57, 59 you’d probably get about 96, you’d probably go with Australia Post. Well if he had a good sample, then I guess his headline was correct, but I don’t know where we get, where do we get these numbers from? I mean according to these numbers he is wrong and Australia Post is right.
This lack of apparent concern is potentially quite problematic for the development of understanding of hypothesis testing. Even when students acknowledged the low probability of the sample coming from the hypothesised population, they tended to look for a practical explanation for this, rather than a statistical solution. Before looking at the statistical explanations for the seeming inconsistency between the sample statistic and the population proportion, one needs to actually consciously acknowledge that there is an inconsistency. The admission of a contradiction did not follow spontaneously from the simulation for many students, and required many probing questions by the researchers before several of the students were prepared to admit that we should go further, and look at the statistical explanations for this observed contradiction. And, before the students would even contemplate a statistical explanation they all needed to be reassured, often several times, that the journalist had collected his data in good faith. The notion of a good sample became very important in all of the interviews.
This observation concerning the students’ reticence to see a problem is consistent with earlier research concerning the development of conceptual understanding. As staged by delMas, Garfield and Chance (1999): Research indicates that people in general are resistant to change are very likely to find ways to either assimilate information or discredit contradictory evidence, rather than restructure their thinking in order to accommodate contradictions (para 35).
Reflecting on the relationship between this stage in the developmental sequence, and its relationship to the development of the student schema, brought some new insights to the researchers. In the student schema conjectured by the researchers at stage 2, there is a single population, from which a sampling distribution is generated, and a multitude of samples which are variable. At stage 3, the students must recognise that there is a single sample, which is known, and that there are a range of possible populations from which it may have been drawn. Thus the student schema needs to expand to accommodate the concepts of variability in both sample and population. 4.4
Explanation
The fourth stage, which we termed explanation, involves the consideration of the possible statistical explanations for the contradiction between the observed sample and the hypothesised sampling distribution, and the choice of one explanation as preferred (but not necessarily true). The students’ final explanations of the scenario are given in Table 3. S1
R:
S2
S: R:
S4
S: R: S: R:
S5
S: R:
S6
S: S:
S3
S7
R: S: R: S:
S8
R: S:
Table 3: Student responses to the alternative statistical explanations So assuming that the sample that the reporter has got is a good sample, what does that tell you about Australia Post’s claim? What is it, that um, they claim to be a bit more efficient than what they actually are? Is it that in fact we just happened to get one of these samples down here, or is that really very unlikely, unlikely enough for us to say oh no I don’t think that’s what’s happened, it’s probably that Australia Post don’t deliver 96% on time. Which do you think is the more likely explanation? Australia Post lied. So if his sample was a good sample, what can we say then about what conclusions you draw? That Australia Post are wrong? And it’s not anywhere near 96%, they’ve been cheating. Yeah, okay. So what we’re saying is, if Australia Post are telling the truth, what he got is very unlikely to happen. So what’s the alternative to that? That Australia Post is dodgy. If Australia Post’s claim is true, it would be very unlikely for the journalist to get that result. But he did get that result. So maybe Australia Post isn’t right. Well, I think that basically Australia Post were sort of fudging their results, to make it seem like they were doing a good job and that the journalist didn’t really do his research properly like didn’t take into account different factors, and that’s why he got different results, and he was, making it up or something. Because he didn’t like Australia Post or whatever or… So how likely do you think it is that Australia Post is correct? Well there’s a big difference between, given that the journalist is saying, if the journalist is to be, what he’s done is right then Australia Post has, it’s a big jump, so you wouldn’t say but, it’s wrong. So if you had to put it in your own words, what would you conclude? Lets put you under a bit of pressure here. Given that, if the journalist was to be right, then you could say that Australia Post has, kind of like given themselves a better rap than what the statistics I guess kind of like indicate. So if it’s, because it’s very unlikely to happen just by chance. So if that’s true, then what must our conclusion be? That Australia Post lied.
For the students to use the low observed frequency of the sample result to question the Australia Post claim they needed to realise that the sampling distribution had been generated under the assumption that Australia Post were correct. Whilst this had been explicitly talked about at the beginning of the exercise, it needed reinforcement at this stage for the students to be able to correctly interpret the contradiction. As stated by one of the students, when asked to reflect on the development of her understanding: S5: It was the if. That was the, yeah it was definitely the if Australia Post’s claim. Once I worked out that it was if, then it was not necessarily fact.
As can be seen from the table, all of the students eventually acknowledged that the more likely explanation for the observed result was that Australia Post delivered something less than 96% of letters on time. It can also be seen that, in spite of reaching this conclusion, one student (student 6) still felt that the journalist had to have done something wrong. An aspect of concern was that the language used by many of the students in voicing their conclusion was quite definite, using phrases such as “Australia Post lied”. It is possible that the students have not really appreciated that they are making a choice based on the basis of probabilities, and that the dichotomy that they are dealing is not true versus false, but rather likely versus unlikely. The extent to which the students appreciated this difference is an important consideration for future studies. 5
Summary and Conclusion
This study has served as the first small step for the researchers in our quest to determine what students see when participating in such a computer simulation session, and what they make of what they see. We have observed and documented the students’ supported interaction with a dynamic and interactive computer simulation, and looked for patterns and themes arising from the data. Whilst the number of students participating in the student was small, we feel we have already learned a lot about how student reasoning develops, and some ways to facilitate the development of their understanding with regard to the empirical sampling distribution and its role in statistical inference. The finding that the students might be considered to move through distinct stages in the construction of a schema for hypothesis testing is only preliminary, and more research is needed to confirm this conjecture. However, if this pattern of development is consistent, then it has implications for the design of software and the learning and teaching pedagogy within which this software is embedded. Each stage would need to be specifically addressed by the activity, and some key tasks embedded within the computer simulation which could assess whether the student was ready to proceed, or whether they needed more experience or more focussed questions at the current stage. We feel that the study has provided some pedagogical evidence of the usefulness of the dynamic and interactive capacities provided by modern computer software. This was shown most clearly at the recognition stage of the developmental sequence, and on reflection this makes sense. The software has really been developed to address this stage, and one could argue that it is achieving its purpose here well. What is now clear to the researchers is that we have not exploited the potential of the software for supporting conceptual development at the other developmental stages. For example, a simulation activity such as the one used here would seem to need to be accompanied by a series of questions which would ensure that the students have paid attention to, and understood, all of the components of the screen display. They should also have their attention drawn to which components of the screen display change as the sampling takes place, and which do not. It also appears that students need to have a lot more experience in thinking about the kind of samples that one could expect to arise from the sampling process, and those that might be considered to be unusual, before the decision–making stage of the interaction. Students could be asked to generate a sampling
distribution for a hypothesised population, and then asked whether the distribution is consistent or inconsistent with an array of sample results, in order to give them experience with a variety of situations, and in particular to recognise those where a contradiction seems apparent. And having recognised the contradiction, a variety of hypothesised populations could be investigated, in order to see what range of populations could feasibly give rise to the sample result obtained. Our first modification of the activity, however, will be to choose a different scenario for the introduction of the sampling distribution and hypothesis testing. Whilst we considered it important to use a real world example, we underestimated the potential for the actual context of the simulation to distract the students from the statistical arguments which were embodied in the activity. The two opposing viewpoints in the example used, that of Australia Post and the journalist, were not seen as equally viable by the students. Australia Post was seen as a large, reputable, and well-resourced organisation. The journalist was seen as potentially corrupt, and as an individual lacking in resources. The power relations between the two groups were unbalanced, and the effect of this was something that we would never have been aware without observing the students struggle with this problem. What this research study has shown us to date is that the ways in which students interact with a computer simulation such as the one used here are extremely complex. Also, it would be difficult for those with statistical expertise to anticipate the impediments to the development of student understanding which have been displayed here. The process of talking to students, documenting their interaction, and asking them to explain the reasoning behind their answers has been invaluable in assisting us to understand how their understanding develops, and how we may better facilitate the development of that understanding. 6 References delMas, R., Garfield, J., & Chance, B. (1999). A model of classroom research in action: Developing simulation activities to improve student's statistical reasoning. Journal of Statistics Education, 7(7). Hiebert, J., & Carpenter, T. P. (1992). Learning and Teaching with Understanding. In D. Grouws (Ed.), Handbook of Research on Mathematics Teaching and Learning (pp. 65-97). New York: MacMillan. Howard, D. V. (1983). Cognitive Psychology. New York: Macmillan. Lipson, K. (1995). Assessing Understanding in Statistics. In J. Garfield (Ed.), Collected Research Papers from the 4th International Conference on Teaching Statistics: ISI. Lipson, K. (2000). The role of the sampling distribution in developing understanding of statistical inference. Unpublished Ph.D., Swinburne University of Technology, Melbourne. Martin, P., Roberts, L., & Pierce, R. (1994). Exploring Statistics with Minitab. Melbourne: Nelson. NVivo. (Version 2.0.161)(1999-2002). QSR International Pty Ltd. Piaget, J. (1970). The Principles of Genetic Epistemology. New York NY: Columbia University Press. Salomon, G., & Globerson, T. (1987). Skill may not be enough: The role of mindfulness in learning and transfer. International Journal of Educational Research, 11(6), 623-638. Stirling, D. (2002). Computer Assisted Statistics Teaching (Version 2.1): http://wwwist.massey.ac.nz/CAST/CAST.zip.