PROOF ONLY Not for redistribution AQUATIC MICROBIAL ECOLOGY Aquat Microb Ecol
Published ■ ■
ABSTRACT: While phagotrophy is reported for a number of phytoflagellates, the factors that influence feeding are known for only a few species. We examined the effects of nutrients, irradiance, and time of day on ingestion rate by field populations of the mixotrophic dinoflagellate Neoceratium furca. In nutrient addition assays, N. furca consistently showed a significant reduction in feeding when inorganic nitrogen (N) and phosphorus (P) were added together. Responses to separate N or P addition varied, with ingestion rates decreasing, increasing, or remaining unaltered depending on which nutrient was potentially limiting, as indicated by inorganic nutrient concentrations. Feeding was also influenced by light and was often highest at or below irradiance levels comparable to those experienced by cells at time of collection. Darkness and/or high irradiance sometimes led to a decrease in feeding, possibly due to reduced nutrient demand or photoinhibition. Ingestion rates of N. furca over the course of a day showed distinct but conflicting diel feeding patterns. While feeding increased during the day in one experiment, ingestion rates were higher at night in the other. These patterns were likely a direct response to the changing light environment over the course of the day, as they agreed well with findings for the same N. furca populations during the corresponding light level experiments. Results from both nutrient addition and light level experiments confirm that N. furca employed phagotrophy primarily as an alternative means of obtaining limiting nutrients rather than carbon. KEY WORDS: Neoceratium furca · Mixotrophy · Feeding response · Irradiance · Nutrients · Diel feeding · Dinoflagellates Resale or republication not permitted without written consent of the publisher
It has long been known that some phytoflagellates are capable of feeding on other protists (Hofeneder 1930, Biecheler 1936, 1952). In addition, certain heterotrophic protists have been shown to harbor kleptochloroplasts (Larsen 1988, Skovgaard 1998, Lewitus et al. 1999, Stoecker et al. 2009). However, only within the last few decades have the extent and magnitude of these phenomena been recognized. Mixo-
trophic protists are abundant in a wide variety of different habitats, ranging from fresh to open ocean waters, from the equator to the poles, and from oligotrophic to eutrophic environments (Sanders 1991, Burkholder et al. 2008, Stoecker et al. 2009). Prey varies widely as well and can include bacteria (e.g. Nygaard & Tobiesen 1993, Jeong et al. 2005), various phytoflagellates (e.g. Skovgaard 1998, Li et al. 1999), and ciliates (e.g. Smalley et al. 1999, Park et al. 2006). Feeding rates of mixotrophic phytoflagellates can be
*Email:
[email protected]
© Inter-Research 2012 · www.int-res.com
INTRODUCTION
Smalley GW, Coats DW, Stoecker DK
Department of Geological, Environmental, and Marine Sciences, Rider University, Lawrenceville, New Jersey 08648, USA 2 Smithsonian Environmental Research Center, Edgewater, Maryland 21037, USA 3 Horn Point Laboratory, University of Maryland Center for Environmental Science, Cambridge, Maryland 21613, USA
PP: CP
1
TS: MD
Gabriela W. Smalley1,*, D. Wayne Coats2, Diane K. Stoecker3
CE: TSt
Influence of inorganic nutrients, irradiance, and time of day on food uptake by the mixotrophic dinoflagellate Neoceratium furca
A 1599 22 Oct 2012
Vol. ■ ■ doi: 10.3354/ame01599
2
Aquat Microb Ecol ■ ■
as high as those reported for heterotrophic flagellates (Sanders 1991, Nygaard & Tobiesen 1993, Smalley & Coats 2002, Seong et al. 2006). Chloroplast-retaining protists can contribute significantly to primary production in the microplankton size class and, at times, to total primary production (Putt 1990, Stoecker et al. 2009). Furthermore, mixotrophic growth rates can be significantly higher than purely phototrophic or heterotrophic growth, for both mixotrophic phytoflagellates (Skovgaard 1996, Li et al. 1999, Adolf et al. 2006, Kim et al. 2008, Jeong et al. 2010) and heterotrophic species that retain prey chloroplasts (Skovgaard 1998, Jakobsen et al. 2000). Many harmful algal species — especially among the dinoflagellates — are capable of mixotrophy, and this nutritional strategy may play an important role in bloom development and maintenance (Burkholder et al. 2008). However, despite the recognition of its importance in aquatic ecosystems, the effects of mixotrophy on planktonic food web dynamics and structure are only beginning to be understood. To gain a better understanding of the role that mixotrophs play, the physiological ecology of these organisms has to be investigated. This includes experimental data on the relationships between phagotrophy, phototrophy, and environmental factors, such as prey availability, irradiance, and nutrient concentrations. These data are only available for a limited number of species (Stoecker 1998). Nevertheless, it is now clear that mixotrophs vary widely in their photosynthetic and phagotrophic capabilities and should be regarded as occupying different points along a spectrum of nutritional strategies (Jones 1994). It is thus useful to categorize mixotrophs into functional types so that they can be incorporated into food web models and their effect on ecosystem dynamics can be assessed (Jones 1997, Stoecker 1998). Based on the limited data available, Stoecker (1998) proposed 6 general types of mixotrophs. Species that grow equally well as phototrophs and as heterotrophs are considered Type I mixotrophs. Type II includes all of the primarily phototrophic organisms that are capable of phagotrophy under certain conditions. This type is further subdivided based on the different environmental factors involved in feeding regulation. Type IIA mixotrophs feed in response to limiting dissolved inorganic nutrients, and many phytoflagellates seem to fit this model at least partly. In Type IIB, feeding is a means for obtaining a limiting trace organic growth factor and should thus not be affected by changing dissolved inorganic nutrient concentrations. Type IIC mixotrophs feed to obtain carbon when light is limiting, and feeding should
thus increase in low light. Type III mixotrophs are primarily phagotrophic but are capable of photosynthesis either with their ‘own’ plastids (Model IIIA) or with algal symbionts or sequestered algal plastids (Model IIIB). In order to refine the model types proposed by Stoecker (1998), it is important to investigate the physiological ecology of photosynthesis and phagotrophy in additional mixotrophic species. One such species is Neoceratium furca (Ehrenberg) Claparède et Lachmann (= Ceratium furca), a cosmopolitan, primarily phototrophic dinoflagellate also capable of ingesting ciliate prey (Bockstahler & Coats 1993, Li et al. 1996, Smalley et al. 1999). In Chesapeake Bay, USA, N. furca is capable of forming late-summer blooms in the southern, more saline, portion of the bay (> 300 N. furca ml−1; Smalley & Coats 2002). In situ ingestion rates measured during the summer of 1995 and 1996 varied from 0 to 0.11 prey dinoflagellate−1 h−1, and N. furca at times exerted substantial grazing pressure on its preferred prey, a ciliate species of the genus Strobilidium (Smalley et al. 1999, Smalley & Coats 2002). In the laboratory, feeding in N. furca was strongly influenced by dissolved inorganic nutrient concentrations and cellular carbon (C), nitrogen (N), and phosphorus (P) content (Smalley et al. 2003), suggesting that N. furca may be a Type IIA mixotroph. In the present study, we examined the relationship between feeding and nutrients in field populations of N. furca. We also investigated the influence of irradiance and time of day on ingestion rate to further refine the role of mixotrophy in N. furca.
MATERIALS AND METHODS Experimental procedures For all experiments, whole water containing Neoceratium furca was collected at different stations in Chesapeake Bay or at the dock of the Smithsonian Marine Station (SMS), Ft. Pierce, Florida, USA (Indian River Lagoon; Table 1). Unless otherwise noted, surface water containing N. furca was collected in the morning (between 07:00 and 09:00 h) and distributed into 500 ml or 1 l polycarbonate bottles, depending on N. furca density. Bottles were then incubated in flowing seawater baths aboard the RV ‘Cape Henlopen’ (Chesapeake Bay) or at the SMS outdoor laboratory (Indian River Lagoon), maintaining the water temperature close to the in situ surface temperature. At both locations, the seawater
Smalley et al.: Mixotrophy in Neoceratium furca
Table 1. Sampling locations for the various experiments testing the effects of inorganic nutrient concentrations (Nutrient), light level (LL), and time of day (Diel) on feeding in Neoceratium furca. Stations for dissolved nutrient analysis (nutrient addition assays) are from the Chesapeake Bay Program (CBP) Water Quality Database and provided the best match to our sites in terms of location, sample date, and sample depth. CB: Chesapeake Bay; IIRB: Indian River Lagoon, Forida, USA Expt
Depth
Nutrient concentration Nutrient-1 Surface Nutrient-2 Surface Nutrient-3 Surface
Location Latitude/longitude
CB CB CB
37° 49’ N, 76° 17’ W 38° 18’ N, 76° 17’ W 37° 44’ N, 76° 11’ W
Corresponding CBP stations for dissolved nutrient data: CB5.4W (Nutrient-1) Surface CB 37° 49’ N, 76° 17’ W CB5.1 (Nutrient-2) Surface CB 37° 19’ N, 76° 17’ W CB5.5 (Nutrient-3) Surface CB 37° 42’ N, 76° 11’ W Light level LL-1 LL-2 LL-3 LL-4 LL-5 LL-6 LL-7
4.5 m Surface Surface, 3 m Surface Surface Surface Surface
CB CB CB IRL IRL IRL IRL
37° 53’ N, 76° 10’ W 37° 49’ N, 76° 17’ W 38° 02’ N, 76° 23’ W 27° 32’ N, 80° 21’ W 27° 32’ N, 80° 21’ W 27° 32’ N, 80° 21’ W 27° 32’ N, 80° 21’ W
Time of day Diel-1 Diel-2
Surface Surface
CB IRL
37° 49’ N, 76° 17’ W 27° 32’ N, 80° 21’ W
baths were covered with neutral-density screens to reduce the incoming light intensity by ~65%, unless otherwise indicated. Ingestion rates of N. furca under the various treatment regimes were then determined as described by Smalley et al. (1999). Briefly, the bottles were spiked with 1 µm fluorescent latex microspheres (Polysciences) at a final concentration of 5 × 10⁶ ml−1 to label the naturally occurring prey ciliates. Prey quickly ingested the microspheres (after 1 min, > 75% of small choreotrich ciliates were labeled; after 15 min, the percentage increased to > 95%) and remained labeled throughout the 6 h feeding trials (Smalley et al. 1999). Aliquots were removed at predetermined time intervals and immediately preserved in modified Bouin’s fixative (Coats & Heinbokel 1982) for subsequent determination of ciliate and N. furca abundance and analysis of ingestion rates. Three nutrient-addition assays (Nutrient-1, -2, and -3) were performed to determine the effect of inorganic nutrient additions on feeding in Neoceratium furca (Table 1). Treatments consisted of a control (no nutrients added), nitrate addition (880 µM NO3), phosphate addition (36 µM PO4), and nitrate and phosphate addition (880 µM NO3 and 36 µM PO4). These concentrations corresponded to the nutrient
3
levels found in f/2 growth medium (Guillard & Ryther 1962). Duplicate bottles were used for Nutrient-1, while Nutrient-2 and -3 received 4 replicates each. In Nutrient-1, 125 ml aliquots were withdrawn 0, 2, 4, and 6 h after microsphere addition. NutriDate ent-2 and -3 differed slightly in that 20 ml aliquots were withdrawn immediately after the addition of micro9 Jul 1996 spheres, and 1 l (gently concentrated 21 Sep 1999 20 Jul 2000 to 20 ml on 20 µm Nitex mesh; Nutrient-2) or 250 ml (Nutrient-3) of the 10 Jul 1996 sample was fixed in modified Bouin’s 20 Sep 1999 solution after 6 h of incubation. Data 12, 27 Jul 2000 on dissolved inorganic (nitrate and nitrite, ammonia, and dissolved inor24 Aug 1995 ganic P) and organic nutrient concen9 Jul 1996 trations (dissolved organic N [DON] 23 Jul 2000 22 Aug 1997 and dissolved organic P [DOP]) were 24 Aug 1997 obtained from the Chesapeake Bay 25 Aug 1997 Program (CBP) Water Quality Data27 Aug 1997 base (www.chesapeakebay.net) for sampling stations and depths that 7−9 Jul 1996 best matched our stations in terms of 27−29 Aug 1997 location, sample date, and sample depth (Table 1). For Nutrient-1 and -2, CBP data were sampled at similar locations within 1 d of our experiments. For Nutrient-3, the best available data sets were from a station slightly to the south of our sample site and dated 1 wk prior to and 1 wk after our experiment. Surface salinity and water temperature were in close agreement between our sampling stations and the corresponding CBP stations (26.4°C, 11.2 ‰ for Nutrient-1 vs. 27.0°C, 11.6 ‰ for CBP Stn CB 5.4W; 22.9°C, 17.6 ‰ for Nutrient-2 vs. 22.8°C, 17.3 ‰ for CBP Stn CB 5.1; 25.3°C, 15.3 ‰ for Nutrient-3 vs. 25.5°C, 15.9 ‰ and 24.0°C, 15.5 ‰ for CBP Stn CB 5.5 on the 2 dates), further indicating that the CBP data provided a good match for our sites. The effect of irradiance on feeding in Neoceratium furca was tested by incubating natural populations of N. furca under various irradiance conditions (lightlevel experiments LL-1 to LL-7; Table 1). Whole water was collected from the surface, except in LL-1, where water was collected at 4.5 m, and LL-3, where water was collected at 3 m in addition to at the surface. LL-1 also differed in that the prey density in the whole water sample was manipulated by adding 20 ml of Strobilidium sp. culture, a preferred prey of N. furca (Smalley et al. 1999). Strobilidium sp. cultures were isolated from Chesapeake Bay by A. Li and
Aquat Microb Ecol ■ ■
4
maintained on the small flagellate Isochrysis galbana in 13 ‰ f/2 medium (Guillard & Ryther 1962) at 20°C and 50 µmol photons m−2 s−1 on a 14 h light:10 h dark cycle. Because feeding rates in LL-1 were insignificant when no prey was added (< 0.006 prey N. furca−1 h−1), we only focus on the treatments that had received a prey addition. Different light levels were achieved by incubating bottles without added screening (100% of surface irradiance, I 0) or wrapped in 1 (~66% I 0), 2 (~33% I 0), 3 (~18% I 0), 5 (~6% I 0), or 7 (~2% I 0) layers of screening or in aluminum foil (dark treatment). At least 5 different light levels were chosen for each experiment. Duplicate polycarbonate bottles were incubated for the experiments conducted in Chesapeake Bay, while we used 5 replicate glass bottles for the experiments carried out in Florida. In LL-1 and LL-2, 20 and 125 ml aliquots, respectively, were removed after 0, 1, 2, 4, and 6 h of incubation. In all other light level experiments, a 20 ml sample was withdrawn immediately after the addition of microspheres. After 6 h, the remaining 1 l was gently concentrated to 20 ml on 20 µm Nitex mesh and preserved in modified Bouin’s solution. Two additional experiments were carried out to determine the effect of time of day on feeding in Neoceratium furca (Diel-1 in Chesapeake Bay and Diel-2 in Indian River Lagoon; Table 1). Surface water was dispensed into two 20 l carboys and incubated in flowing water baths. For Diel-2, the water was first filtered through 136 µm Nitex mesh to reduce the large number of copepods present in the sample (the water used for Diel-1 did not contain many copepods). We then conducted a series of 6 h feeding trials with water from each carboy. For each trial, we removed subsamples of 250 ml (Diel-1) or 1 l (Diel-2) from each carboy, added microspheres, and incubated the subsamples in the same water baths as the carboys. Aliquots of 20 ml were immediately withdrawn from these subsamples and preserved in Bouin’s fixative, while the remainder of the sample was fixed after 6 h. Feeding trials were repeated every 3 h for 48 h (Diel-1) or 42 h (Diel-2). Irradiance was measured at regular time intervals throughout the daylight hours using a LI-COR LI-1000 data logger with a spherical quantum sensor (LI-193SA).
Analytical procedures To enumerate and identify ciliates, 15 to 20 ml modified quantitative Protargol stain (QPS) preparations were made (Smalley et al. 1999) from sam-
ples collected immediately after the start of the experiments. For Nutrient-1 and LL-2, samples fixed at the end of the incubation were also stained for analysis of ciliate abundance and species composition. Ciliates present in arbitrarily selected microscope fields (×1000; Zeiss Axioscope, 450 to 490 nm excitation, 520 nm barrier filter) were enumerated and identified to genus until 100 cells had been encountered or an equivalent of 4 ml wholewater sample analyzed. The number of microspheres ingested by each specimen was also recorded. As the nutrient and irradiance treatments could have affected microsphere uptake and/or survival of ciliates, we analyzed ciliate abundance and percentage of labeled ciliates at the start and end of Nutrient-1 and LL-2 for any treatment and/or time effect (2-way ANOVA, SAS repeated measures; The SAS System for Windows, Release 8.01, SAS Institute, 2000). In the diel feeding experiments, ciliate abundance and the percentage of labeled ciliates at the start of each feeding trial were examined for significant differences over time (1-way ANOVA, SAS/MIXED). Neoceratium furca densities and the number of food vacuoles per N. furca cell were determined by placing each sample (whole water or concentrated, as indicated in ‘Experimental procedures’) in a Zeiss settling chamber (5 to 50 ml, depending on N. furca densities). After allowing sufficient time for settling, the entire chamber was scanned at ×200 to ×400 on an inverted microscope equipped with epifluorescence optics (Leitz Diavert, 450 to 490 nm excitation, 520 barrier filter). Cell densities were obtained by determining the total number of cells per chamber. The number of labeled food vacuoles per cell was recorded for the first 100 specimens encountered. In experiments in which the number of food vacuoles was determined for several time points over 6 h (Nutrient-1, LL-1, LL-2), the hourly ingestion rate was calculated as the slope of a linear regression of number of food vacuoles per cell plotted against time. Hourly ingestion rates in the other experiments were obtained by dividing the mean number of food vacuoles per N. furca at the end of the incubation by the incubation time. Ingestion rates were compared for significant treatment-specific differences with a 1-way ANOVA (SAS/MIXED). In LL-3, both irradiance and collection depth varied, and data were analyzed for interaction of the 2 factors using a 2-way ANOVA (SAS/MIXED). Data from the diel experiments were tested for the presence of a significant periodicity in feeding rates using a method suggested by Heinbokel (1988). The mean overall inges-
Smalley et al.: Mixotrophy in Neoceratium furca
tion rate was calculated, and each individual sample was scored as either above (+) or below (−) this mean value. Feeding patterns were considered diel if all of the ‘+’ scores occurred together in an uninterrupted sequence (time scale is considered to be circular). The fraction of dividing Neoceratium furca cells was determined for samples collected during the diel feeding experiments. Modified QPS preparations (20 ml) were made from samples collected immediately after the start of the individual feeding trials. The first 100 cells encountered were categorized into 3 groups: non-dividers (ND, no sign of nuclear or cell division, fully developed epi- and hypocone); dividers (D, initiated or completed nuclear division, initiated cytokinesis); and recently divided cells (RD, completed cytokinesis, not fully developed epi- or hypocone). The relative frequency of division (F ) was calculated using the following equation (Weiler & Chisholm 1976): F=(D + ½RD)/(ND + D + ½RD)
(1)
RESULTS Nutrient addition assays Neoceratium furca densities in these water samples varied somewhat among experiments but were generally low (Table 2). Despite highly variable total ciliate abundance and percentage of labeled cells, the densities and label uptake of the preferred prey of N. furca, Strobilidium spp., were remarkably similar among experiments (Table 2). In Nutrient-1, we
5
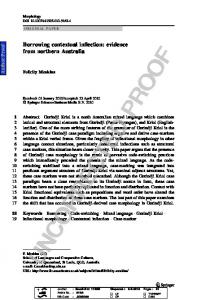
found no significant treatment-specific differences in the net growth of total and choreotrich ciliates and Strobilidium spp. over the 6 h incubation period (ciliates: p = 0.357; choreotrichs: p = 0.559; Strobilidium spp.: p = 0.894; data not shown). The percentage of ciliates, choreotrichs, and Strobilidium spp. that had ingested fluorescent microspheres also did not change over time, regardless of treatment (ciliates: p = 0.341; choreotrichs: p = 0.444; Strobilidium spp.: p = 0.594; all data were arcsine square root transformed for analysis; data not shown). Net growth and potential changes in labeling of prey were tested only for Nutrient-1 but were assumed to be applicable to the other 2 experiments as well. Therefore, any significant changes in ingestion rate measurements for N. furca were unlikely to be due to differences in abundance or label uptake/retention of the ciliate prey. Dissolved organic nutrient concentrations (DON and DOP) of water collected by CBP at comparable sites around the time of our experiments were similar at all sites and times (Table 2). Inorganic nutrient concentrations were much lower and varied greatly. Nitrogen concentrations (especially NH4) in Nutrient-3 were much higher than in the other 2 experiments, while PO4 concentrations were higher in Nutrient-1 and lowest 1 wk after our Nutrient-3 experiment was conducted. Consequently, molar DIN:DIP ratios were lowest in Nutrient-1 and highest around the time of Nutrient-3. We found significant changes in the Neoceratium furca ingestion rate with nutrient addition in all 3 experiments (Fig. 1). In Nutrient-1, ingestion of labeled prey by N. furca decreased significantly upon the addition of NO3 or a combination of NO3
Table 2. Neoceratium furca and ciliate abundance, percentage of ciliates that had ingested fluorescent microspheres after label addition, and dissolved inorganic and organic nutrient concentrations in water samples collected for nutrient addition assays or nutrient analysis. Data are presented as mean ± SE, where applicable Expt
N. furca (ml−1)
Abundance (ml−1)/(% labeled) Ciliates Choreotrichidsa Strobilidium spp.
NH4
NO2+ 3
Nutrients (mg l−1) PO4 DON DOP DIN:DIP (molar)
Nutrient-1
7.8 ± 0.38
47.6 ± 2.00 28.5 ± 1.79 (68.9 ± 2.02) (88.2 ± 1.46)
9.7 ± 1.05 (99.0 ± 0.69)
0.0056
0.0025
0.005
0.287
0.012
6.8
Nutrient-2
1.2 ± 0.16
261 ± 17.7 133 ± 8.5 (44.2 ± 1.75) (86.5 ± 2.23)
10.9 ± 1.47 (100.0 ± 0.00)
0.005
0.0018
0.0037
0.273
0.012
8
Nutrient-3b
4.5 ± 0.35
71.1 ± 4.34 39.5 ± 1.94 (61.0 ± 7.62) (91.1 ± 1.27)
11.8 ± 1.27 (98.7 ± 1.14)
0.0116 0.0115
0.0008 0.0009
0.0038 0.0028
0.267 0.284
0.007 0.011
16.5 22.3
a
Order Choreotrichida, defined in accordance with Small & Lynn (1985) to include the suborders Tintinnina, Strombidinopsina and Strobilidiina b Because Nutrient-3 fell between 2 CBP cruise dates, nutrient values from both cruises (1 wk prior to and 1 wk after our experiment) are reported (see Table 1)
Aquat Microb Ecol ■ ■
6
0.16
A
Nutrient-1 a
0.12
ab 0.08
bc
c
0.04
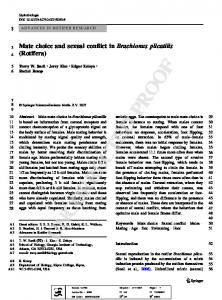
ingestion rates, while additions of NO3 did not alter ingestion of labeled prey (p < 0.0001; Fig. 1C). No clear and consistent relationship emerged between absolute inorganic nutrient concentrations and the feeding response of N. furca to nutrient addition. However, when comparing feeding responses to inorganic nutrient ratios, low DIN:DIP ratios were associated with decreased feeding upon NO3 addition (Nutrient-1 and -2), while PO4 addition led to decreased feeding at a high DIN:DIP ratio (Nutrient-3).
0.00
B
Nutrient-2
Prey N. furca–1 h–1
b
Light-level experiments
0.03 a 0.02
c
c
0.01
0.00
Nutrient-3
C a
c
0.06 b 0.04
c
0.02
0.00 Control
PO4
NO3
Both
Nutrient addition treatment Fig. 1. Neoceratium furca. Feeding response to nutrient addition. Water samples containing N. furca were collected from (A−C) 3 different stations throughout Chesapeake Bay. Treatments consisted of a control (no nutrients added), phosphate addition (36 µM PO4), nitrate addition (880 µM NO3), and nitrate and phosphate addition (880 µM NO3 and 36 µM PO4). Feeding was determined over a 6 h period. Different letters indicate significant differences between means (p < 0.05). Data are presented as mean ± SE throughout all of the figures
and PO4, but not of PO4 alone (p = 0.032; Fig. 1A). Feeding in Nutrient-2 was again significantly influenced by nutrient addition (p < 0.0001), increasing when PO4 was added but decreasing with the addition of NO3 or NO3 and PO4 together (Fig. 1B). Finally, in Nutrient-3, additions of PO4 alone or in combination with NO3 led to significantly lower
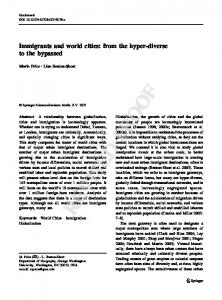
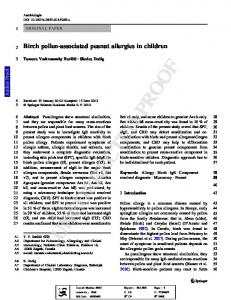
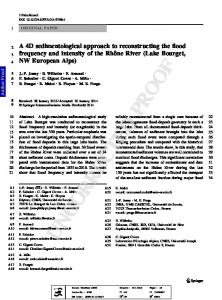
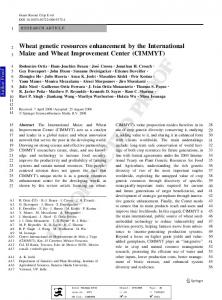
Neoceratium furca densities in water samples collected for each light-level experiment were again fairly low (Table 3). Total ciliate and Strobilidium spp. abundance varied from one experiment to the next (Table 3). However, the percentage of labeled Strobilidium spp. was high (> 95%) in all experiments (Table 3). Ciliate abundance and the percentage of labeled ciliates in LL-2 did not exhibit any treatment-specific changes over time when exposed to different light levels (abundance of ciliates: p = 0.262; choreotrichs: p = 0.131; Strobilidium spp.: p = 0.073; percent labeled ciliates: p = 0.178; choreotrichs: p = 0.100; Strobilidium spp.: p = 0.452; data not shown). In LL-3, the ciliate densities in surface waters and at 3 m were not significantly different from each other (ciliates: p = 0.352; Strobilidium spp.: p = 0.601; data not shown). Thus, changes in the abundance or label uptake/retention of the ciliate prey were not responsible for any significant differences in ingestion rate of N. furca (assuming that the results regarding prey growth and label uptake/ retention from LL-2 are representative of the other light-level experiments). The irradiance at collection depth was variable for the experiments conducted in Chesapeake Bay, mainly due to sampling at various depths (Table 3). In contrast, the irradiance at collection depth for the Indian River Lagoon experiments was similar for all 4 experiments (Table 3). However, because of the reflectivity of the water tables used for the Indian River Lagoon experiments (LL-4 to LL-7), the irradiance levels during incubations were much higher (£3400 µmol photons m−2 s−1) than at the water surface where cells were collected (£1000 µmol photons m−2 s−1). We found significant effects of irradiance on ingestion rate in all experiments except for LL-1 (Figs. 2 & 3; p < 0.001 for LL-2 to LL-7). Although ingestion rates were not significantly different from each other
Smalley et al.: Mixotrophy in Neoceratium furca
Table 3. Neoceratium furca and ciliate abundance, percentage of ciliates that had ingested fluorescent microspheres after label addition, and irradiance at collection depth in water collected for light level experiments. Data are presented as mean ± SE. nd: not determined
7
course of the experiments (Diel-1: p = 0.49; Diel-2: p = 0.42; Fig. 5). Similarly, we found no significant differences between the percentages of labeled Strobilidium spp. at each Expt N. furca Abundance (ml−1)/(% labeled) Irradiance −1 a time point (Diel-1: p = 0.16; Diel-2: (ml ) Ciliates Choreotrichids Strobilidium (µmol photons −2 −1 p = 0.49; data not shown). In Diel-1, spp. m s ) 99.7 ± 0.35% (mean ± standard error Chesapeake Bay [SE]) of Strobilidium spp. ingested LL-1, 4.5 m 3.3 ± 0.12 69.2 ± 5.44 67.3 ± 5.78 33.6 ± 2.25 240 the fluorescent microspheres, while (92.1 ± 0.37) (94.9 ± 0.56) (95.0 ± 0.42) 97.4 ± 0.98% contained the label in LL-2, Surface 7.8 ± 0.38 51.5 ± 1.91 31.8 ± 1.43 9.4 ± 0.58 1600 Diel-2. Feeding in N. furca exhibited (71.6 ± 0.50) (90.5 ± 0.87) (99.6 ± 0.42) a diel periodicity in both experiLL-3, Surface 3.8 ± 0.32 115 ± 4.1 62.0 ± 3.91 10.2 ± 0.77 975 ments, although the nature of this (nd) (nd) (nd) pattern differed (Fig. 5). During the LL-3, 3 m 2.6 ± 0.27 121 ± 3.4 74.6 ± 4.64 13.5 ± 5.35 75 (nd) (nd) (nd) experiment conducted in Chesapeake Bay, Diel-1, ingestion rates inIndian River Lagoon LL-4, Surface 4.5 ± 0.71 64.4 ± 3.06 57.3 ± 2.46 39.5 ± 2.18 1000 creased early in the morning and re(89.0 ± 1.68) (97.7 ± 1.17) (99.1 ± 0.54) mained relatively high throughout LL-5, Surface 2.2 ± 0.21 13.5 ± 0.78 11.2 ± 0.81 2.4 ± 0.17 1050 the day (Fig. 5A). As irradiance (85.5 ± 2.67) (99.5 ± 0.47) (100.0 ± 0.00) levels decreased in the evening, inLL-6, Surface 1.6 ± 0.23 10.1 ± 0.59 7.7 ± 0.58 0.6 ± 0.09 1050 gestion rates also declined. In con(75.0 ± 3.94) (98.1 ± 1.09) (100.0 ± 0.00) trast, feeding during the Indian River LL-7, Surface 2.2 ± 0.29 54.4 ± 6.46 52.1 ± 6.25 22.4 ± 2.15 890 Lagoon experiment, Diel-2, was (91.9 ± 1.22) (94.2 ± 1.23) (99.6 ± 0.43) highest at night and decreased rapa Order Choreotrichida, defined in accordance with Small & Lynn (1985) to include idly before sunrise, remaining low the suborders Tintinnina, Strombidinopsina and Strobilidiina throughout the day (Fig. 5B). The division frequencies estimated for N. in LL-1 (Fig. 2A), the general response pattern was furca were similar in both experiments. In Diel-1, the very similar to that observed in the other experihighest percentages of cells (~12%) were undergoing ments, where ingestion rate decreased in the dark division early in the morning, around 06:00 h of the treatment. Ingestion rate was usually highest at or second day (Fig. 6A). Few dividing cells were obbelow an irradiance level comparable to that experiserved on the first day. Similarly, N. furca in Diel-2 enced by the cells at time of collection (LL-3 to LL-7). exhibited maximum division frequencies (6 to 8%) In these experiments, a further increase in irradiance at 06:00 h on both days (Fig. 6B). led to a reduction in feeding (Figs. 2C & 3). This was When we exposed subsamples of the Neoceratium particularly evident in the experiments conducted in furca populations used for Diel-1 and -2 to various Florida (Fig. 3). However, the absolute irradiance irradiance levels (LL-2 and LL-7, respectively), the leading to this decrease varied among the different feeding response of N. furca to the light and dark experiments (Fig. 4) and was unrelated to irradiance treatments was very similar to that observed in the at the collection depth (Table 3). In 1 experiment, diel experiments during the day and at night. AverLL-3, we examined the influence of collection depth age ingestion rates during daylight in Diel-1 were not on the light-induced feeding pattern exhibited by significantly different from those found in the light Neoceratium furca and found no significant differtreatments of LL-2 (0.089 ± 0.0072 vs. 0.097 ± 0.0049 ence between feeding in cells collected at the surface prey N. furca−1 h−1, respectively; p = 0.466), while rates observed in the dark treatment were comparaand at 3 m (p = 0.512; Fig. 2C). ble to those exhibited by N. furca during the night (0.034 ± 0.004 vs. 0.037 ± 0.0040 5 prey N. furca−1 h−1, respectively; p = 0.791). Likewise, ingestion rates in Diel experiment the dark treatment of LL-7 were as high as those observed during the night in Diel-2 (0.076 ± 0.0049 In both experiments, the densities of the preferred vs. 0.061 ± 0.0037 prey N. furca−1 h−1, respectively; prey of Neoceratium furca, Strobilidium spp., were p = 0.076), while rates exhibited by N. furca during not significantly different from each other over the
Aquat Microb Ecol ■ ■
8
0.035
A
LL-1 ns
0.030 0.025 0.020 0.015 0.010 0.005 0.000
0
100
150
360
560
0.12
Prey N. furca–1 h–1
B
LL-2
b
0.10
b b
0.08
b
0.06 a
0.04 0.02 0.00
0
18
33
66
100
0.07
C
b
0.06
ab
0.05 0.04
LL-3
b
a
a
0.03 0.02 0.01 0.00 Surface 3m
0 0
18 230
33 425
66 860
100 1300
Surface irradiance (%) Fig. 2. Neoceratium furca. Feeding response to different light levels in Chesapeake Bay. Water samples containing N. furca were collected from 3 different stations at (A) a depth of 4.5 m for LL-1, (B) the surface for LL-2, and (C) at the surface and 3 m for LL-3. Samples were wrapped in aluminum foil or 0 to 7 layers of screening to achieve various light levels. Feeding was determined over a 6 h period. Different letters indicate significant differences between means (p < 0.05)
the day (Diel-2) and in the high-light treatments of LL-7 were not significantly different from each other (0.022 ± 0.0019 vs. 0.024 ± 0.0035 prey N. furca−1 h−1, respectively; p = 0.708).
DISCUSSION Mixotrophy in laboratory cultures of Neoceratium furca (= Ceratium furca) is strongly influenced by nutrient concentrations, with feeding increasing drastically when cells become nutrient limited (Smalley et al. 2003). In the present study we document a similar effect of inorganic nutrients on field populations of N. furca. In nutrient addition assays, N. furca consistently showed a significant reduction in feeding when PO4 and NO3 were added together. The response was more complex when only 1 nutrient was added and varied across experiments. While 2 of the experiments revealed reduced feeding upon NO3 addition, feeding in the other experiment decreased upon PO4 addition. In Nutrient-2, the addition of PO4 actually led to increased feeding. Similar findings have been reported for the mixotrophic dinoflagellates Karlodinium veneficum (= Gyrodinium galatheanum) and Prorocentrum minimum (Stoecker et al. 1997, Li et al. 2000a). In nutrient addition assays using field populations, both dinoflagellates exhibited reduced feeding when N and P were added together but differed in their response to the addition of a single nutrient species. While ingestion rate of K. veneficum dropped upon the addition of N (Li et al. 2000a), feeding in P. minimum increased when N or P were added separately (Stoecker et al. 1997). In our experiments, the various response patterns may have been due to the differing ambient inorganic nutrient concentrations and ratios at the time of collection. In Nutrient-1 and -2, for instance, the low DIN and higher PO4 concentrations and the consequently low DIN:DIP ratios may have caused N limitation in Neoceratium furca. If N. furca employed phagotrophy as a means for obtaining nutrients when inorganic nutrient concentrations are low, Nlimited cells would have reacted to inorganic N addition by decreasing ingestion. In Nutrient-2, P-addition may have exacerbated N. furca’s need for N, thus potentially leading to increased feeding. Likewise, cells in Nutrient-3 may have been P-limited due to higher DIN and lower PO4 concentrations, resulting in a higher DIN:DIP ratio. Thus, the addition of PO4 would have alleviated the need for additional P-uptake through phagotrophy, resulting in reduced feeding rates. The importance of inorganic nutrient ratios rather than absolute concentrations in the regulation of feeding has been shown for several other mixotrophic dinoflagellates (Stoecker et al. 1997, Li et al. 2000a,b). Furthermore, cellular nutrient content and ratios may be more critical than inorganic nutrient concen-
Smalley et al.: Mixotrophy in Neoceratium furca
0.12
0.04
A
LL-4
0.10
B
b
LL-5
bc
b
0.03
ab ab
0.08 ac
0.06
9
a
ac
0.02
a 0.04
Prey N. furca–1 h–1
0.01
c c
0.02 0.00 0.020
0
66
100
200
340
0.10
C
LL-6
ab
0
6
18
38
100
D
130
LL-7
0.08
a
0.015
0.00
0.06 0.010 0.04 0.005
0.000
0.02
0
18
55
100
200
300
0.00
0
18
55
100
200
300
Surface irradiance (%) Fig. 3. Neoceratium furca. Feeding response to different light levels in Indian River Lagoon, Florida, USA. Surface water containing N. furca was collected on 4 different occasions (A−D). Samples were wrapped in aluminum foil or 0 to 7 layers of screening to achieve various light levels. Feeding was determined over a 6 h period. Different letters indicate significant differences between means (p < 0.05)
trations in regulating feeding behavior, especially when inorganic nutrient concentrations are changing rapidly (Smalley et al. 2003). In P-depleted laboratory cultures of Neoceratium furca (= Ceratium furca), feeding was induced above a cellular N:P ratio of 19, while N-depleted cultures required a cellular N:P ratio below 7 to commence feeding. These ratios correlate well with the inorganic N:P ratios observed during our field experiments, where DIN:DIP ratios around 7 (Nutrient-1 and -2) led to reduced feeding upon N addition, and a DIN:DIP ratio between 16.5 and 22 resulted in decreased feeding upon P addition. Therefore, while cellular nutrient ratios are a better indicator of a cell’s nutrient status, inorganic nutrient ratios may be an adequate substitute when the nutrient environment is relatively stable, as was the case here. In addition to the strong effect of nutrients, irradiance also significantly influenced feeding in field populations of Neoceratium furca. Ingestion of labeled prey was usually highest at or below an irra-
diance level comparable to that experienced by cells at time of collection. In 3 out of 7 experiments, feeding decreased significantly in the dark. This response has been reported for several other mixotrophic dinoflagellates, including Karlodinium veneficum, Prorocentrum minimum, and Fragilidium subglobosum (Skovgaard 1996, Hansen & Nielsen 1997, Stoecker et al. 1997, Li et al. 2000a). The response is typical of Type IIA mixotrophs, which are thought to feed in order to acquire limiting nutrients rather than C and thus decrease ingestion rates in the dark, when the need for N and P is reduced due to a lack of photosynthetic C uptake (Stoecker 1998). Alternatively, several other mechanisms could conceivably have caused decreased feeding in the dark, including decreases in predator/prey encounter rates due to decreased dinoflagellate swimming speeds (Kamykowski et al. 1988), a requirement for ATP from photosynthesis for optimal ingestion or digestion of prey (Skovgaard 1996), or light-aided digestion through photooxidation of prey remnants in food vacuoles
Aquat Microb Ecol ■ ■
10
1.2
A
LL-1 LL-2 LL-3 Surface LL-3, 3 m
1.0 0.8
Maximum feeding (%)
0.6 0.4 0.2 0.0
B
LL-4 LL-5 LL-6 LL-7
1.0 0.8 0.6 0.4 0.2 0.0 0
500
1000
1500
2000
2500
3000
3500
Irradiance (µmol photons m–2 s–1) Fig. 4. Neoceratium furca. Feeding vs. irradiance curves for N. furca from (A) Chesapeake Bay and (B) Indian River Lagoon, Florida, USA. Feeding is expressed as a percentage of the maximum ingestion rate
(Strom 2001). However, in 4 out of 7 experiments, N. furca failed to significantly reduce feeding in the dark, suggesting that any possible effect on swimming speed did not translate into a change in feeding rate and that light was not required for ingestion and/or digestion. On the occasions when feeding remained high in the dark, the demand for nutrients may not have been met while the cells were still exposed to light. This could have been the case when feeding was inhibited, for example due to high light. A total of 3 out of 4 experiments where feeding failed to decrease substantially in the dark instead exhibited a significant decrease of feeding at high irradiance levels. Such high levels may have directly inhibited feeding by damaging some of the components necessary for ingestion and/or digestion. Cells may have compensated for this reduction by increasing feeding in low light and the dark. Nutrient demand may also have remained high in the dark if C assimilated in
the light was used for synthesis of nucleic acids and proteins in the dark. Alternatively, if the photosynthetic performance of Neoceratium furca was reduced by photoinhibition at high irradiance, cells may have continued to feed in the dark to supplement C along with nutrients. However, while feeding in the dark was sometimes as high as that exhibited at low to moderate light levels, in none of our experiments did Neoceratium furca show an increase of feeding in complete darkness. Such an increase would be expected if N. furca used feeding mainly as a means for obtaining C, as is the case for Type IIC mixotrophs. Therefore, while a minor role for phagotrophic C in feeding regulation cannot be excluded, feeding in N. furca is primarily influenced by nutrients (Type IIA mixotrophy). This does not mean, however, that N. furca will not utilize ingested C to supplement its nutrition and/or photosynthesis. Another Type IIA mixotroph, Karlodinium veneficum (= Karlodinium micrum), assimilated prey C during mixotrophic growth, with protein being the major net assimilation product (Adolf et al. 2006). Photosynthetic performance was reduced, as mixotrophy caused a shift toward a more heterotrophic metabolism. For N. furca, the relative contributions of autotrophic and heterotrophic C metabolism to mixotrophic growth are not known, and additional research is needed to determine the fate of ingested prey C and nutrients. While feeding responses to various light levels usually followed the same general pattern, the absolute irradiance levels at which feeding peaked and then started to decrease varied among experiments. This suggests that the light history and acclimative state of a cell may be instrumental in determining the shape of the feeding vs. irradiance curve, as is the case for photosynthesis. Cells acclimated to a lower light environment than that found at the surface may show inhibition of feeding at much lower irradiance levels than cells that are acclimated to high light. Neoceratium furca is capable of diel vertical migration, aggregating near the surface during the day and descending to greater depths in late afternoon or at night (Weiler & Karl 1979, Heaney & Eppley 1981, Kamykowski 1981). In the water column, cells are thus able to regulate light exposure to some degree by positioning themselves at a depth with irradiance levels that are optimal for growth given the cell’s acclimative state. As this was not possible in our bottle experiments, photoinhibition may have occurred much more readily. Further research is needed to understand the connections between acclimative state, photosynthesis, and phagotrophy.
Smalley et al.: Mixotrophy in Neoceratium furca
11
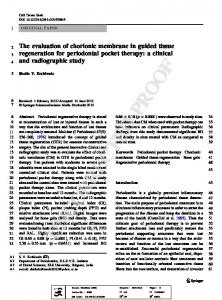
Time of day also influenced phagotrophy in Neoceratium furca, which exhibited distinct diel fluctuations in feeding. Diel patterns have been observed for other mixotrophic dinoflagellates as well. While food vacuoles in Akashiwo sanguinea (= Gymnodinium sanguineum) were most frequent in the afternoon and early evening (Bockstahler 1992), feeding in Prorocentrum minimum peaked during the night (Stoecker et al. 1997). Both of these patterns were exhibited by N. furca. Feeding increased during the day in 1 experiment but was higher at night in the other. However, phased cell division in both experiments occurred in the morning. If division frequency was high enough, division could result in dilution of food vacuoles and thus an apparent decrease in feeding. In addition, cells preparing for division or those already dividing may not be able to ingest prey. However, dilution of Fig. 5. Neoceratium furca. Diel pattern in feeding rate. Samples were collected from (A) Chesapeake Bay (Diel-1) and (B) Indian River Lagoon (Dielfood vacuoles per cell in Diel-2 could 2), and ingestion rate was measured every 3 h. The thin black horizontal line have accounted for at most 16% of the represents the average ingestion rate over the course of the experiment. observed decrease on the first day and Black bars indicate night 10% on the second day, while feeding in Diel-1 actually increased as division frequency peaked. Thus, cell division seemed to have played little or no role in determining the observed diel feeding rhythm and was unable to explain the conflicting patterns found in the 2 experiments. The diel feeding patterns observed in our experiments may simply be a direct response to the changing light environment over the course of the day. Feeding rates of Neoceratium furca during the day in both diel experiments were similar to those observed in the high light treatments of the corresponding light-level experiments (LL-2 and LL-7). Likewise, feeding at night was no different from ingestion rates in the dark treatments of the light-level experiments. The conflicting patterns could thus be explained by the differences in light regime and intensity between Chesapeake Bay (Diel-1) and Indian River Lagoon (Diel-2). Feeding in Diel-1 may have been higher dur-
Fig. 6. Neoceratium furca. Diel pattern in cell division frequency. Samples were collected from (A) Chesapeake Bay (Diel-1) and (B) Indian River Lagoon (Diel-2), and division frequency was determined every 3 h (missing columns represent 0 division frequency at that time). Black bars indicate night
Aquat Microb Ecol ■ ■
12
ing the day to meet the need for additional nutrients created by increased photosynthetic C uptake, as discussed above for the light-level experiments. In Diel2, in contrast, photosynthesis and/or feeding may have been inhibited during the day, leading to increased feeding at night to make up for the loss. However, some inconsistencies still remain. For instance, feeding in Diel-1 on the second day increased before sunrise, while ingestion rates in Diel-2 decreased at the end of the night. Endogenous rhythms may thus play a role in feeding regulation as well, although they may be modified or overridden by environmental factors, such as nutrient concentrations and irradiance. Further research is necessary to investigate to what extent endogenous rhythms influence feeding in N. furca and how they interact with environmental factors, such as irradiance and nutrient levels. In the present study , we have shown that inorganic nutrient concentrations, irradiance, and time of day can all influence feeding in natural populations of Neoceratium furca. Our results confirm that feeding in N. furca is primarily a means for obtaining limiting nutrients rather than C. We thus propose the following conceptual model to explain the regulation of feeding in N. furca (Fig. 7). The model assumes that feeding is regulated by cellular C, N, and P pools and their relative concentrations. When cellular C:N:P ratios deviate significantly from those required for optimum growth, feeding is modified in an effort to balance the nutrient budget. In primarily phototrophic mixotrophs, such as N. furca, cellular C:N:P ratios are sensitive to changes in nutrient uptake rates and photosynthesis. Therefore, any physiological and/or environmental factor that influences these cellular processes (e.g. ambient nutrient concentraNutrient concentrations
Inorganic nutrient uptake
Photosynthesis
C
N P
Light
Prey availability
Phagotrophy
Light Fig. 7. Conceptual model of feeding regulation in Neoceratium furca (large ovoid). C, N, and P: intracellular C, N, and P pools. Cellular pools are maintained constant in relation to each other (i.e. constant C:N:P ratio). Arrows represent the influence of environmental factors and cellular processes on cellular C, N, and P pools. Dashed arrow: while prey C is ingested by N. furca, it does not seem to play a dominant role in feeding regulation
tions or irradiance) is expected to affect feeding as well. Nutrient limitation (either N or P) will thus lead to increased feeding due to an imbalance in the cellular C:N:P ratio. Both limiting and photoinhibitory irradiance levels cause a decrease in photosynthetic C fixation, leading to a reduced need for nutrients and thus downregulation of feeding. In contrast, feeding should remain high under light-limiting conditions if the demand for nutrients is not met while cells are still exposed to saturating light levels (e.g. when feeding and/or inorganic nutrient uptake mechanisms are damaged by high irradiance). While the model assumes that the need for C does not play a dominant role in feeding regulation, assimilated prey C will increase the cellular C content (dashed arrow in Fig. 7) and may thus lead to downregulation of photosynthesis, as shown for at least one other Type IIA mixotroph (Adolf et al. 2006). The model can easily be adapted to include other parameters if necessary, such as other growth factors and/or dissolved organic nutrients. It may be a useful tool to further investigate the physiology of mixotrophy and its benefits and costs as well as the role that mixotrophs play in food web trophodynamics. Acknowledgements. We thank the captain and crew of the RV ‘Cape Henlopen’ for ship operations and on-deck assistance. We are grateful for the technical assistance of E. J. Adam, M. R. Goodison, and S. K. Cooney. The comments and suggestions of several anonymous reviewers greatly improved the manuscript. This research was supported by NSF grant OCE 931772 awarded to D.W.C. and D.K.S., OCE 9819670 to D.K.S., and OCE 9730695 to D.W.C. G.W.S. was supported by a Smithsonian Environmental Research Center Internship and Graduate Fellowship, a Horn Point Graduate Research Assistantship, and a Rider University Summer Research Fellowship.
LITERATURE CITED Adolf JE, Stoecker DK, Harding LW (2006) The balance of autotrophy and heterotrophy during mixotrophic growth of Karlodinium micrum. J Plankton Res 28:737−751 Biecheler B (1936) Des conditions et du mécanisme de la predation chez un dinoflagellé a envelope tabulée, Peridinium gargantua, n. sp. C Pr Séanc. Soc Biol 121: 1054−1057 Biecheler B (1952) Recherches sur les péridiniens. Bull Biol Fr Belg 36:1−149 Bockstahler KR (1992) Abundance, distribution, and grazing rates of mixotrophic dinoflagellates in Chesapeake Bay. MS Thesis, University of Maryland, College Park, MD Bockstahler KR, Coats DW (1993) Spatial and temporal aspects of mixotrophy in Chesapeake Bay dinoflagellates. J Protozool 40:49−60 Burkholder JM, Glibert PM, Skelton HM (2008) Mixotrophy, a major mode of nutrition for harmful algal species in eutrophic waters. Harmful Algae 8:77−93
Smalley et al.: Mixotrophy in Neoceratium furca
13
Coats DW, Heinbokel JF (1982) A study of reproduction and other life cycle phenomena in planktonic protists using an acridine orange fluorescence technique. Mar Biol 67: 71−79 Guillard RRL, Ryther JH (1962) Studies on marine planktonic diatoms. I. Cyclotella nana Hustedt and Detonula confervacea (Cleve) Gran. Can J Microbiol 8:229−239 Hansen PJ, Nielsen TG (1997) Mixotrophic feeding of Fragilidium subglobosum (Dinophyceae) on three species of Ceratium: effects of prey concentration, prey species and light intensity. Mar Ecol Prog Ser 147:187−196 Heaney SI, Eppley RW (1981) Light, temperature and nitrogen as interacting factors affecting diel vertical migrations of dinoflagellates in culture. J Plankton Res 3: 331−344 Heinbokel JF (1988) Reproductive rates and periodicities of oceanic tintinnine ciliates. Mar Ecol Prog Ser 47:239−248 Hofeneder H (1930) Über die animalische Ernährung von Ceratium hirundinella O. F. Müller und über die Rolle des Kernes bei dieser Zellfunktion. Arch Protistenkd 71:1−32 Jakobsen KK, Hansen PJ, Larsen J (2000) Growth and grazing responses of two chloroplast-retaining dinoflagellates: effect of irradiance and prey species. Mar Ecol Prog Ser 201:121−128 Jeong HJ, Yoo YD, Kim JS, Seong KA, Kang NS, Kim TH (2010) Growth, feeding and ecological roles of mixotrophic and heterotrophic dinoflagellates in marine planktonic food webs. Ocean Sci J 45:65−91 Jones HLJ (1997) A classification of mixotrophic protists based on their behavior. Freshw Biol 37:35−43 Jones RI (1994) Mixotrophy in planktonic protists as a spectrum of nutritional strategies. Mar Microb Food Webs 8: 87−96 Kamykowski D (1981) Laboratory experiments on the diurnal vertical migration of marine dinoflagellates through temperature gradients. Mar Biol 62:57−64 Kamykowski D, McCollum SA, Kirkpatrick GJ (1988) Observations and a model concerning the translational velocity of a photosynthetic marine dinoflagellate under variable environmental conditions. Limnol Oceanogr 33:66−78 Kim S, Kang YG, Kim HS, Yih W, Coats DW, Park MG (2008) Growth and grazing response of the mixotrophic dinoflagellate Dinophysis acuminata as functions of light intensity and prey concentration. Aquat Microb Ecol 51: 301−310 Larsen J (1988) An ultrastructural study of Amphidinium poecilochroum (Dinophyceae), a phagotrophic dinoflagellate feeding on small species of cryptophytes. Phycologia 27:366−377 Lewitus AJ, Glasgow HG, Burkholder JM (1999) Kleptoplastidy in the toxic dinoflagellate Pfiesteria piscicida (Dinophyceae). J Phycol 35:303−312 Li A, Stoecker DK, Coats DW, Adam EJ (1996) Ingestion of fluorescently labeled and phycoerythrin-containing prey by mixotrophic dinoflagellates. Aquat Microb Ecol 10: 139−147
Li A, Adolf JE, Stoecker DK (1999) Feeding, pigmentation, photosynthesis and growth of the mixotrophic dinoflagellate Gyrodinium galatheanum. Aquat Microb Ecol 19: 163−176 Li A, Stoecker DK, Coats DW (2000a) Mixotrophy in Gyrodinium galatheanum (Dinophyceae): responses to light intensity and inorganic nutrients. J Phycol 36:33−45 Li A, Stoecker DK, Coats DW (2000b) Spatial and temporal aspects of Gyrodinium galatheanum in Chesapeake Bay: distribution and mixotrophy. J Plankton Res 22: 2105−2124 Nygaard K, Tobiesen A (1993) Bacterivory in algae: a survival strategy during nutrient limitation. Limnol Oceanogr 38:273−279 Putt M (1990) Abundance, chlorophyll content and photosynthetic rates of ciliates in the Nordic Seas during summer. Deep-Sea Res A 37:1713−1731 Sanders RW (1991) Mixotrophic protists in marine and freshwater ecosystems. J Protozool 38:76−81 Skovgaard A (1996) Mixotrophy in Fragilidium subglobosum (Dinophyceae): growth and grazing responses as functions of light intensity. Mar Ecol Prog Ser 143: 247−253 Skovgaard A (1998) Role of chloroplast retention in a marine dinoflagellate. Aquat Microb Ecol 15:293−301 Smalley GW, Coats DW (2002) Ecology of the red-tide dinoflagellate Ceratium furca: distribution, mixotrophy, and grazing impact on ciliate populations of Chesapeake Bay. J Eukaryot Microbiol 49:63−73 Smalley GW, Coats DW, Adam EJ (1999) A new method using fluorescent microspheres to determine grazing on ciliates by the mixotrophic dinoflagellate Ceratium furca. Aquat Microb Ecol 17:167−179 Smalley GW, Coats DW, Stoecker DK (2003) Feeding in the mixotrophic dinoflagellate Ceratium furca is influenced by intracellular nutrient concentrations. Mar Ecol Prog Ser 262:137−151 Stoecker DK (1998) Conceptual models of mixotrophy in planktonic protists and some ecological and evolutionary implications. Eur J Protistol 34:281−290 Stoecker DK, Li A, Coats DW, Gustafson DE, Nannen MK (1997) Mixotrophy in the dinoflagellate Prorocentrum minimum. Mar Ecol Prog Ser 152:1−12 Stoecker DK, Johnson MD, de Vargas C, Not F (2009) Acquired phototrophy in aquatic protists. Aquat Microb Ecol 57:279−310 Strom SL (2001) Light-aided digestion, grazing and growth in herbivorous protists. Aquat Microb Ecol 23: 253−261 Weiler CS, Chisholm SW (1976) Phased cell division in natural populations of marine dinoflagellates from shipboard cultures. J Exp Mar Biol Ecol 25:239−247 Weiler CS, Karl DM (1979) Diel changes in phased-dividing cultures of Ceratium furca (Dinophyceae): nucleotide triphosphates, adenylate energy charge, cell carbon, and patterns of vertical migration. J Phycol 15:384−391
Editorial responsibility: Robert Sanders, Philadelphia, Pennsylvania, USA
Submitted: November 8, 2010; Accepted: September 13, 2012 Proofs received from author(s):