was to develop easy to use, accurate software for irrigation scheduling. ... compared favourably with values measured in field trials at. La Mercy, Mount ...
IRRICANE: A SIMPLE COMPUTERISED IRRIGATION SCHEDULING METHOD FOR SUGARCANE A SINGELS, AJ KENNEDY AND CN BEZUIDENHOUT South African Sugar Association Experiment Station, Private Bag X02, Mount Edgecombe, 4300
Methods
Abstract Acceptance of irrigation scheduling technology by sugarcane growers depends on its ease of use. The objective of this work was to develop easy to use, accurate software for irrigation scheduling. The IRRICANE procedure consists of three steps: (1) downloading weather data from an automatic weather station, (2) calculating reference sugarcane evaporation using the Pemm-Monteith equation and (3) calculating a daily soil water balance for each field. It takes into account the effect of irrigation system properties, soil properties and crop characteristics. The procedure can be executed automatically to provide irrigation recommendations for a specified forecast period. Calculated soil water content and light interception compared favourably with values measured in field trials at La Mercy, Mount Edgecombe and Pongola. The software has been made available to growers and extension officers for operations testing. Introduction Irrigated sugarcane production contributes significantly to regional economies in South Africa. Thirty per cent of the total sugarcane produced in South Africa each year is grown under full irrigation in the Mpumalanga and Northern KwaZulu-Natal regions (on approximately 20% of the total area under cane). A further 12% is produced under supplementary irrigation. Water is fast becoming a scarce commodity in South Afiica. Various users are competing for water, and each industry has to justify the use of water and show that it is being used effectively. Implementation of the new Water Act will result in water becoming less abundant and more expensive. It is therefore more important than ever to optimise the use of irrigation water in the South African sugar industry. This can only be achieved by providing descision makers with the appropriate information on which to base water management. Scheduling of irrigation is an integral part of optimal management. Adoption of weather based computerised irrigation scheduling methods in the sugar industry through models such as PUTU (De Jager, 1998) and SWB (Annandale et al., 1996) is limited. This is because growers perceive these methods as too complicated and time consuming to learn and operate. Computerised weather based scheduling methods should be accurate and easy to use, with the minimum of user interaction. The objective of this work was to develop a simple, computerised, weather based irrigation scheduling procedure for sugarcane, and to test its accuracy. ,
Proc S Afr Sug Technol Ass (1998) 72
Description ofprocedure
The procedure consists of three steps, namely downloading weather data, calculating reference cane evaporation and calculating the water balance of individual fields. The three steps are executed automatically using the schedule function in the TCOM software (Cambell Scientific Inc, Logan, Utah) to run a DOS based batch command. This command sequentially executes two programs, namely AWSl and IRRICANE. The AWSl program calculates reference cane evaporation (Ecref) according to the method of McGlinchey et al. (1995) from the downloaded weather data, and outputs a daily weather data file. The IRRICANE program calculates the water balance using information contained in the daily weather data file, a field file and an irrigation file: Weather data file. Daily global incoming radiation; dry bulb temperature at 8:00 and 14:OO; wet bulb temperature or humidity at 8:00 and 14:OO; mean wind speed; daily rainfall. Fieldfile. Total available water; lower and upper limits of the target soil water content range; crop start and harvest dates; starting soil water content; irrigation system type. IrrigationJle. Dates and amounts of irrigation applied.
The program generates files containing daily values of water balance components, irrigation advice for the coming week, and current and future yield estimates. The software can be operated using a friendly Windows based user interface or DOS. Setup procedure and operational use are fully described in a user's manual (Singels and Kennedy, 1998). A water balance is maintained for a single layered soil profile. Calculation of the different components of the water balance will now be described. Effective irrigation is calculated by decreasing applied irrigation by the amount intercepted by the crop. Interception of irrigation is calculated for overhead irrigation systems as the lesser of actual irrigation and potential interception. Potential interception is calculated as the product of fractional canopy cover and 5 mm. Interception of rainfall is calculated as the least of actual rainfall and potential interception. Daily interception of irrigation and rainfall is not allowed to exceed reference cane evaporation. Contribution of water from a water table to the rooting zone is not taken into account at this stage of program development.
117
IRRICANE: a simple computerised irrigation scheduling method
A Singels, AJ Kennedy & CN Bezuidenhout
Table 1. Properties of weather stations used to simulate light interception under 'no stress' conditions.
Drainage is calculated by assuming a drainage rate of 40% per day of the surplus water above total available water (Taw). Runoff is simulated as excess water above the saturated available water content, which is assumed to be 200% of Taw.
Site
Tenbosch
Pongola
Mtubatuba
Duration
1968-1994
1967-1996
1967-1991
Evaporation (E) is calculated as follows:
Altitude (m)
179
308
46
Latitude (OS)
25,33
27,40
28,26
Longitude ("E)
31,90
31,58
32,18
E=Ev+Es Ev = Kv * Ecref K v = F i * Fv Es = Ks * Ecref Ks = Fs * (l-Fi) where subscripts v and s denote vegetation and soil respectively, K is a zero to unity coefficient, Fi is fractional canopy cover, Fv is a relative water stress index, Fs is relative soil surface wetness index. An evaporation pool is maintained by adding all effective irrigation and rainfall and subtracting evaporation. Es is not allowed to exceed the size of the evaporation pool. Fv is a water stress index having a value of one when there is no water stress and a nil value when the crop is fully stressed. When available soil water content is above 50% of Taw then Fv=l. Fv decreases linearly with decreasing available soil water content below this level. Fs is calculated as a function of days elapsed since a wetting event (T): Fs = exp (-0,4
* T)
[from De Jager et al., 19871 ( 6 )
Fs is weighted by the unit area wetted during an event. This depends on whether wetting took place through irrigation or rainfall and also on the type of irrigation. Relative canopy cover (Fi) is calculated using a logistic equation of days after emergence (Dae): Fi = 1/(1 + exp (-PI * (Dae - P2)))
(7)
where P1 is the time from emergence to 50% canopy cover and PZ is a parameter which determines the shape of the equation. Parameters P, and PZ are calculated using a third order Fourier function (Mathews, 1987):
The irrigation schedule is determined by comparing soil water content (Swc) with the lower and upper levels of the specified target Swc range. The lower level of that range (Ltl) is the soil water content to which the crop is allowed-to extract water. The upper level is the soil water content to which the profile will be filled with irrigation (Utl). The timing and net amount of irrigation required (Irr) are determined by the value of Swc in relation to these parameters: Fid = (Swc - Ltl) 1 Etave Irr
=Vtl-
Swc)
(9) (10)
where Fid is the estimated number of days to the next irrigation, and Etave is the average daily E of the previous seven days. When Swc drops to Ltl the required net irrigation is calculated as the difference between Utl and Swc. Testingfor accuracy
Simulated values of Fi and Swc were compared against measured values obtained from field trials at La Mercy, Mount Edgecombe and Pongola. Experiment details are given in Table 2. At the La Mercy site five irrigation treatments were applied. Only three are considered here: Treatment I . Apply irrigation when soil water deficit calculated from long term average crop water use reaches the specified level. Treatment 3. Apply irrigation when CANEGRO growth stress factor drops below 1. Treatment 5. No irrigation.
The specified level of extraction was 45 mm in the plant crop and 25 mm for the ratoon crops. Five replicate plots of 8 X 10 m each were used.
where f(x) is either parameter PI or P2 and Doy is day of the year, while a. to q and b, to b3 are coefficients determined through a least squares fit to data obtained from CANEGRO (Inman-Bamber, 1991) simulations. Simulations for water stress free 12 month crops starting each month of the year were carried out for three sites in the irrigated areas, namely Tenbosch, Pongola and Mtubatuba. Details of weather data input are given in Table 1.
Two treatments were applied at Mount Edgecombe. Treatment 1, the only treatment considered here, was irrigated when soil water deficit calculated from long term average crop water use reached 25 mm. Three replicate plots of 8 X 10 m each were used. At La Mercy and Mount Edgecombe soil water content was measured every three weeks with a neutron water meter (CPN, Pacheco, CA, USA). Measurements were made at 0,15 m intervals up to a depth of 1,2 m. Measured Swc for each treatment was averaged over replications and depths.
Proc S Afr Sug Technol Ass (1 998) 72
IRRICANE: a simple computerised irrigation scheduling method
A Singels, AJ Kennedy & CN Bezuidenhout
Table 2. Experimental details of field trials at three sites in the South African sugar industry. Site
La Mercy
Mount Edgecombe
Pongola
LOCATION Altitude (m)
50
96
308
Latitude (OS)
29,5
29,7
27,4
Longitude ("E)
3 1,06
31,02
31,3
SOIL Soil form l Soil family
Swartland / Gemvale
Arcadia / Lonehill
Hutton l Hayfield
Max rooting depth (m)
1,65
2,05
3,45
Total available water (mm per 1,2 m)
117
210
120
12.03.97
CROP Planting date
08.09.94
10.11.95
Harvest date (plant crop)
08.1 1.95
18.11.96
Harvest date (ratoon 1)
07.1 1.97
Harvest date (ratoon 2)
10.11.97
Variety
NCo376
NCo376
NCo376
Swc, Fi, hourly weather
Swc, Fi, daily weather
Fi, daily weather
Measurements
Fractional photosynthetic active radiation (Par) interception was measured fortnightly using a ceptometer (Decagon Devices Inc). Ten readings per plot were carried out. It was assumed that fractional canopy cover equaled fractional Par interception. The mean relative absolute difference (Mrad) between simulated (Y)and actual (X) soil water content was calculated to quantify model accuracy:
Results Canopy cover
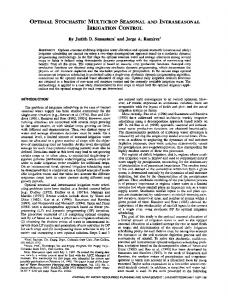
Table 3 provides the values of parameters P, and P2 as determined by a best fit to simulated data. The r2 for all fits was greater than 0,99. Simulated canopy cover and measured values are compared in Figure 1. IRFUCANE simulates higher canopy cover than CANEGRO. This is because equation 7 is based on long term temperature in the warmer northern regions where irrigation is practiced. IRRICANE simulated canopy cover generally compared favorably with measured values. Soil water content
In Figures 2 and 3 (La Mercy and Mount Edgecombe respectively), soil water content simulations are compared
Proc S Afr Sug TechnoI Ass (1998) 72
with measurements. IRRICANE simulations were very similar to CANEGRO simulations. Notable differences were higher rates of water extraction by CANEGRO at low soil water contents. CANEGRO had a complicated procedure for simulating water stress, whereas IRRICANE simulated stress when 50% of Taw had been depleted. CANEGRO took into account rooting density, root distribution, water content and atmospheric demand. Simulations compared reasonably well with measured values at relative high water contents. Both IRRICANE and CANEGRO performed poorly at low soil water contents (rainfed treatment No. 5 at La Mercy). There is reason to believe that a perched water table may have contributed to the water balance of the top 1,2 m of the profile. Table 3. Fourier coefficients (equation 8) for determining the parameter P, and P2of equation 7. Coefficient
PI
A0
0,1022461
159,4570000
A1
0,0097405
-27,1167742
B1
-0,0090422
A2
0,0043730
B2
0,0016785
A3 B3
-0,0006961 0,0019305
PZ
12,1841576 1,2927954 -9,0936436 1,7572995 1,9580743
IRRICANE: a simple computerised irrigation scheduling method
A Singels, AJ Kennedy & CN Bezuidenhout
La Mercy 1996-1997
La Mercy 1994-1995
TREATMENT 2 1.2
I
TREATMENT 1
36
20 0
20
40
60
80
100
120
140
160
180
200
,=l
b
18 0
Days after emergence
50
100
150
200
250
300
lnicane 350
400
Days after plant
Mt. Edgecornbe 1996
La Mercy 1994-1995 TREATMENT 5
1
2
1
.
36
I -Days after emergence
0
50
100
150
200
lmcane
250
I
300
I 350
400
Days after plant
Pongola 1997 La Mercy 1995-1996
1.2
36
TREATMENT 1
,
I
22
0
50
100
150
200
lnicane
250
Days after emergence
18
7
0
50
100
150
200
.
250
Days after emergence
Figure l.Measured and simulated fractional light interception at three sites in the South African sugar industry.
Figure 2. Continued on next page ...
Proc S Afi Sug Technol Ass (1998) 72
A Singels, AJ Kennedy & CN Bezuidenhout
IRRICANE: a simple computerised irrigation scheduling method
Mt. Edgecombe 1996-1 997
La Mercy 1995-1 996
TREATMENT 1
TREATMENT 5 50
0
50
100
150
200
250
Days after emergence
Days after emergence La Mercy 1996-1997
Figure 3. Simulated and measured soil water content of the top 1,2 m of the soil profile at Mount Edgecombe.
TREATMENT l 36
22 Canegro 20
-
l8
7
0
lrricane
50
100
150
200
250
300
Days after emergence La
Mercy
Table 4 provides information on the statistical evaluation of soil water content (Swc) estimates. The Mrad for IRRICANE under high Swc (e.g. under typical irrigated conditions) ranged from 3 to 6% of the soil water content. For a soil with a Taw of 100 mm this meant a mean error of 3 to 6 mm - a typical crop water use for one day. The error for CANEGRO is similar. Taking into account other inaccuracies associated with irrigation management, the magnitude of Swc simulation error should be acceptable to irrigation managers. The large error for both models at low Swc is alarming. As stated previously, this could be due to faulty simulation of water use under stress conditions andlor the presence of a water table at La Mercy.
1996-1 997
Table 4. Statistical evaluation of soil water simulation.
TREATMENT 5
Mrad (% of water content) Trial CANEGRO
IRRICANE
5,s
5,7
La Mercy
treatment 1
La Mercy
treatment 3
6,3
5,s
La Mercy
treatment 5
11,3
11,s
M t Edgecornbe
treatment 1
22
3,O
Conclusions A
Measured
1
Days after emergence
Figure 2. Simulated and measured water content in the top 1.2 m of the soil profile, for treatments No. 1 and 5, over three crop cycles, at La Mercy.
Proc S Afr Sug Technol Ass (1998) 72
Irrigation scheduling software was developed that is easy to use with the minimum of user interaction after the intial setup. Although simple, it produced results similar to the CANEGRO simulation model. Mean soil water content for a 1,2 m irrigated profile was predicted to within 3 to 6 mm. The procedure should promote the efficient use of limited and expensive irrigation water in the South African sugar industry.
IRRICANE: a simple computerised irrigation scheduling method Acknowledgements The authors acknowledge the excellent effort of former employees of SASEX, Dr NG Inrnan-Bamber and Mr MG McGlinchey, who designed and carried out the field trials and also developed some of the algorithms included in the software, and SASEX extension staff who highlighted the need for simple software in the industry. Thanks are due to the technical staff of the Agronomy Department of SASEX for their hard work, and particularly to George Kanniappen who performed the field work in an excellent manner.
REFERENCES Annandale, JG, van der Westhuizen, AJ and Olivier, FC (1996). Die fasilitering van tegnologie-oordrag deur verbeterde besproeiingsriglyne vir groente en 'n meganistiese gewasmodelleringsbenadering. Report to the Water Research Commission, WRC Report No 47611196.
A Singels, AJ Kennedy & CN Bezuidenhout
De Jager, JM (1998). Research on a computerized weather-based water management system. Report to the Water Research Commission, WRC Report No 58 1/1/98. De Jager, JM, Van Zyl, WH, Kelbe, BE and Singels, A (1987). Research on a weather service for scheduling the irrigation of winter wheat in the OFS. Report to the Water Research Commission, WRC Report No 117/1/87. Inman-Bamber, NG (1991). A growth model for sugarcane based on a simple carbon balance and the CERES-Maize water balance. S Afr J Plant Soil 8: 96-99. Mathews, JH (1987). Numerical Methods for Computer Science, engineer in^ and Mathematics. Prentice-Hall International ~ditions. McGlinchey, MG, Inman-Bamber, NG, Culvenvell, TL and EIS, M (1995). An irrigation scheduling method based on a crop model and an automatic weather station. Proc S Afr Sug Technol Ass 69: 69-73. singels, A and ~ ~ AJ (1998). ~ IRRICANE: ~ ~ ~ d ~ Scheduling Software for Sugarcane. User's Manual, published February 1998 by the South African Sugar Association Experiment Station, Mount Edgecombe, South Africa.
Proc S Afr Sug Technol Ass (1998) 72
~
~ ,