Geol. výzk. Mor. Slez., Brno 2011/1
Brand new Geochemical Data Toolkit (GCDkit 3.0) – is it worth upgrading and browsing documentation? (Yes!) Vojtěch Janoušek1,2, Colin M. Farrow3, Vojtěch Erban1, Jakub Trubač1
Czech Geological Survey, Klárov 3, 118 21 Prague 1, Czech Republic; e-mail:
[email protected] Institute of Petrology and Structural Geology, Charles University in Prague, Albertov 6, 128 43 Prague 2, Czech Republic 3 Computing Service, University of Glasgow, Glasgow G12 8QQ, Scotland
1
2
Key words: igneous rocks, geochemistry, graphics, software, Windows Abstract The freeware Geochemical Data Toolkit (www.gcdkit.org) is a flexible R-language package designed for handling, recalculation and plotting of whole-rock geochemical data from igneous and metamorphic rocks. The current version, GCDkit 3.0, was released in September 2011 and developed in the brand new R 2.13.0 for Windows. The release addresses some stability issues and improves the appearance of the plots. Apart from several new diagrams and plugins, it brings principal conceptual changes. The first is the internationalization – it introduces dictionaries, serving for the translation of classification diagrams. Czech and French localizations are provided as an example. Moreover, the system enables editing plates of multiple plots, in a manner previously available only for some of the stand-alone plots. Lastly, most of the commands can be invoked in batch mode, thus further speeding up otherwise tedious processing of large data files. Meskimen’s Law: There’s never time to do it right, but there’s always time to do it over.
GCDkit – an overview of the existing system The GeoChemical Data toolkit, or in short GCDkit, is a comprehensive software package released some eight years ago to meet the growing demand for a potent tool capable of efficient handling, recalculation and plotting of whole-rock geochemical data from crystalline rocks (Erban et al. 2003; Janoušek et al. 2003, 2005, 2006). In its development, we have opted for the Windows version of the freeware R language (http://www.r-project.org), which in itself provides a rich environment for data analysis, graphics and software development. The GCDkit is thus a R-package tailored to meet specific needs of igneous geochemist, with the immense wealth of generic R functions within the easy reach. The GCDkit not only offers a graphical user interface front-end to the (fraction of) powerful statistical and graphical functions built in R, but also provides a number of specialized tools designed specifically for igneous geochemistry. Available are core routines for effortless import, modification, searching, subsetting, classification, plotting and output of the geochemical data. Thanks to the RODBC package (Ripley – Lapsley 2010), it is possible to directly import from Excel, Access and DBF files, as well as the data formats used by the geochemical packages such as NewPet (Clarke et al. 1994), IgPet (Carr 1995), MinPet (Richard 1995) and PetroGraph (Petrelli et al. 2005). Moreover, imported can be the data from popular WWW-based databases such as GEOROC (http://georoc.mpch-mainz.gwdg. de/georoc) and PETDB (http://www.petdb.org). The GCDkit comes with a wealth of built-in publication quality plots that can be exported into a number of data formats (including PostScript, PDF, WMF, JPG, PNG and BMP). The available graphs include user-defined binary, ternary and multiple binary diagrams (such as Harker
26
plots), spiderplots as well as a wide palette of classification and geotectonic discrimination diagrams. Most of the plots are defined as templates for Figaro – a set of graphical utilities for R, developed by C. Farrow and implemented in GCDkit. Figaro provides a means to create figure objects, which contain both the data and methods to make subsequent changes to the plot. So, for example, the title or its colour can be altered and any changes are automatically made visible. Figaro objects currently permit zooming and scaling of the diagrams, editing of the text, font, size and colour of the main title, secondary title and axis labels; colour, size and symbol for the data points; colour, type and width of the lines. Thus Figaro provides a degree of interactive editing before committing to hardcopy. Thanks to this approach, new diagram templates can be added in a rather simple way. The templates can be used also as a basis for classification. The general classification algorithm, based on the R package sp (Pebesma et al. 2011) looks for the name of the polygon within the diagram, into which the rock analysis falls according to its x–y coordinates. Moreover, GCDkit comes with tools for identification of data points on binary/ternary plots and spiderplots. There is a function for interactive labelling of individual analyses (typically by sample names but other labels can be specified). The system is easy to expand by means of the socalled plugins that provide a simple method of adding effortlessly new items to the menus of GCDkit. Exactly three years elapsed since the last version (2.3) of GCDkit for R 2.7.0 has been released. Meanwhile, Windows Vista and then Windows 7 became widespread, and R reached version 2.13, bringing about some stability issues and thus also necessary amendments. The new GCDkit 3.0, released in September 2011, not only tackles
The Open Congress ČGS and SGS, September 22–25, 2011, Monínec
Geol. výzk. Mor. Slez., Brno 2011/1
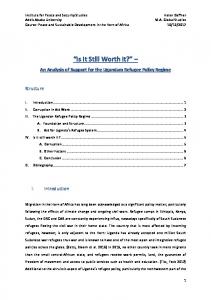
Fig. 1: Examples of diagrams newly introduced by GCDkit 3.0. a – Ternary plot Na2O–Al2O3–K2O (mol. %); b – Ternary diagram Hf–Rb/30–Ta×3, serving for classification of collisional granites (after Harris et al. 1986); c – Double normalized spiderplot [by NMORB composition after Sun – McDonough (1989) and then adjusted so that the normalized Lu contents equal unity].
these problems, but also introduces a number of new fea- from calc-alkaline and peraluminous suites on the basis tures, some indeed revolutionary, as summarized bellow. of the diagram after Sylvester (1989). Ternary plot Hf– Rb/30–Ta×3, proposed by Harris et al. (1986), serves for Added functionality in the new release classification of collisional granites (fig. 1b). Like in the previous releases, several new graphs Function spider2norm produces double normalized have been implemented. For instance, the ternary plot of spider plots (fig. 1c). Their aim is to eliminate effects of Na2O–Al2O3–K2O (mol. %) can support an assessment fractional crystallization, looking solely on the source of the balance of alumina and the two alkali oxides (fig. characteristics (Thompson et al. 1983; Pearce et al. 2005; 1a). Modern and robust multivariate diagrams based on Pearce – Stern 2006). This double normalization is also major- and minor-element oxides (Verma et al. 2006) or newly implemented in spider boxplots. Moreover, spidertrace elements (Agrawal et al. 2008) facilitate the determi- plots have a more sophisticated appearance, as they allow a nation of geotectonic setting for (ultra-) basic rocks. The choice of several styles of labelling x axis (e. g., rotated and/ collision-related alkaline granites can be distinguished or offset labels) and extra tick marks on the y axis (fig. 1c). The Open Congress ČGS and SGS, September 22–25, 2011, Monínec
27
Geol. výzk. Mor. Slez., Brno 2011/1
Of interest to granite geochemists may be the brand new plugin implementing the thermometer of Jung – Pfänder (2007). As shown by Sylvester (1998), the Al2O3/TiO2 ratio in the granitic magmas increases with the rising temperature of the crustal anatexis, reflecting most likely the decreasing stability of Ti-bearing phases. Jung – Pfänder (2007) compiled the available experimental data and defined a set of regression formulae for several types of protoliths. Wedge diagrams and concentration ratio plots (Ague 1994) became an integral part of the isocon.r plugin in order to expand the range of tools available for assessing mass balance during open-system processes such as metasomatism, partial melting, migmatization or metamorphism. In the statistics, arguably the most useful additions represent the function for printing ranges of selected
geochemical parameters in individual groups of samples (summaryRangesbyGroup) and the so-called strip boxplots – i. e. stripplots of selected parameter for individual data groups, each underlain by a boxplot. Optionally also a second variable can be portrayed by variable size of the plotted circles. Brand new concepts and future development More importantly, GCDkit 3.0 brings several new concepts. Firstly, the so-called plates, i. e. collections of two or more stand-alone plots, have been introduced (fig. 2). In the previous versions the graphical output system behaved in two contrasting ways: there was a wide range of Figaro-based retouching tools for individual diagrams (editing, zooming, point identification etc.), whereas composite plots made of two or more diagrams were static,
Fig. 2: A user-defined plate featuring several classification diagrams. The data set represents ~ 4000 analyses of Andean arc-related igneous rocks from the GeoRoc database. 28
The Open Congress ČGS and SGS, September 22–25, 2011, Monínec
Geol. výzk. Mor. Slez., Brno 2011/1
virtually ‘dead’. These involved for instance Harker plots, or diagrams using the same Figaro template plotted repeatedly for each of the groups (“Multiple plots by groups” – function figMulti), defined e. g. according to the petrographic type. The plates are designed to overcome this weakness/ inconsistency. Of course, plates can be fully user-defined and comprise any mixture of Figaro-compatible plots, e. g., binary plots, ternary plots, classification diagrams or spiderplots. From the plate already plotted, a single plot can be selected by graphical cursor and subsequently edited in a manner previously available exclusively to stand-alone Figaro-compatible plots. Moreover, properties of the whole plate/all its diagrams can be changed simultaneously. For instance, the whole plate can be set to black and white, the font size of axis labels can be altered, scaling of the common axis on Harker plots, or the minima of all y axes of binary plots set to 0. The second issue addressed by the new version of GCDkit is internationalization. As the first step, available is a choice of several languages to label the classification plots (so far English, Czech and French only; e. g. figs 1–2) using built-in dictionaries that ensure that further languages can be introduced, quickly and efficiently. English remains the master language so the dictionary is actually built as a list of paired terms English – [further language]. The new version also enables persistent system options to be set, implementing an easy-to-use graphical user interface (GUI). The options are subsequently saved to a permanent configuration file. Last but least, GCDkit 3.0 has been redesigned so that most functions are not only accessible via pull-down menus, but can run fully in an interactive regime or even in a batch mode, without the potentially pestering dialogues. This means efficiency for repetitive recalculations/plotting tasks involving several distinct datasets, and a possibility for automation by external programs. The help pages
contain more examples that can run directly, illustrating the main concepts, and that also represent numerical recipes that can be incorporated into user-defined macros/ programs. The current release represents an important step ahead in our effort to separate the GCDkit functionality (algorithms) from the user dialogues (interface). Such a move should, in longer perspective, enable development of alternative interfaces, e. g., to the World Wide Web, large database systems or built using operation systemindependent languages such as Java or Tcl/Tk. Our aim is to release ultimately Linux and Macintosh versions of GCDkit and thus expand the number of its potential users. Conclusions The GCDkit 3.0 offers a number of new features and should fix the stability problems of the previous release. It is developed primarily for Windows Vista/7. We have decided to stop the support for Windows 95/98/ME and warn the users that on Windows 2000 and XP the system may become unstable, especially if many graphical windows or complex plates are being opened. The package can be downloaded from the new website at http://www.gcdkit.org. Acknowledgements We are indebted to a number of users, who provided invaluable feedback and motivation to their work. Special thanks go to Jean-François Moyen (Université Saint-Etienne, France) for French translation of the classification templates and all the enthusiasm without which GCDkit would hardly exist in its present form. We are grateful to the participants of the GCDkit workshop organized by Jean-François at his home institution for their patience in debugging the beta version. Petr Čoupek (Brno) has provided a helpful review. This contribution has been financed by the GAČR project 205/09/0540.
References Agrawal, S.– Guevara, M.– Verma, S. (2008): Tectonic discrimination of basic and ultrabasic volcanic rocks through log-transformed ratios of immobile trace elements. – International Geology Review, 50, 1057–1079. Ague, J. J. (1994): Mass transfer during Barrovian metamorphism of pelites, south–central Connecticut; I, Evidence for changes in composition and volume. – American Journal of Science, 294, 989–1057. Carr, M. (1995): IgPet for Windows. – Terra Softa, Somerset, New Jersey, U.S.A. Clarke, D. – Mengel, F. – Coish, R. A. – Kosinowski, M. H. F. (1994): NewPet for DOS, version 94.01.07. – Department of Earth Sciences, Memorial University of Newfoundland, Canada. Debon, F. – Le Fort, P. (1983): A chemical-mineralogical classification of common plutonic rocks and associations. – Transactions of the Royal Society of Edinburgh: Earth Sciences, 73, 135–149. Erban, V. – Janoušek, V. – Farrow, C. M . – Šmíd, J. (2003): Geochemical Data Toolkit (GCDkit): a key for magmatic geochemists to the treasury of data analysis, statistics and graphics in R. – Geolines, 16, 25–26. Harris, N. B. W. – Pearce, J. A . – Tindle, A. G. (1986): Geochemical characteristics of collision-zone magmatism. – In: Coward, M. P. – Ries, A. C. (eds): Collision Tectonics, 67–81, Geological Society Special Publications 19. London. Irvine, T. N.– Baragar, W. R. A. (1971): A guide to the chemical classification of the common volcanic rocks. – Canadian Journal of Earth Sciences, 8, 523–548. Janoušek, V. – Farrow, C. M . – Erban, V. (2003): GCDkit: new PC software for interpretation of whole-rock geochemical data from igneous rocks. – Geochimica et Cosmochimica Acta, 67, 186. Janoušek, V. – Farrow, C. M . – Erban, V. (2005): Calculations and plotting in igneous geochemistry: corvée abolished at last! [GCDkit 2.00 released]. – Mitteilungen der Österreichischen Mineralogischen Gesellschaft, 151, 54.
The Open Congress ČGS and SGS, September 22–25, 2011, Monínec
29
Geol. výzk. Mor. Slez., Brno 2011/1
Janoušek, V.– Farrow, C. M.– Erban, V. (2006): Interpretation of whole-rock geochemical data in igneous geochemistry: introducing Geochemical Data Toolkit (GCDkit). – Journal of Petrology, 47, 1255–1259. Jung, S. – Pfänder, J. A. (2007): Source composition and melting temperatures of orogenic granitoids: constraints from CaO/Na 2O, Al2O3/TiO2 and accessory mineral saturation thermometry.– European Journal of Mineralogy, 19, 859–870. Le Bas, M. J. – Le Maitre, R. W. – Streckeisen, A. – Zanettin, B. (1986): A chemical classification of volcanic rocks based on the total alkali-silica diagram. – Journal of Petrology, 27, 745–750. Pearce, J. A. – Stern, R. J. (2006): Origin of back-arc basin magmas: trace element and isotope perspectives. – In: Christie, D. M. – Fisher, C. R . – Lee, S.–M . – Givens, S. (eds): Back-Arc Spreading Systems: Geological, Biological, Chemical, and Physical Interactions. – Geophysical Monograph Series 166, 63–86, American Geophysical Union. Pearce, J. A. – Stern, R. J. – Bloomer, S. H. – Fryer, P. (2005): Geochemical mapping of the Mariana arc-basin system: implications for the nature and distribution of subduction components. – Geochemistry Geophysics Geosystems, 6, doi 10.1029/2004GC000895. Pebesma, E. – Bivand, R. et al. (2011): Sp, a package that provides classes and methods for spatial data, version 0.9-81. Accessed on May 13, 2011, at http://cran.r-project.org/. Peccerillo, A. – Taylor, S. R. (1976): Geochemistry of Eocene calc-alkaline volcanic rocks from the Kastamonu area, Northern Turkey. – Contributions to Mineralogy and Petrology, 58, 63–81. Petrelli, M. – Poli, G. – Perugini, D. – Peccerillo, A. (2005): PetroGraph: A new software to visualize, model, and present geochemical data in igneous petrology. – Geochemistry Geophysics Geosystems, 6, doi 10.1029/2005GC000932, 1–15. Richard, L. R. (1995): MinPet: Mineralogical and Petrological Data Processing System, version 2.02. – MinPet Geological Software, Québec, Canada. Ripley, B. – Lapsley M. (2010): RODBC, an ODBC database interface, version 1.3-2. Accessed on May 13, 2011, at http://cran.rproject.org/. Sun, S. S. – McDonough, W. F. (1989): Chemical and isotopic systematics of oceanic basalts: implications for mantle composition and processes. – In: Saunders, A. D. – Norry, M. J. (eds): Magmatism in Ocean Basins, 313–345, Geological Society Special Publications 42, London. Sylvester, P. J. (1989): Post-collisional alkaline granites. – Journal of Geology, 97, 261–280. Sylvester, P. J. (1998): Post-collisional strongly peraluminous granites. – Lithos, 45, 29–44. Thompson, R. N. – Morrison, M. A. – Dickin, A. P. – Hendry, G. L. (1983): Continental flood basalts... Arachnids rule OK? – In: Hawkesworth, C. J . – Norry, M. J. (eds): Continental Basalts and Mantle Xenoliths, 158–185, Shiva. Nantwich. Verma, S. P. – Guevara, M. – Agrawal, S. (2006): Discriminating four tectonic settings: five new geochemical diagrams for basic and ultrabasic volcanic rocks based on log-ratio transformation of major-element data. – Journal of Earth System Scien ce, 115, 485–528.
30
The Open Congress ČGS and SGS, September 22–25, 2011, Monínec