Journal of Experimental Psychology: Human Perception and Performance 2011, Vol. 37, No. 2, 529 –538
© 2010 American Psychological Association 0096-1523/10/$12.00 DOI: 10.1037/a0018732
Is This Object Balanced or Unbalanced? Judgments Are on the Safe Side Franc¸oise Samuel and Dirk Kerzel Universite´ de Gene`ve Do we perceive correctly whether a 2-D object is balanced or unbalanced? What would be the cause of biased equilibrium judgments? In two psychometric studies, we varied independently the characteristics of the objects and the equilibrium states. First, we observed that observers were excessively sensitive to the eccentricity of the object top. Second, we found that the subjective transition from “staying upright” to “falling” occurred before the object would have lost balance according to physical laws. To determine the role of naı¨ve physics beliefs, we tested the effect of physical knowledge. Indeed, participants gave much less erroneous fall responses, once they were acquainted with the physical law. However, a slight bias remained that could not be attributed to an error in locating the position of the center of mass, as fall judgments occurred even when participants judged that the center of mass was above the object base. That is, participants seemed to act according to the principle that it is safer to judge that an object will fall though it would not, rather than making the opposite error. Keywords: visual perception, equilibrium judgment, balanced– unbalanced, center of mass, naı¨ve physics
moff, Bocheva, & Mitrani, 1990). But some studies revealed biases. For example, L-shaped stimuli elicited a displacement of the perceived center towards the limb intersection (Vishwanath & Kowler, 2003). Other studies showed that the perceived center was drawn away from the center of mass towards the center of the inscribed circle (Baud-Bovy & Gentaz, 2004; Baud-Bovy & Soechting, 2001). Also, the orientation of the object has an effect: According to some studies, the object center was located too low (Bingham & Muchisky, 1993a, 1993b; Kerzel, 2002), according to others, too high (Baud-Bovy & Gentaz, 2004; Baud-Bovy & Soechting, 2001; Davi, 1994). Yet, overall the studies show that the center of mass of the area is the best predictor for the position of the perceived center of an object. Thus, observers would found their equilibrium judgments on relatively correct premises. How is the relationship between center of mass and point of support understood? The developmental studies of Inhelder and Piaget (1955/1972) and subsequently Siegler (1978), Case (1985), and Thomas, Pons, and de Ribaupierre (1996), using two-arm balances, show that children progressively take account of the weights, then of the distances of the weights from the fulcrum, and then take account of both jointly, when evaluating whether the object is balanced. Ultimately, they find out or learn that the ratio of the weights must be inversely proportional to the ratio of the distances in order to achieve equilibrium (i.e., to have the center of mass above the point of support). However, even for adults balance problems are difficult: Proffitt and Gilden’s (1989) paperand-pencil study with undergraduates shows that about half of the subjects failed to fully understand the physical laws of equilibrium. With the ability to determine the center of mass and with the awareness that the position of the center of mass in relation to the support point determines the equilibrium state of objects, do adults make correct predictions about whether an object will fall or not? Naı¨ve physics studies showed that many people use erroneous physical “laws,” which engender false predictions in situations where physical knowledge is needed. For example, observers tend to mix up curved and straight trajectories when they predict the
When facing an object that is in an unstable position, humans should be able to react quickly and correctly either by preventing the object from falling, or by getting out of the way of the falling object. Optimally, we would do so before the trajectory is made evident as it begins to fall. For example, when felling a tree, we have to anticipate its direction of fall; when handling a skewed object, we must know where to support it; when supervising a child while he is doing his first steps, we need to predict the direction of possible fall. Consequently, a correct diagnosis of equilibrium states certainly gives an advantage for our own and our progeny’s survival. The equilibrium state of an object depends on its distribution of mass in relation to the point or surface of support. Specifically, the object falls if its center of mass is not vertically above the support. In most everyday situations, the approximate center of mass must be perceived haptically or visually. In case of a visual assessment, do observers consider the center of mass as the object center and do they correctly locate it? Several studies demonstrated that the center of a shape is perceived near the center of mass of the area (Bingham & Muchisky, 1993a; Davi, Yakimoff, Bocheva, & Kefaloff, 1993; Proffitt, Thomas, & O’Brien, 1983; Vos, Bocheva, Yakimoff, & Helsper, 1993; Whitaker & McGraw, 1998; Yaki-
This article was published Online First September 6, 2010. Franc¸oise Samuel and Dirk Kerzel, Faculte´ de Psychologie et des Sciences de l’Education, Universite´ de Gene`ve. This experiment was realized using Cogent 2000 developed by the Cogent 2000 team at the FIL and the ICN and Cogent Graphics developed by John Romaya at the LON at the Wellcome Department of Imaging Neuroscience. Many thanks to William Larson for helping with trigonometry, and to Roland Maurer for helping with the calculation of the confidence ellipses. Correspondence concerning this article should be sent to Franc¸oise Samuel, Faculte´ de Psychologie et des Sciences de l’Education, Universite´ de Gene`ve, Bld du Pont d’Arve 40, CH-1205 Gene`ve, Switzerland. E-mail:
[email protected] 529
530
SAMUEL AND KERZEL
trajectory that a falling or freely rolling object would take under different circumstances (Caramazza, McCloskey, & Green, 1981; Kalichman, 1991; McCloskey & Kohl, 1983). Some of these false predictions might have their origin in perceptual mechanisms, as it might happen when one assesses a trajectory of a falling object within a moving reference frame (McCloskey, Washburn, & Felch, 1983). An example of the use of naı¨ve physics that is on the same topic as this study is given by Roncato and Rumiati (1986). They assessed subjects’ ability to recognize situations of neutral equilibrium: In paper and pencil tasks and adjustment tasks, a high percentage of subjects chose a configuration of vertical symmetry as position of equilibrium. For example, for a cross with equally sized arms with a pivot point in the cross center, only the positions with the arms in horizontal-vertical positions or with the arms at 45°-diagonals were considered balanced, though according to physics the other positions were not less balanced, as the center of mass could not fall any lower. An alternative to using naı¨ve (erroneous) physical laws is to use simplified laws that often, but not always, point to the correct solution. Todd and Warren (1982) found such heuristics: When subjects observed the collision of two objects and had to judge which object is heavier, their responses were mostly correct, though they did not take into account all available information; for example, in a situation where both objects were moving, they considered the final speed of the objects, ignoring the initial speed. The aim of our study was to determine observers’ ability to judge the equilibrium state of asymmetric 2-D shapes, referred to as “objects.” In contrast to the Piagetian balance problems, which can be solved by calculation in a relatively easy way, and in contrast to the Roncato and Rumiati (1986) problems, which can be worked out by applying one rule, equilibrium judgments with irregular shapes allow no easy computation. For such problems, the best way of quick assessment is perceptual. As observers fare relatively well at localizing the centers of mass of shapes, we supposed that this part of the problem would be well resolved. However, in order to make an equilibrium judgment, observers must find out whether the center of mass is vertically above the support surface; this spatial judgment might render fuzzy the initial knowledge about the position of the center of mass. Naı¨ve physics beliefs might interfere and cause the use of erroneous rules about what conditions equilibrium, resulting in some bias. On the other hand, a bias might also have some perceptual cause. The importance of the foveal and perifoveal region might bring about that the peripheral parts of an object are insufficiently taken into account. Then again, vertical asymmetries favoring in many cases the lower (motion direction changes: Amenedo, Pazo-Alvarez, & Cadaveira, 2007; visually guided pointing: Danckert & Goodale, 2001; contrast, hue, motion: Levine & McAnany, 2005; illusory contours: Rubin, Nakayama, & Shapley, 1996), but favoring in some cases the upper visual field (objects are more different if their upper part is different than if it is their lower part: Chambers, McBeath, Schiano, & Metz, 1999; detection of depth differences: Levine & McAnany, 2005), might engender a bias, as the whole object has to be taken into account equally to judge correctly. In two pilot studies, we found that observers tend to judge that an object will fall, though it is still in stable equilibrium. Furthermore, these studies indicated that the top of the object is taken overmuch into account when making an equilibrium judgment. Based on these results, we designed the two experiments that we
report here. In Experiment 1, in which participants had to adjust the orientation of an object such that it would be in unstable equilibrium, we aimed at observing whether the location of the object top or the configuration of the object bottom could account for biases in the equilibrium adjustment. In Experiment 2, the goal was to understand whether the observed biases had their origin in perceptual mechanisms or whether they were attributable to lack of physical knowledge. As a first task, observers performed a balanced versus unbalanced forced-choice task on objects with characteristics that varied in an independent way from their equilibrium states; in a second task, we tested how much the equilibrium judgments changed, once the participants were acquainted with the physical law that rules equilibrium; in a last task, we observed whether the remaining biases were explained by the subjective location of the center of mass of the objects.
General Methods Participants Forty undergraduate and graduate students at Geneva University participated, some for course credit, some for pay, and some for free (per experiment; N ⫽ 20). All reported normal or correctedto-normal vision and were naı¨ve as to the purpose of the experiment. According to the questionnaire they filled out, none of the participants had had a higher level training in the domain of physics.
Apparatus The stimuli were generated by the COGENT 2000 toolbox of MATLAB and were presented on a CRT screen with a 1,280 ⫻ 1,024 pixel resolution at a refresh rate of 75 Hz. The visible screen dimensions had been adjusted in order to equalize vertical and horizontal pixel size. The experimental room was dimly lit. The participants’ movements were not restrained; the viewing distance from the screen was approximately 55 cm.
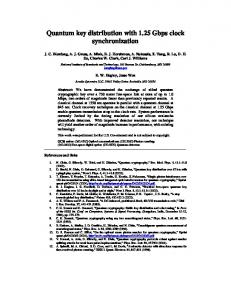
Experiment 1 Method Stimuli objects. The objects were polygons with eight vertices of which two were concave so that the object were composed of a larger lower form and a smaller upper form (Figure 1; for object construction, see Appendix and Figure 5). The lowest tip of
Figure 1. The 18 objects of Experiment 1 presented in their equilibrium orientation. The characteristics of ratio (r23, r39), eccentricity (e0, e5, e10), and base (b55, b45, b35) were crossed.
IS THIS OBJECT BALANCED OR UNBALANCED?
the object was in contact with the surface that supported the object; therefore this tip would be the pivot point if the object would fall down according to the laws of gravity. The object would be balanced, though unstably, if the center of mass was exactly above this downward tip. The characteristics of the objects were varied in the following way: First, we changed the ratio of sizes between the upper and the lower form: The upper form took up either 23% of the whole object height, or 39% of the whole object height. We termed these ratio characteristics r23 and r39, respectively. Second, the objects were constructed such that they were balanced either when the object top (the uppermost tip of the upper form) was exactly above the supporting tip, or they were balanced when the object top was 5° eccentric, or they were balanced when the object top was 10° eccentric in relation to the supporting tip. We termed the three eccentricity characteristics e0, e5, and e10, respectively. Third, we varied the angles at the base of the objects; the objects were constructed such that they were balanced when the angle to the right of the base of the object was either 55°, or 45°, or 35° and accordingly, we termed the base characteristics b55, b45, and b35. So we created 18 objects by crossing the characteristics of ratio, eccentricity, and base. According to constraints, the objects changed their form: The angle at the base tip was 90° for all objects, but the lengths of the right and left lowest edges were varied. All objects were generated also as mirror-symmetric equivalents, which are not represented in Figure 1. The object height was always 560 pixels (16° of visual angle at a viewing distance of 55 cm). The objects were middle grey and had a 2 pixel black contour. The lower fifth of the screen was darker grey; this represented a support for the objects. The objects were presented on average in the center of the screen; however, a slight random horizontal variation was introduced so as to discourage the observers from using the screen edges as a reference. Trials and task. An object, with its downward tip in contact with the support surface, was presented. Its initial orientation was randomly generated in a range from ⫺25° (tilted counterclockwise) to ⫹25° (clockwise) in relation to the equilibrium orientation. The task of the participant was to straighten the object into a balanced orientation (i.e., into unstable equilibrium). The participant was told “The object should have an equal chance to fall to the right or to the left.” The participants used the right Crtl key of a normal keyboard to rotate the object counter-clockwise and the left Ctrl key to rotate the object clockwise (the downward tip was the center of rotation). There was no time constraint. Once the participant judged that the object was balanced, he pressed key 7, which saved the result and ended the trial with the presentation of a mask for 150 ms. The next trial was started by the participant with a key press on the two Ctrl keys. Two or three practice trials preceded the tests trials. At no time a feed-back on equilibrium states was given. When participants asked how they should solve the task, we answered that it should be done in an intuitive way. After the completion of the experiment, we asked participants to fill out a short questionnaire in order to know their level of expertise in physics, and whether they had used any special tactic to solve the task. Design and data treatment. We presented 36 different stimuli by crossing ratios (2), eccentricities (3), bases (3), and mirror symmetries (2). Each stimulus was presented 3 times, which
531
amounted to 108 trials. The order of the trials was completely randomized. We combined the data from the 6 equilibrium adjustments (3 from each symmetry version; we used symmetric objects in order to neutralize any effect of laterality) for each of the 18 objects. Within-observer, within-object (between-trial) dispersion was considerable in some cases (mean SD over all objects and all subjects ⫽ 3.07). Typical procedures to eliminate outliers (e.g., exclusion of trials beyond twice the SD) could not be applied because of the small number of observations per condition. We therefore chose to use a robust indicator of central tendency, M-estimator of location, combined with its robust indicator of dispersion, Tau estimator of scale (mean Tau over all objects and all subjects ⫽ 2.41)1; however, we checked that the results obtained with M-estimators of location were comparable to those obtained with means. So the Point of Subjective Equality (PSE) of falling to the right or left, given in degrees, was based on the M-estimator of location over the 6 responses. The PSE was calculated for each subject and each object. A PSE of 0 degrees corresponds to an absence of bias; a positive PSE would indicate a tendency to tilt the objects clockwise; a negative PSE would indicate a tendency to tilt the object counter-clockwise (for objects as presented in Figure 1; the reverse for the mirror-symmetric version).
Results Figure 2 shows that eccentricity had the hypothesized effect on the PSE: For the e5 and e10 objects, mean PSE differed from 0°, which was not the case for e0 objects. A repeated measure ANOVA (2 Ratios ⫻ 3 Eccentricities ⫻ 3 Bases) showed that the effect of eccentricity on PSE was significant, F(2, 38) ⫽ 13.32, p ⬍ .001, 2p ⫽ .41, and contrast analysis showed that the difference was highly significant between e0 and e5 objects, as well as between e5 and e10 objects (0.21° vs. ⫺1.02° vs. ⫺1.90°; p ⬍ .002 and p ⬍ .008, respectively), indicating that observers tended to move the object top towards the vertical above the point of support (making the top less eccentric) and this tendency led to an increased bias when adjusting objects with a more eccentric top. The effect of base on PSE reached significance, F(2, 38) ⫽ 4.55, p ⬍ .017, 2p ⫽ .19, but contrast analysis showed that this was because of the difference between b55 and b45 objects only (the means were 0.32°, ⫺1.04°, ⫺1.99°; the overall negative tendency was because of the underlying effect of eccentricity), which means that observers exhibited the tendency to “straighten” the objects towards 45° angles; however, this effect was very small, excepting one participant, who had a nearly exact ⫹10° and ⫺10° bias. There was no effect of ratio on PSE, that is, judgments did not differ for objects with smaller or bigger top parts. None of the interactions reached significance. A repeated measure ANOVA of eccentricity on Tau estimator of scale showed a significant effect, F(2, 38) ⫽ 4.39, p ⬍ .019, indicating an increase of intra-individual variability when observers deal with eccentric objects. As visible in Figure 2, this effect was paralleled by an increase of inter-individual variability. 1
S-plus functions (version 7.1): location.m, scale.tau; both with default options.
SAMUEL AND KERZEL
532
the location of the center of mass itself or to some error when relating it to the object base: If it was because of a systematic error in the location of the center of mass, we should observe that the subjective center of mass location is a clear indicator of the equilibrium judgments in the second task, as the second and third tasks were completed once the participants knew the physical law that states the link between center of mass and equilibrium; alternatively, if it was because of some error when relating it to the object base, the subjective center of mass location should not, or only partially, explain the equilibrium judgments in the second task.
Method Figure 2. Results of Experiment 1: Mean bias as a function of eccentricity, with 95% confidence intervals.
Discussion Experiment 1 showed that observers were excessively sensitive to the position of the upper part of the object when adjusting its tilt in order to achieve equilibrium: An eccentric object top conveyed the impression that the object was out of balance even if this was not the case. Therefore, observers tended to reduce the gap between the object top and the vertical above the point of support, which led to adjustments that were biased in the direction opposite to the eccentricity. Somewhat surprisingly, we did not find an interaction between ratio and eccentricity; we would have expected that objects with a bigger top would elicit a stronger eccentricity bias, because the surface that is eccentric is much bigger. We examined whether the configuration of the object base might have an importance, and, in fact, a slight tendency to equalize the angles on both sides of the object base was found; however, this effect was less strong than the one because of eccentricity, with the exception of one participant, who quite clearly chose the strategy to equalize the angles at the base of the objects in order to solve the task.
Experiment 2 In the pilot studies and in Experiment 1, we observed that equilibrium judgments are biased, but we did not know whether these biases were attributable to a lack of physical knowledge or to perceptual mechanisms. To separate the influences of the two possible sources of bias, we ran Experiment 2, an experiment with three tasks. In the first task, objects were presented and participants had to determine whether the object would stay upright or fall sideways. The second task was the same as the first task, with the exception that we explained beforehand to the participants the physical law to be used to solve this problem. In the third task, the participant had to locate the centers of mass on these objects. The rationale of this experiment with three within-subject tasks was that, if the insufficient physical knowledge was at the origin of the biases, the results of the second task should be much less biased than those of the first task. Inversely, if a purely perceptual mechanism explained the biases, then the physical explanation would leave the results unchanged. The third task should reveal whether a remaining bias was attributable to a systematic error in
Experimental setup, tasks, trials, and questionnaire. Experiment 2 consisted of three within-subject Tasks 2a, 2b, and 2c (in this order). In the forced-choice Task 2a, participants had to judge whether the object would fall to the left, or stay upright, or fall to the right. Participants gave their responses by using the left arrow, down arrow, and right arrow on a normal keyboard (with one finger or three fingers, as they preferred). Accuracy was stressed, but the participants were acquainted with the fact that they had only three seconds to respond (if the response was given earlier, the stimulus disappeared and the next trial began). At no time a feed-back on equilibrium states was given. When participants asked how they should solve the task, we answered that it should be done in an intuitive way. As soon as a participant had understood the task, we started the experimental trials. If the participant failed to respond to a stimulus, this stimulus was presented again later. In the same way, impossible directional answers (i.e., that the object would fall to the right, although only the answers that it would fall to the left or stay upright were plausible), nullified the trial and this stimulus was brought up again later. On average, participants had to do 4% supplementary trials because of missing the time limit or having given an impossible answer. Participants could have a pause (a screen without object) by keying the space bar, and start again in the same way. Task 2b was in all points identical to task 2a; however the instructions that were given to the participants differed between the two tasks. In Task 2b, the participants received, before beginning the task, an explanation about the physical law that determines whether an object would fall or not. With help of a few drawings and a practical example, we clarified the concept of center of mass and we explained that the object would stay upright if the center of mass was vertically above any portion of the base of the object, and inversely, that it would fall if this was not the case. Participants were encouraged to use this knowledge in Task 2b, as they would see the same stimuli they had already seen in Task 2a. As in the previous task, the participants had three seconds to respond to each stimulus. In this task, participants had to do an average of 7% supplementary trials because they missed the time limit or because they gave an impossible answer. In Task 2c, the participants had to move a small dot, which initially was randomly situated, till they judged that it was located on the center of mass of the presented object. The result was recorded when the participant pressed the left mouse button. For this last task, there was no time limit. The three tasks were done within the same session. During the short breaks between the tasks, participants were asked to fill in a
IS THIS OBJECT BALANCED OR UNBALANCED?
questionnaire. After Task 2a, we wanted to know their level of expertise in physics, and whether they had used any physical knowledge in order to solve the task. After 2b, we wanted to know if they had changed their method of solving the task, now that they knew the physical law, and whether, with this knowledge, they found the task easier or more difficult. After 2c, we wanted to know the difficulties they might have encountered in this task. Stimuli objects. The features of the object were manipulated in three ways. First, the equilibrium state of the objects was varied such that the objects were balanced (they would stay in their present position) or unbalanced (they would fall), or intermediately, in unstable equilibrium (they would fall with the slightest disturbance). We developed a parameter that we call the Base Length Unit (blu), which expressed the equilibrium state as the position of the center of mass as a ratio of the length of the support surface; the anchor point for this scale was the center of the support surface, that is, a 0.0 blu object would be an object with its center of mass exactly above the center of the support surface. The use of the blu system allowed general statements across object series, although the width of the bottom part changed. The 0.1, 0.2, 0.3 and 0.4 blu objects were in stable equilibrium, though the center of mass was slightly and then increasingly distant horizontally from the center of the object’s base. By definition, a 0.5 object was in unstable equilibrium, as the center of mass was exactly above the edge of the base. The 0.6, 0.7, 0.8, and the 0.9 blu objects were out of balance and this fact was increasingly obvious. We changed the equilibrium states by varying the horizontal configuration of the upper part of the objects in a controlled way (see detailed information in Appendix), that is, the upper part of the object was increasingly eccentric in such a way that the equilibrium state would vary in 0.1 blu steps exactly (see Figure 3, variation of equilibrium states from left to right). Second, independently of the equilibrium variation, the objects were built in two width-height ratios. The widths of the object bases were either 20% or 30% (narrow or wide objects) of the object height (see Figure 3, lines r20 vs. lines r30). Third, we created versions with a more and a less eccentric upper part for the same equilibrium state: For the more eccentric
Figure 3. The 4 object series of Experiment 2. From right to left, the equilibrium states vary in steps of 0.1 blu (Base Length Unit). The width-height ratio of the objects varies from the top two lines to the bottom two lines (r20 vs. r30). The odd versus even lines show the objects with the less eccentric top versus the ones with the more eccentric top (e1 vs. e2).
533
version, the top of the object was slightly farther away (5% of the total object height) from the object base center than for the less eccentric version. In compensation, the center of the object with the more eccentric object is a bit wider in the opposite direction (see Figure 3, lines e1 vs. e2). This variation too was independent of the equilibrium state. In order to control the position of the center of mass successfully, we had to adapt the variation of angles of the top part of the object within each series. For the Task 2c, we used a more narrow selection of the stimuli used in the Tasks 2a and 2b: We presented the 0.3, 0.5, and the 0.7 blu objects of each of the series (see Figure 3, the 3th, 5th, and 7th objects of each line). We reduced the number of stimuli in order to conduct the three tasks of the experiment within one experimental session. For the three tasks, all objects were generated also as mirrorsymmetric equivalents, which are not represented in Figure 3. The object height, the color of the object, the support surface, and the background were the same as in Experiment 1. As in the previous experiment, the objects were presented with a slight random horizontal variation in the center of the screen. Design and data treatment. In the Tasks 2a and 2b, we presented 72 different stimuli by crossing equilibrium states (9), ratios (2), top eccentricities (2), and mirror symmetries (2). Each stimulus was presented 5 times, amounting to 360 trials. The order of stimulus presentation was completely randomized. For all analyses, we combined the data from the objects with their mirror-symmetric equivalents, so we had 10 responses (balanced vs. unbalanced) for each participant for each of the 9 equilibrium states of each of the 4 object series. The proportion of unbalanced responses was the base for calculating a psychometric curve with the function f(x) ⫽ 1/(1 ⫹ exp(⫺(x ⫺ c)/a)), where x is the equilibrium state of the object, c estimates the Point of Subjective Equality (PSE; in blu) between balanced and unbalanced. A PSE smaller than 0.5 blu indicates that objects are considered unbalanced too frequently; a PSE larger than 0.5 blu indicates that objects are considered balanced too frequently. The parameter a allows the calculation of the slope of the sigmoid curve at its steepest point, with slope ⫽ 1/(4a). A large slope value indicates a sudden change from balanced to unbalanced responses; a small slope value indicates a poor discrimination between balanced and unbalanced. In Task 2a, the slope values of the curves ranged from 1.03 to 22.73, M ⫽ 3.68, and the R2 ranged from .58 to 1.00, M ⫽ .93. In Task 2b, the slope values ranged from 1.32 to 20.83, M ⫽ 4.44, and the R2 ranged from .78 to 1.00, M ⫽.96. In Task 2c, we presented 24 stimuli by crossing equilibrium states (3), ratios (2), eccentricities (2), and mirror symmetries (2). Each stimulus was presented 3 times, so there were 72 trials. The order of presentation was completely randomized. The dependent measure of Task 2c were x-errors and y-errors (errors on the horizontal and vertical axis) with respect to the real positions of the centers of mass. As in the other analyses, we combined the data of the mirror-symmetric equivalents, so we calculated for each participant, for each of the 12 objects, the mean over 6 responses. For a first analysis, we expressed the x-errors and y-errors as a percent of the total object height. For a second analysis, in order to compare the subjective center of mass locations on the x-axis in Task 2c to the equilibrium judgments in the Tasks 2a and 2b, we transformed the x-errors of Task 2c into what we term “assumed PSE.” The rationale for this transformation is that, given the
534
SAMUEL AND KERZEL
physical law that an object is balanced if and only if the center of mass is vertically above the object base, and assuming that participants judge according to this law (as they were informed of this law), one can conversely assume that the subjective horizontal center of mass location of an object in relation to the object base reveals whether the object is considered balanced or not balanced. The transformation of the x-errors into assumed PSE was done as follows: We expressed the x-errors as a proportion of the base length of the object (i.e., we expressed it in blu); we inverted the scale of the x-errors, as a center of mass location biased in one direction corresponds to a PSE biased in the other direction. We anchored the scale at 0.5 blu, that is, an x-error of zero corresponds to an assumed PSE of 0.5 blu (i.e., in both cases, an absence of error), a positive bias in locating the center of mass corresponds to an assumed PSE that is smaller than 0.5 blu; a negative bias in locating the center of mass corresponds to an assumed PSE that is larger than 0.5 blu (e.g., if a participant locates the center of mass of a 0.7 blu object with a ⫹0.1 blu error, he treats this object as if it was a 0.8 blu object; therefore we can assume that, for this participant, it would require a 0.4 blu object in order to be treated as a 0.5 blu object—this corresponds to an assumed PSE of 0.4 blu). Before averaging the data over the 0.3, 0.5, and the 0.7 blu objects into one assumed PSE for each object series, we ascertained that the conclusions we could draw from the data issued from the three types of objects did not differ.
Results Figure 4 shows the main results of the three tasks of Experiment 2: The circles represent the PSE of Task 2a; the circles with crosses represent the PSE of Task 2b, and the squares represent the assumed PSE of Task 2c. A repeated measure ANOVA including the Tasks 2a and 2b (2 Tasks ⫻ 2 Ratios ⫻ 2 Eccentricities) showed that the change of instruction between Task 2a and Task 2b had a significant effect, F(1, 19) ⫽ 8.44, p ⫽ .009, 2p ⫽ .31, that is, the mean PSE of Task 2a was smaller than the mean PSE
of Task 2b (0.37 vs. 0.46 blu). Ratio too had a highly significant effect on PSE, F(1, 19) ⫽ 30.34, p ⬍ .001, 2p ⫽ .62., as the wide objects had smaller PSE than the narrow objects. Eccentricity had no effect on PSE. The interaction of task and ratio was significant, F(1, 19) ⫽ 9.25, p ⬍ .007, 2p ⫽ .33, indicating that the effect of task was stronger for the wide objects. None of the other interactions were significant. The correlations from Task 2a to Task 2b were not significant for the four object series. The highly significant negative correlation between the PSE of Task 2a and the difference of PSE between the Tasks 2a and 2b showed that it was the participants with the smallest PSE in Task 2a that most increased their PSE in Task 2b, r(18) ⫽ ⫺.71, p ⬍ .001. Looking more precisely at Task 2a, participants had very anticipative fall responses as the mean PSE was significantly smaller than 0.5 blu, t(19) ⫽ ⫺4.83, p ⬍ .001. Within the task, the six between-series correlations of PSE were quite strong, rs(18) ⱖ .58, ps ⱕ .007, showing good within-task within-subject consistency. An ANOVA on the data from Task 2a showed that ratio had a significant effect on PSE, F(1, 19) ⫽ 25.79, p ⬍ .001, 2p ⫽ .58. We did not find the expected effect of eccentricity. Now considering Task 2b, the difference between the mean PSE and 0.5 blu was marginally significant, t(19) ⫽ ⫺2.00, p ⫽ .060. An ANOVA showed that ratio had a significant effect on PSE, F(1, 19) ⫽ 6.24, p ⬍ .022, 2p ⫽ .25. There was no effect of eccentricity. As in the previous task, we observed for Task 2b strong between-series correlations of PSE, rs(18) ⱖ .51, ps ⬍ .012, indicating good within-task within-subject consistency. For Task 2c, we calculated the mean subjective locations of the centers of mass, expressed in percent of the object height: Over all series, the x-error was ⫺.72 and the y-error was ⫹ 2.40. The 95% confidence ellipse (bivariate statistics; Batschelet, 1981) showed that the responses were significantly biased towards the top of the object. The errors on the x-axis were negatively correlated to the PSE of Task 2a, r(18) ⫽ ⫺.48, p ⬍ .031, and to the PSE of Task 2b, r(18) ⫽ ⫺.58, p ⬍ .007. The y-errors did not correlate with the PSE. A repeated measure ANOVA in order to compare the PSE of Task 2b and the assumed PSE of Task 2c (the assumed PSE are transformed x-errors, see the section Design and data treatment) showed that the assumed PSE of Task 2c was significantly larger than the PSE of Task 2b, respectively, 0.53 versus 0.46 blu, F(1, 19) ⫽ 11.72, p ⫽ .003, 2p ⫽ .38. A t-test showed that the assumed PSE of Task 2c, though it tended towards late fall responses, did not differ significantly from 0.5 blu, t(19) ⫽ 1.20, p ⫽ .243 (Figure 4, squares). The between-series correlations of assumed PSE were very strong, rs(18) ⱖ .81, ps ⬍ .001, showing good within-task within-subject consistency.
Discussion
Figure 4. Results of the three tasks of Experiment 2. For each of the object series, mean PSE of Task 2a (circles), of Task 2b (circles with crosses), and mean assumed PSE of Task 2c (squares), are represented with 95% confidence intervals. The data straddling the 0.5 line correspond to unbiased results.
In Task 2a, we observed anticipative fall responses, that is, observers tended to judge that the objects would fall, though they would stay upright according to the laws of physics. The excess of fall responses was even more marked for the wide objects. This effect and this interaction seem to be quite robust as they replicated the pattern of responses of the two pilot studies we already mentioned. However, in this experiment we did not find the effect of eccentricity, which we expected according to the pilot studies and according to Experiment 1, as the fall responses were not more
IS THIS OBJECT BALANCED OR UNBALANCED?
anticipative for objects with a more eccentric top than for those with a less eccentric top. A possible explanation might be that, in Experiment 2, the variation of top eccentricity was not sufficiently salient. The question of whether the anticipative fall responses are because of a lack of physical knowledge was clearly answered: Once the participants were acquainted with the physical law, which states whether the object is balanced or not, they responded in a much less biased way. The pattern of correlations is evidence of the fact that participants, though they had a coherent way to respond within each task, changed their criterion of response after having received the explanation about physics. Once they knew how to deal with such a situation, most participants produced larger PSE and the participants with the smallest PSE corrected their responses in the strongest way. As not only the PSE of the postexplanation equilibrium judgment, but also the PSE of the preexplanation equilibrium judgment correlate (though less strongly) with the subjective horizontal center of mass location, we suppose that it was not so much the concept of center of mass that the participants discovered through the explanation, but the spatial relationship between center of mass and object base. In fact, after the first task, about half of the questionnaires mentioned the center of mass (or similar), but only one mentioned its relation to the object base. The participants who had given anticipative fall responses were, as expected, the ones that judged the center of mass closer towards the fall direction. Yet, the transformation of the 2c results into assumed PSE showed that the subjective location of the center of mass did not account for the totality of the remaining anticipative fall effect in Task 2b. If the postexplanation equilibrium judgments in 2b had been based without error on the subjective location of the center of mass as done in 2c, we would have expected a slight tendency to late fall responses— but we observe the contrary. If we take the results of 2c as a standard, a mean gap of 0.07 blu (difference between 2c and 2b) stays unaccounted for. So, even when knowing the physical laws governing object equilibrium, the participants showed slightly anticipative fall responses, and this anticipation is more flagrant in view of the subjective center of mass location. The fact that the center of mass was located too high replicates findings of Baud-Bovy and Soechting (2001) and Baud-Bovy and Gentaz (2004; for the adult participants only) and confirms the model of Davi (1994). However, the fact that the center of mass was located too high seems not to have influenced the equilibrium judgments.
General Discussion We confirmed earlier findings that observers tend to judge that a near-to-unbalanced object would fall, though the object would in fact stay upright. Indeed, for some participants, a slight departure from vertical symmetry was enough to trigger the sensation that the object would fall. Undeniably, a situation of vertical mirrorsymmetry is the state of most perfect balance and this type of symmetry is very efficiently detected (e.g., Corballis & Roldan, 1975; Royer, 1981; Wenderoth, 1994). This is not surprising, because it is widely represented in nature (Wagemans, 1997). Yet we should be able to detect equilibrium where symmetry is lacking. Our study shows that this is difficult for many observers. This
535
tendency to consider configurations that lack vertical symmetry as unbalanced, though they are balanced, had been shown by Roncato and Rumiati (1986). In the same vein, Bingham and Muchisky (1993b) noted that slight deviations from symmetry were taken excessively into consideration when determining the center of objects. Did our response patterns point towards the use of naı¨ve physics beliefs? For one participant in Experiment 1, who relied completely on the angles at the object base for finding the equilibrium orientation, and for a few participants in Experiment 2, who showed very anticipative fall responses, indicating that they had difficulties in considering asymmetric objects as balanced, we did not observe responses that seemed to be founded on a naı¨ve physics belief. For most participants, the experimental evidence, supported by the data we collected in the questionnaires, shows that it is not so much a determined belief as an absence of knowledge that produced the heavily biased results. More precisely, many participants seemed to take account of the whole configuration to make their decision, that is, they had some concept of center of mass, which did not change essentially after the physical law was explained to them, but most seemed to learn during the explanation that they had to detect whether the center of mass was above the object base in order to make their decision. After receiving this information, some participants changed their criterion of choice drastically, and in doing so came much nearer to physical reality. Interestingly, the bias did not completely disappear once the participants knew the physical law and, surprisingly, the bias was even more marked if one considers the subjective horizontal position of the center of mass as the criterion of equilibrium. That is, as the participants had the tendency to locate the center of mass towards the middle of the object segment, therefore away from the fall direction, we would have expected that they would consider the object balanced in too many instances. This was not the case. What might be the reason? Difficulties in establishing the vertical above the edge of the object base would have resulted in scatter, but not in a bias. The most logical explanation is that the participants tend to leave a security margin when making their decision, because it is safer to say the object would fall though it wouldn’t, than the other way round. A counterintuitive result in Experiment 2 was that the bias was larger for wider objects than for narrower ones (we remind that the biases are expressed as a proportion of the base of the object. If the biases were expressed in absolute terms, they would be even larger for the wide objects in comparison to the narrow ones). This difference might be related to the effect of implied weight, as described by Hubbard (1997), who observed that bigger moving targets elicited larger downwards biases because of representational gravity. An effect of implied weight would explain that participants choose a larger security margin for wider objects, as these seem to be heavier and therefore are potentially more dangerous. In Experiment 1, we observed the participant’s excessive sensitivity to the position of the upper part of the object. This confirmed findings in two of our pilot studies. Quite disappointingly, we failed to replicate this effect of eccentricity in Experiment 2. However, we believe that it is not an artifact, although it is apparently less strong or reliable than we initially thought. One might suppose that the effect of top eccentricity is because participants looked more at the top while doing the equilibrium judg-
536
SAMUEL AND KERZEL
ments. However, in a previous equilibrium judgment study (Samuel & Kerzel, in preparation) in which we used an eye-tracker, we determined that eye fixations were almost never on the upper part of the objects. They were predominantly on the central part and on the concave vertices. Since in our present Experiment 1, the objects had two concave vertices (i.e., a “neck”) an excessive amount of eye fixations on this part of the object might have had a similar effect as excessively fixating on the top of the object (as the neck was near the top). However, in the pilot studies the bias was also visible, despite the fact that in these experiments the concave vertices were as much on the lower as on the upper part of the objects. So it seems that the causes of the bias can neither lie in excessive eye fixation on the object top, nor in excessive eye fixation on the concave vertices. In the center of mass location task, we observed a bias towards the object top. This could be related to the well documented top-bottom anisotropy that vertical lines tend to be bisected too high, that is, about 1.5% above the true midpoint (e.g., Scarisbrick, Tweedy, & Kuslansky, 1987; Shuren, Jacobs, & Heilman, 1997). Post, O’Malley, Yeh, and Bethel (2006) demonstrated that the vertical bisection bias also appears when halving spatial extents in the absence of lines. If the center of mass is in fact perceived too high, this could explain why it was influenced overmuch by the top eccentricity. However, we observed no correlation with the equilibrium judgments. Are there ecological reasons to give more value to the information about the top of the object? Gibson (1986) applied the notion of affordance to events: “Some natural events demand or invite appropriate behaviors . . . . An approaching object affords either contact without collision or contact with collision” (p. 102). An object-losing-balance is such an event, and so we should do our best to stay unharmed. We might have noticed that the mass that threatens to change position is generally higher than the potential pivot point (because, if the mass was at the lowest position in relation to the pivot point, no change of position would occur). For example, in most cases a falling tree rotates around its root anchorage and the part that moves fastest and farthest is the top of the tree. Thus, in many cases, the top of an object gives the most salient information about a fall. The top is also the most parsimonious indicator whether an object might be out of balance or not, as eccentric parts of the objects—and the top part is by definition more eccentric— determine the position of the center of mass to a greater extent than more centered parts. In fact, observers do use parsimonious indicators in order to solve a complicated physical task (Todd & Warren, 1982). The question arises whether the participants’ response to 2-D stimuli on a screen gives us insight into how we would interact with real 3-D objects, as these might be of irregular depth and density. As a first answer, we want to point out that sometimes we act in environments with very scarce visual input, for example, when we move in the fog, dealing with vague silhouettes, or under conditions of scotopic vision, or when facing strong light. In these conditions, information about the 3-D structure of the environment may not be available, and our perception may not exceed 2-D vision. Even under such circumstances, we strive to react appropriately. The stimuli we presented allowed for equilibrium judgments at least as well as degraded natural inputs. Second, for material with a homogeneous appearance, we make the default assumption that the object is homogenously dense. As
observed by Karmiloff-Smith and Inhelder (1975), the first theory that children form about the center of mass of an object is that it is situated at the geometric center; confronted with an object of irregular density, it is only after repeated failures to balance the object and sometimes only when the children close their eyes and deal with the object haptically that they are able to accept that sometimes the center of mass is not in the geometric center. As adults, once we hold an object, we recognize quickly when the homogeneous density theory must be amended; however, our first approach to an object of even appearance will be similar to the child’s. In view of this, we trust that the stimuli we presented were treated as being of regular density, and the biases were calculated according to this assumption. Third, when observers view a 2-D form, they can interpret it as a shape of regular, therefore negligible depth, or as the frontoparallel view of a relatively complex object with varying depths, or as a random angle view of a highly complex object for which the depth markers were lost (e.g., by poor viewing conditions). As none of the participants commented that the task was counterintuitive, we conclude that they were able to attribute a mass to the virtual object; further, as none asked whether they should consider depth irregularities, we suppose they treated the object as having one depth, which therefore had not to be taken into account. However, let us imagine that some participants would have attributed irregular depths to the object. If they had done it in an unsystematic way, this would not have biased the results. If they had attributed more depth, therefore more mass, where the object is more wide (which would make sense, as many naturally growing objects have a structure where broadness and thickness are related, and human beings are able to extract some of these regularities; see Bingham 1993), then we would have observed in Experiment 1 a bias opposed to the one we observed, that is, the top would have been taken into account insufficiently. If they had attributed more depth either to the object bottom or to the object top, we would have found a correlation between the equilibrium judgment and the bias on the vertical axis in the center of mass location task. As already mentioned, this was not the case. Bearing in mind the three preceding points, we do not pretend that our study encompasses all kinds of objects and situations; objects with visible volume and markers for irregular density were not treated here. Nevertheless, we have no reason to think that the biases we observed with these simple objects would disappear with more complex ones, though most probably they would be more difficult to observe. In conclusion, participants’ equilibrium judgments are on the safe side. Indeed, the practical consequences of assuming an object is balanced, though it is not, has much more serious consequences than making the opposite error. Even when participants were acquainted with the physical law they needed for solving the equilibrium task, they kept a security margin between the point the object would fall according to their subjective center of mass location and the point they judged the object would fall. We find other behaviors that might relate to security: Having a larger security margin for larger objects shows a concern for the effect of weight; taking enhanced account of the object top maximizes the chances to detect a dangerous situation. Overall, we found behaviors that can be considered adaptive.
IS THIS OBJECT BALANCED OR UNBALANCED?
References Amenedo, E., Pazo-Alvarez, P., & Cadaveira, F. (2007). Vertical asymmetries in pre-attentive detection of changes in motion direction. International Journal of Psychophysiology, 64, 184 –189. Batschelet, E. (1981). Circular Statistics in Biology. New York: Academic Press. Baud-Bovy, G., & Gentaz, E. (2004). The visual localization of the centre of triangles in young children and adults. Current Psychology Letters, 13, 1–11. Baud-Bovy, G., & Soechting, J. (2001). Visual localization of the center of mass of compact, asymmetric, two-dimensional shapes. Journal of Experimental Psychology: Human Perception and Performance, 27, 692– 706. Bingham, G. P. (1993). Perceiving the size of trees: Form as information about scale. Journal of Experimental Psychology: Human Perception and Performance, 19, 1139 –1161. Bingham, G. P., & Muchisky, M. M. (1993a). Center of mass perception and inertial frames of reference. Perception and Psychophysics, 54, 617– 632. Bingham, G. P., & Muchisky, M. M. (1993b). Center of mass perception: Perturbation of symmetry. Perception and Psychophysics, 54, 633– 639. Caramazza, A., McCloskey, M., & Green, B. (1981). Naive beliefs in “sophisticated” subjects: Misconceptions about trajectories of objects. Cognition, 9, 117–123. Case, R. (1985). Intellectual development: Birth to adulthood. New York: Academic Press. Chambers, K. W., McBeath, M. K., Schiano, D. J., & Metz, E. G. (1999). Tops are more salient than bottoms. Perception & Psychophysics, 61, 625– 635. Corballis, M. C., & Roldan, C. E. (1975). Detection of symmetry as a function of angular orientation. Journal of Experimental Psychology: Human Perception and Performance, 1, 221–230. Danckert, J., & Goodale, M. A. (2001). Superior performance for visually guided pointing in the lower visual field. Experimental Brain Research, 137, 303–308. Davi, M. (1994). A model for identifying the perceptual centre of polygons. Perception, 23, 1085–1095. Davi, M., Yakimoff, N., Bocheva, N., & Kefaloff, V. (1993). The relative roles of vertices and sides in determining perceptual centres within shapes. Acta Neurobiologiae Experimentalis, 53, 367–375. Gibson, J. J. (1986). The ecological approach to visual perception. Hillsdale, NJ: Lawrence Erlbaum Associates. Hubbard, T. L. (1997). Target size and displacement along the axis of implied gravitational attraction: Effects of implied weight and evidence of representational momentum. Journal of Experimental Psychology: Learning, Memory, and Cognition, 23, 1484 –1493. Inhelder, B., & Piaget, J. (1955/1972). De la logique de l’enfant a` la logique de l’adolescent: Essai sur la construction des structures ope´ratoires formelles [The growth of logical thinking from childhood to adolescence: An essay on the construction of formal operational structures] (A. Parsons & S. Milgram, Trans.). London: Routledge & Kegan Paul. Kalichman, S. C. (1991). Water levels, falling objects, and spiral tubes: An investigation of the general naivete hypothesis of physical task performance. Journal of Genetic Psychology, 152, 255–262. Karmiloff-Smith, A., & Inhelder, B. (1975). If you want to get ahead, get a theory. Cognition, 3, 195–212.
537
Kerzel, D. (2002). The locus of “memory displacement” is at least partially perceptual: Effects of velocity, expectation, friction, memory averaging, and weight. Perception & Psychophysics, 64, 680 – 692. Levine, M. W., & McAnany, J. J. (2005). The relative capabilities of the upper and lower visual hemifields. Vision Research, 45, 2820 –2830. McCloskey, M., & Kohl, D. (1983). Naive physics: The curvilinear impetus principle and its role in interactions with moving objects. Journal of Experimental Psychology: Learning, Memory, and Cognition, 9, 146 – 156. McCloskey, M., Washburn, A., & Felch, L. (1983). Intuitive physics: The straight-down belief and its origin. Journal of Experimental Psychology: Learning, Memory, and Cognition, 9, 636 – 649. Post, R. B., O’Malley, M. D., Yeh, T. L., & Bethel, J. (2006). On the origin of vertical line bisection errors. Spatial Vision, 19, 505–527. Proffitt, D. R., & Gilden, D. L. (1989). Understanding natural dynamics. Journal of Experimental Psychology: Human Perception and Performance, 15, 384 –393. Proffitt, D. R., Thomas, M. A., & O’Brien, R. G. (1983). The roles of contour and luminance distribution in determining perceived centers within shapes. Perception and Psychophysics, 33, 63–71. Roncato, S., & Rumiati, R. (1986). Naı¨ve statics: Current misconceptions on equilibrium. Journal of Experimental Psychology: Learning, Memory, and Cognition, 12, 361–377. Royer, F. L. (1981). Detection of symmetry. Journal of Experimental Psychology: Human Perception and Performance, 7, 1186 –1210. Rubin, N., Nakayama, K., & Shapley, R. (1996). Enhanced perception of illusory contours in the lower versus upper visual hemifields. Science, 271, 651– 653. Samuel, F., & Kerzel, D. Eye fixations while judging the equilibium state of objects. Manuscript in preparation. Scarisbrick, D. J., Tweedy, J. R., & Kuslansky, G. (1987). Hand preference and performance effects on line bisection. Neuropsychologia, 25, 695– 699. Shuren, J. E., Jacobs, D. H., & Heilman, K. M. (1997). The influence of center of mass effect on the distribution of spatial attention in the vertical and horizontal dimensions. Brain and Cognition, 34, 293–300. Siegler, R. S. (1978). Children’s Thinking: What Develops? Hillsdale, NJ: Lawrence Erlbaum Associates. Thomas, L., Pons, F., & de Ribaupierre, A. (1996). Attentional capacity and cognitive level in the balance task. Current Psychology of Cognition, 15, 137–172. Todd, J. T., & Warren, W. H., Jr. (1982). Visual perception of relative mass in dynamic events. Perception, 11, 325–335. Vishwanath, D., & Kowler, E. (2003). Localization of shapes: Eye movements and perception compared. Vision Research, 43, 1637–1653. Vos, P. G., Bocheva, N., Yakimoff, N., & Helsper, E. (1993). Perceived location of two-dimensional patterns. Vision Research, 33, 2157–2169. Wagemans, J. (1997). Characteristics and models of human symmetry detection. Trends in Cognitive Sciences, 1, 346 –352. Wenderoth, P. (1994). The salience of vertical symmetry. Perception, 23, 221–236. Whitaker, D., & McGraw, P. V. (1998). The effect of suprathreshold contrast on stimulus centroid and its implications for the perceived location of objects. Vision Research, 38, 3591–3599. Yakimoff, N., Bocheva, N., & Mitrani, L. (1990). Perceiving the center of irregular contour quadrangles. Spatial Vision, 5, 51–57.
(Appendix follows)
SAMUEL AND KERZEL
538
Appendix Center of Mass Calculation The objects are an assemblage of rectangles and/or triangles, forms that allow an easy computation of their masses (as represented by their areas) and the position of their centers of mass. For a rectangle, the mass is the product of its length and width and the position of its center of mass is at the intersection of its diagonals. For a triangle, the mass is one-half of the length of the base times the height; its center of mass is at the crossing of its medians (i.e., the lines that go from one vertex to the midpoint of the opposite side). The center of mass of the whole object is the mean position of all centers of mass, weighed by their masses.
Construction of the Objects in Experiment 1 We constructed objects with the vertices A to H (Figure 5). Point A is fixed; point E is fixed vertically (i.e., the object height is constant) and varies horizontally according to eccentricity, that is, the line segment AE is at an angle of 0°, 5°, or 10° in comparison to the vertical through point A. The points C, D, F, and G vary according to the top/bottom size ratio and they co-vary horizontally with point E. Point B is set according to two constraints: First, the angle between the horizontal and line segment AB varies such that the angle to the right of the object base is either 55°, 45°, or 35°; second, the length of line segment AB is varied in a systematic way, such that smaller base angles, as well as eccentric tops are combined with shorter AB line segments in order to obtain right object halves that are not too bulky. The point
Figure 6. Examples of object construction for the Experiment 2: The 0.1 blu object of the series r20e1 and the 0.9 blu object of the series r30e2. The dots with arrows represent the centers of mass and their positions in relation to the object base.
H is on a line that is perpendicular to the line segment AB. The position of H on this line is found by changing its position iteratively such that, under the aforementioned constraints, the center of mass of the whole object is exactly above the point of support.
Construction of the Objects in Experiment 2
Figure 5. Examples of object construction for Experiment 1: The first object has a small top that is at 0° eccentricity (it is above the center of mass); the angle to the right of the object base is 55°. The second object has a large top that is at 10° eccentricity; the angle to the right of the object base is 35°. The dots with arrows represent the centers of mass and their positions in relation to the object base, which shows that the objects are represented in their equilibrium orientation.
We constructed objects with the vertices A to H and points of construction I and J (Figure 6). The points A B, C, I, and H are fixed according to the ratio variation (narrow and wide objects), the point F is fixed vertically (i.e., the object height is constant). Point F is varied horizontally in a stepwise manner; for the series with an eccentric top, F is offset one step more than for the series with the less eccentric top. Point G too is varied horizontally in a systematic way (but to a lesser extent than point F); on the vertical axis, point G is positioned by changing the angle between line segment FG and the horizontal in a stepwise manner. Each of these systematic variations tends to transform the balanced object into an unbalanced one. The point E is positioned so that the line segment EF is perpendicular to the line segment FG and has the same length as the line segment AB. The point J is the intersection of the line through point E that is perpendicular to EF and the vertical line through B. The point D is on the line segment EJ and its position on this segment is found by varying its position iteratively until the desired equilibrium state is produced (in 0.1 blu steps exactly). Received July 31, 2009 Revision received November 5, 2009 Accepted November 5, 2009 䡲