Issues Around Creating a Reusable Learning Object to Support Statistics Teaching Mollie Gilchrist Coventry University, UK
[email protected] Abstract: Although our health professional students have some experience of simple charts, such as pie and bar, and some intuition of histograms, they do not appear to have much knowledge or understanding about box and whisker plots and their relation to the data they are describing or compared to histograms. The boxplot is a versatile charting tool, useful for presenting data from surveys and any other projects, where a reasonable quantity of data has been collected. An opportunity arose to create a reusable learning object (RLO) to describe, explore, and interpret boxplots, especially in relation to their data and summary statistics. Examples included interprofessional learning, as this was the main remit of the Centre for Excellence in Teaching and Learning, from which funding was obtained. The RLO is aimed at both undergraduate and post-graduate HP students, who would be able to use the resource flexibly, to augment their limited exposure to statistical techniques, and add to their appreciation of IP learning and working. The RLO includes animation and opportunities for students to interact with the resource. Existing, available 'real' data, collected as part of research projects concerning (IP) learning, as well as generated data, is used as illustrative material. This paper explores some of the issues raised during the creation of the RLO, and presents limited feedback from users. Issues raised include the working of the project team, delivery platform, copyright and intellectual property rights and software incompatibilities. To date, feedback from colleagues and students has been very positive and has encouraged further improvements. The creation of this RLO has been a longer and more time-consuming experience than anticipated, and has highlighted the importance of a team approach, with constant reviewing. It will be interesting to see how the RLO will be used, and usage will be evaluated in the future. Keywords: Reusable learning object, Box and whisker plot, Boxplots, Interprofessional learning
1. Background There has been a long tradition of teaching statistics as part of the mathematics curriculum in schools and colleges, in terms of routine calculation of averages and drawing various charts, but it is questionable whether this forms an effective basis for future working and studying (Meletiou-Mavrotheris and Mavrotheris 2007). In higher education for non-statisticians, for example health professional (HP) students, little of this previous learning appears to translate into skills to aid reasoning, appreciation and interpretation of the results of research projects, necessary for their studies and to provide evidence to inform practice. In addition, for students following a health professional course at Master's level, in my own institution there is only a small amount of time available in a very full curriculum to devote to data analysis, so use of e-learning was considered as a way forward to supplement classroom teaching. Although use of e-learning can provide a flexible and additional way of studying, it does require time and effort to produce good, informative resources, so when an opportunity to fund some of the costs involved in the making of a learning object (LO) arose, this seemed to be an ideal subject area to consider. Funding was made available in the UK by the Higher Education Funding Council for England to set-up several Centres for Excellence in Teaching and Learning (CETLs). The main aims of the CETL initiative are to reward excellent teaching practice and to deliver substantial benefits to students, teachers and institutions (HEFCE 2005). This is arguably one of HEFCE's most ambitious initiatives, due to the subject spread of the Centres, the light touch approach adopted to monitoring and the substantial funding to 74 centres across England over a period of five years. The particular centre supporting this project encourages and assists the creation of LOs linked to Interprofessional (IP) learning, so there was a need to include an aspect of this in the LO. IP working and learning are of prime importance in current HP education due to the perceived desirability of improved teamwork, communication and collaboration, all found wanting in the recent past (CAIPE, founded 1987; Bristol Royal Infirmary 2002; Laming 2003). "Interprofessional education occurs when two or more professions learn with, from and about one another to facilitate collaboration in practice" (CAIPE 1997). There is widespread debate, as to what precisely constitutes a LO (Moisey et al 2006; Or-Bach 2005; Parrish 2004; Boyle 2003; Polsani 2003). Two commonly quoted definitions are: "a digitised entity which can be ISSN 1479-4403 271 ©Academic Conferences Ltd Reference this paper as: Gilchrist, M. “Issues around creating a reusable learning object to support statistics teaching.” The Electronic Journal of e-Learning Volume 5 Issue 4, pp. 271 - 278, available online at www.ejel.org
Electronic Journal e-Learning Volume 5 Issue 4 2007 (271-278)
used, reused or referred to during technology supported learning" (Rehak and Mason 2003), or "any digital resource which can be re-used to support learning" (Wiley 2003). The LOs can be stand-alone resources for an extra, more in-depth learning opportunity for skill acquisition, or 'triggers' for developing and expanding knowledge (Davidson and Courtney 2004). The key is in their ability to be used more than once to support learning, thus forming reusable LOs (RLOs). The extra appeal of using a digital resource over yet another paper handout is the ability to include activities, providing interaction via the computer between student and material to make a more engaging learning experience (Ally 2006). Of course, it does mean that access to a computer is required. Health professional (HP) students, involving qualified physiotherapists, occupational therapists, nurses, midwives, dieticians and acupuncturists, following a Master's degree in this university can study several research modules, including one exploring and doing data analysis. The first session of the quantitative part of this module looks at descriptive statistics. This classroom-based session assumes some basic knowledge of descriptive statistics, for example, an understanding of averages, measures of spread and simple charts. Personal experience has shown that, while our students have some knowledge of simple charts, such as pie, bar, and histograms, they do not appear to have much understanding of 'box and whisker' plots (or 'boxplots') and their relation to the data they are describing, or compared to histograms. Many of our students are 'mature' and, hence, although these topics may be covered in the current national school curriculum, they may not have been exposed to this topic before. This provided an additional need to produce supplementary learning material around the topic of boxplots, which could be used in a flexible way, as, in teaching sessions, there is often insufficient time available to do justice to many aspects of this useful chart, including interpreting and drawing conclusions, rather than just constructing the chart using appropriate software, for example the Statistical Package for Social Sciences (SPSS) (Pfannkuch 2006).
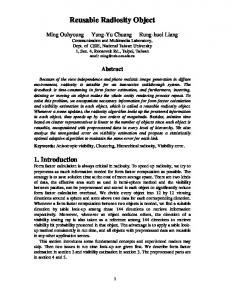
minimum value
lower quartile
median
upper quartile
maximum value
Figure 1: A simple diagram of a boxplot A boxplot is a pictorial representation of a dataset, showing the minimum and maximum values of the dataset, and also the median, lower and upper quartiles. Figure 1 shows a simple horizontal boxplot. The boxplot is a versatile charting tool, useful for presenting data from surveys and any other projects, where a reasonable quantity of data have been collected. Thus, the aim of this project was to create a RLO, which describes, explores, and interprets boxplots, especially in relation to data and summary statistics, with links to IP learning. The material is aimed primarily at post-graduate HP students, who would be able to use the resource flexibly, to augment their limited exposure to statistical techniques. It would also draw on some of the wealth of material available online to support a more in-depth look at boxplots (Hunt & Tyrrell 2005; Education Queensland 1997). It was considered that interested undergraduate students, following an evidence-based module, would also find the resource useful. This paper outlines some of the issues raised in the creation, and some evaluation, of the boxplots explored LO. The particular link to IP learning was established by using a figure containing a boxplot illustrating HP students' attitudes to IP learning (Pollard et al 2004). Many of the Master's students provide mentorship to undergraduate students when on placement, and thus are involved with IP education, as well as IP working. It was thought that this would provide a supplementary view on their IP learning. This link to IP learning does, however, limit use of the LO, although it is anticipated, that other disciplines could substitute content with their own relevant examples. In this, the LO can be considered as a RLO for exploring boxplots, plus the learning activity with a discipline link, to provide a unit of learning (Jones 2004; Koper 2003).
2. Project objectives It was intended that the LO would have basic information relating to boxplots; for example, definitions, interpretation of differently-shaped plots and their relation (comparing) to a histogram, another more commonly understood chart. There would also be self-tests and an application to IP. Finally links were made elsewhere, as, although LOs are designed to stand-alone, it was thought that links to further resources, for example web-sites, would encourage broader exploration, and provide additional opportunities for learning.
www.ejel.org
272
©Academic Conferences Ltd
Mollie Gilchrist
Overall, there was an intention to make the LO interesting and informative, thus promoting a desire to use it fully. Having agreed project funding, and 'buy-out' from main work, the following steps were taken: A project team was established
A time scale was proposed
A delivery vehicle was agreed
Existing material was reviewed
Additional resources to augment existing material were gathered
Communication with allocated learning technologist was established
Content was created and reassessed regularly
Content was critically appraised
Metadata was added and placed in the repository (CURVE)
The LO was piloted
An evaluation and peer review took place
Dissemination of the project experience and its use was monitored
Production of the RLO has been reviewed continuously and, although production began with existing material, elements and, particularly presentation, have evolved throughout the progression of the project. Struthers (2002) provides some useful insights into developing materials for online use, which can be applied to creating LOs, covering points around team building and working, and product development matters. She stresses the importance of the wide range of skills that are required to build online materials, offered by learning technologists (LTs) and subject specialists.
3. Issues This section discusses some issues arising while the 'boxplots explored' RLO was being created.
3.1 Project team The project team consisted of a member of the funding group, who was knowledgeable about IP, a LT, who had software experience, and the LO creator. Half a day a week was allocated for approximately 20 days for the project. It was intended that the time would be taken on an ad hoc basis, rather than exactly as prescribed. Regular meetings were arranged between the creator and the LT. At the first of these meetings the delivery vehicle for the LO was decided.
3.2 Access to the LO The University uses Blackboard General SystemTM as its virtual learning environment (VLE) and teaching staff can use Wimba Create (WC, formerly Course Genie®) to create web pages from Microsoft (MS) Word® documents (Wimba 2007). WC also allows academics to edit, update or repurpose content. The creator was experienced in using WC, so that was chosen, for delivery via the VLE. Another positive aspect of using WC is that it includes an accessibility checker, enabling content to be checked for compliance with the Disability Discrimination Act (1995), updated in 2005 (TechDis 2007). However, the WC choice did pose some difficulties for the graphical aspects, including diagrams and interactive sequences. The University is currently developing a repository (CURVE), allowing alternative access to LOs, outside the VLE.
3.3 Content planning Course content was planned with a 'storyboard'. This can take the form of an initial outline (see Figure 2) of the content and navigation, then filled-out in more detail and checked for accuracy, ease of understanding and where any activity, and in what form, might be incorporated. Working with a storyboard is a vital step in the production of e-learning materials, enabling logical routes and linking through the web pages to be explored. The design in this case was sequential, although pages were indexed, so that a user could return to any section at any time. It is time-consuming and indirectly expensive to keep returning to pages and editing at a later date, so it is very worthwhile to spend time at this stage. This was a lesson to the creator
www.ejel.org
273
ISSN 1479-4403
Electronic Journal e-Learning Volume 5 Issue 4 2007 (271-278)
enhanced with hindsight. Also, at the initial stage, it is vital to consider the audience for which the LO is intended, what content is desired and what resources will be required, including animation, use of audio and video. Introduction Example from literature Glossary of terms
Boxplot features & definitions
Example using a small dataset to illustrate features of a boxplot
Links to further resources All definitions supported by links to pop-ups Exploration & interpretation of published example
Interactive exercise
Example using a larger dataset to illustrate features of a boxplot
Back the original published example
Comparing subsets of data with a boxplot
Link to histogram Self-test
Figure 2: Outline of 'Boxplots Explored' learning object
3.4 Copyright To introduce users of the LO to a boxplot, a chart published in a journal was given as an initial example (Pollard et al 2004). At first, it was desired to include the published paper as a file in portable document format (pdf). This, however, involved copyright issues, as, although the chart had been created in-house, copyright had been handed-over to the journal publisher on acceptance of the paper, which included the chart, for publication. Under the Extended Copyright Licensing Agency Higher Education trial licence scheme any member would be able to freely download the paper, but once again, wide reuse of the LO would be compromised, as not all potential users would be members of the scheme (CLA 1982). An alternative would be to apply to the copyright holder for permission, but often this is a costly route. A decision was taken to reference the paper and use a digitised version of the chart in the LO. Copyright must be considered not only from the aspect of using existing material, whose copyright may be owned by another party, but also the creator's own, and institutional, copyright and intellectual property rights (IPR), when developing resources for others to use. Most universities and IT services have policies relating to these issues, and need to be explored. Further useful sources of information can also be found online (JISC Exchange for Learning (X4L) Programme 2002 - 2005). CIPeL has its own copyright agreement.
3.5 Pop-ups The next step in the LO, was a page illustrating the main features of a boxplot, with definitions of terms available via ‘pop-up’ windows. Pop-ups provide links to information, often displayed in a small window over the screen, which is currently being viewed. They can be displayed and closed when finished. This application of pop-ups is not to be confused with the extensive use for advertisements on the web, which can be annoying, and, hence, browsers offer the option to disable pop-ups. Novice users need to be alerted to this, so that they can enable pop-ups when using the LO. Definitions in the pop-ups were gathered together and displayed as a glossary page, with a link to a printable version for users to take away.
3.6 Presentation This definition page became very ‘busy’, and was considered to be too much to absorb at one time. Consequently, the content was reassessed, and became two pages. Figure 2 shows some of the initial content. This is where the choice of WC became a problem, in that it was not possible to create the image within WC, although programming with Macromedia Flash® enabled its accommodation (Macromedia 2007).
www.ejel.org
274
©Academic Conferences Ltd
Mollie Gilchrist
There are two issues needing consideration here. The first is in being very clear about what content is required. It is considered important that the technology does not drive the learning resource (Walker 2003), but a balance is sometimes needed between what is familiar and easily available with desired output. The second issue is that of communication between creator and LT/programmer. In general, the LT will not be familiar with the content of the LO, so that what may appear very clear, logical and straight-forward to the creator, may be interpreted differently by the LT, and hence, for example, different emphasis may be placed on the various elements of the LO. The use of Flash® may also limit the accessibility by some students with less powerful personal computers.
3.7 Content detail Existing teaching ideas and materials were available, so it was important to review these, edit and supplement where necessary. A dataset consisting of students' heights (cm) along with gender had already been created, so a small set of similar data was set-up to illustrate the calculation of some statistics illustrated in the boxplot, such as median and quartiles (Figure 1). This was presented as questions, with illustrated answers available via pop-ups. The next stage of the LO introduced the larger data set with comparisons of boxplot and histogram charts. These charts were created in SPSS v14, which imposed limitations on their presentation, due to restrictions in editing them in SPSS (SPSS 2007). Another factor constraining the presentation was the screen size available for display on most monitors.
3.8 External resources A self-test comparing boxplots and histograms was adapted from the excellent Exploring Data website from Central Queensland University (Education Queensland 1997), providing interactivity. It is considered important to have some interactive elements in a LO to involve the learner in the learning process (Lander 1999, Rehak and Mason 2003). Another small Flash® movie was embedded into the LO to emphasise the connection between and boxplot and histogram of the same data.
3.9 Interprofessional example After all this exploration of the charts, the attention of the user was drawn back to the IP aspect of the LO. The published chart was taken from one of a series of papers from a longitudinal study looking at attitudes of HP students to IP learning at the beginning of their course (Pollard et al 2004). Their attitude was measured using a validated scale consisting of several items with responses measured on a Likert scale, giving an individual, overall score for the all the students taking part. As well as seeing an application of a boxplot, it is intended that the students will gain more insight into IP education and working.
3.10 Other links The final sections provided a glossary of terms for reading and/or printing, and links to other resources, including warnings that new windows would open and instructions to close windows after use. In WC it is possible to create an ‘Include’, which is a ‘taster’ view of the web address of interest, showing the actual web page. Used judiciously, this is an excellent lead into further sources, enticing the user to explore further. It must be remembered though that any links included need to be checked regularly to ensure they are still active.
3.11 Expected usage of the tool From a pedagogic point of view, the LO had always been expected to be used as optional, additional teaching material, to be used flexibly by the student. It aimed to supplement classroom teaching, pooling ideas from other sources to maybe simplify, but not replace, the reading around process. Often it appears that busy, part-time students do not always find the time to explore additional material, and this LO has not been used as often as expected. However, some of this is due to the late of completion of the LO and its availability in their course. It also has to be remembered that users of an online resource will, in general, be working alone and not be able to get answers to questions by 'putting their hand up'. To overcome this, a high level of support needs to be built-into the resource. Anticipating areas of potential difficulties may be problematic for a creator who is familiar with the subject, and this is where external feedback from reviewers can be vital. Of course, the
www.ejel.org
275
ISSN 1479-4403
Electronic Journal e-Learning Volume 5 Issue 4 2007 (271-278)
creator may well have experienced 'frequently asked questions', answers to which can be incorporated into the LO.
3.12 Review and evaluation To date, the LO has been reviewed by colleagues, who teach and use statistics, with a favourable response to the content. Valuable suggestions to improve some of the detail and presentation of content were made and have been incorporated. Most recently, a colleague with online learning expertise has also viewed the learning resource, and made suggestions for its use as a RLO. This highlighted the need for external review, as, although the LO worked well as a supplement to the original teaching session, it would not stand-alone without prior learning, and some more definitions. It was decided to place a caveat on the first page, outlining necessary prior knowledge, in addition to the potential user. To include the necessary information in the current activity would increase the length of the LO, plus, as this knowledge is widely available elsewhere, it could be acquired relatively easily. Indeed, some undergraduate students used the LO before discussion had taken place around different charting tools, and only thought it useful after some preliminary dialogue. There has been limited evaluation by Master's students, as the LO has only just been completed towards the end of the last run of the data analysis module, for which the LO was created to supplement. However, so far, response has been very positive, and it is hoped that a more formal evaluation will take place in 2008. Some informal comments received so far regard the use of one of the visual elements "I LOVE the visual demonstration of the boxplot v histogram" and a dyslexic student has commented that he finds it easier to "assimilate information given in this way", ie via a computer screen, and wanted more of it please! Another student picked it up at the end of the module during revision and found it "… was useful to go through some really basic definitions which is the starting place for most stats work although some really basic stats knowledge was needed initially", and she "would still like more interpretations of information (with answers!) so that we know that we are on the right track". This last stresses the importance of earlier comments relating to using the resource for self-study when alone. A more recent student user reported that "I found it very useful & will definitely refer back to it in the future. I liked the 'test yourself' aspect too – good to check if it really has sunk in!". She also liked the pop-up definitions. As students use the LO, they will be asked to complete a questionnaire, provided by the CETL, covering general aspects of the RLO, such as ease of use, access issues, technical problems, helpful to learning. This will provide good feedback for the CETL, and some insight for the boxplot LO. However, it will also be important to find out if the LO has been successful in adding to the student's understanding of boxplots. There will be several different groups of students who will have access to the LO, and it is hoped to expose them differently to the LO. A short multiple choice test, relating to interpretation of information from a boxplot, has been developed, which will be used differently, depending on the mode of study of the students. For example, there will be time available for one of the groups studying at Master's level to take the test, use the LO in the classroom, and then to re-take the test. Another group will study the LO out of the classroom without tutor support available. It is hoped there will be a high proportion of involvement from these students. It may also be possible to arrange for volunteer students to work through it in a 'usability lab' where they are videoed. Both the student and their onscreen activities are recorded, so that it can be seen where they are having problems, or, hopefully, at what point they grasp the concepts and show understanding. Undergraduate students' learning will be more difficult to establish, as the LO will be one of many extra tasks they will be encouraged to explore.
3.13 Summary In summary, some issues that may arise when creating a LO have been outlined above. It is recommended that: Existing material already available is explored and augmented
The intended audience and pre-knowledge required is considered
The intended engagement with the resource is considered
Sufficient time for outlining content and developing a thorough storyboard is allowed
A team with a range of expertise in subject and online learning is assembled
Creation tools are considered thoroughly for appropriateness to both designer and user
www.ejel.org
276
©Academic Conferences Ltd
Mollie Gilchrist
Copyright and IPR issues are addressed
Content and presentation are reviewed regularly during creation
Time is allowed for new ideas to be assimilated or rejected
Time is allowed for evaluation, writing and dissemination
4. Reflection The creation of the LO has been a huge learning curve, with the realisation that just having an idea and some existing classroom material is not enough to create a good online learning resource! There are many aspects which need consideration, some of which have been outlined above. However, it is believed this learning object fits into the definition by Ally (2004) of "embodying instructional elements to foster understanding, facilitates the opportunity for self-reflection, and supports individual use" (47). It has been difficult to decide when the LO was finished. There has to come a time when the LO is deemed complete and placed into the repository, where LOs are stored for reuse. However, new ideas and suggestions may continually arise, and changes in policies may occur (for example, resuscitation guidelines), all requiring relevant LOs to be updated. Should this be done on a continual basis, or perhaps like books, new editions could be produced at regular intervals? One advantage of having material online, however, is that it is not as time-consuming or expensive to update, as, say, a book or a CD, in terms of replacing old versions. The question of where the responsibility lies for keeping LOs up-to-date also needs to be decided. One rationale behind the creation of RLOs, is the idea that others can use the resource 'off the shelf'. Resources can be shared and reused, thus providing cost-effectiveness. This LO was produced to support a particular learning situation, so is somewhat limited in its application. For wider reusability, maybe it needs to be regarded as a RLO related to boxplots plus a learning activity, which can be contextualised to discipline specific examples, so producing a unit of learning (Rehak and Mason, 2003). However, a problem with this approach is that the resource may still not be quite what is required by a tutor. Maybe a compromise is that a good RLO includes the possibility of being edited somewhat to suit personal requirements. Alternatively, the granularity (i.e. the individual elements) of the LO could be investigated, and the possibility of breaking it down into further smaller RLOs considered.
5. Conclusion This paper has described the need for a RLO around the exploration and interpretation of boxplots, and has discussed the creation of it, presenting some of the issues raised. It has looked at the steps and experiences along the way and provided helpful suggestions for future productions. Issues of production concerned content, delivery mode, copyright, creation of graphical and interactive elements, updating and reuse. It has certainly been a longer and more time-consuming experience than anticipated, and has highlighted the importance of reusability and a team approach, with constant reviewing. During the creation of this learning resource, a question has arisen as to whether it can truly be termed a RLO, or rather a LO plus a learning activity to make a unit of learning. Certainly it will be reusable in terms of HP students in the data analysis module it was intended to support, and for further learning opportunities in other modules where statistical charts are discussed. It is also expected that it will have a wider application by facilitating editing of the example from literature from IP to other relevant themes. The boxplots LO exhibits a granularity and structure which makes it useful for self-directed learning. It addresses a well-defined learning outcome but is small enough to fit into multiple teaching contexts (Parrish 2004). Overall, the creation of this RLO has been an enjoyable, although at times, a frustrating experience. It is hoped that users will gain from using the RLO, and its wider usage will be evaluated in the near future.
Acknowledgements Thanks are due to funding team, critical readers, student users and colleagues for their support, appraisal and suggestions. In particular, thanks are due to Paul Summers and Manjit Sohal for their programming and design concepts.
www.ejel.org
277
ISSN 1479-4403
Electronic Journal e-Learning Volume 5 Issue 4 2007 (271-278)
References Ally, M., Cleveleand-Innes, M., Boskic, N. and Larwill, S. (2006) Learners’ Use of Learning Objects. Journal of Distance Education, 21(2) 44-57. Boyle, T. (2003) Developing and delivering learning objects from a practitioner's point of view LTSN Generic Centre www.heacademy.ac.uk/resouces [accessed 11/01/08] Bristol Royal Infirmary (2001) The inquiry into the management of care of children receiving complex heart surgery at the Bristol Royal Infirmary Crown copyright http://www.bristol-inquiry.org.uk/ [accessed online 22/06/07] CAIPE http://www.caipe.org.uk/index.php?&page=mission&nav=1 CAIPE (1997) Interprofessional education - a definition. London:CAIPE Bulletin 13, p 19 CLA (1982) http://www.cla.co.uk [accessed 22/06/07] Davidson, A. and Courtney, K. (2004). Using and re-using electronic patient case studies to promote interprofessional learning. Proceedings WebCT Users European Conference, 16-18 Feb 2004, Amsterdam. Education Queensland (1997) Exploring Data Website http://exploringdata.cqu.edu.au/ HEFCE (2005) Centres for Excellence in Teaching and Learning http://www.hefce.ac.uk/learning/tinits/cetl/ [accessed 02/08/07]. Hunt, N. and Tyrrell, S. (2005) DISCUSS project, Coventry University, http://www.mis. coventry.ac.uk/~nhunt/home/about.html [accessed online 22/06/07] JISC Exchange for Learning (X4L) Programme (2002 – 2005) http://www.x4l.org/categories/ copyright.htm [accessed online 13/06/07] Jones, R. (2004) Designing adaptable learning resources with learning object patterns. Journal of digital information Vol. 6, No. 1, http://jodi.tamu.edu/Articles/v06/i01/Jones/ [accessed online 05/06/07] Koper, R. (2003) Combining reusable learning resources and services with pedagogically purposeful units of learning, in Littlejohn A (Ed) Reusing online resources: a sustainable approach to e-learning. Kogan Page, London Laming, Lord (2003) The Victoria Climbie inquiry report Crown copyright http://www.victoria-climbieinquiry.org.uk/finreport/finreport.htm [accessed online 22/06/07] Lander, D. (1999) Online Learning: Ways to Make Tasks Interactive. Royal Melbourne Institute of Technology ultiBASE publication. http://ultibase.rmit.edu.au/Articles/may99/ lander2.htm [accessed online 15/06/07] Learning from Bristol: the report of the public inquiry into children's heart surgery at the Bristol Royal Infirmary 1984 -1995 Command Paper: CM 5207 [accessed 22/06/07] Macromedia (2007) http://www.macromedia.com [accessed online 22/06/07] Meletiou-Mavrotheris, M. and Mavrotheris, E. (2007) Online Communities of Practice Enhancing Statistics Instruction: the European Project EarlyStatistics Electronic Journal of e-Learning 5(2) Moiset, S.D., Ally, M. and Spencer, B. (2006) Factors affecting the development and use of learning objects The American Journal of Distance Education 20(3) 143-161 Or-Bach, R. (2005) Learning objects and metadata – a suggested framework for learning activities Published in Conference proceedings of third International Conference on Multimedia and information and communications technologies in education (m-ICTE 2005) http://formatex.org/micte2006 [accessed online 23/05/07] Pfannkuch, M. (2006) Comparing box plot distributions: A teacher’s reasoning Statistics Education Research Journal, 5(2), 27-45 Parrish, P.E. (2004) The trouble with learning objects. ETR&D 52(1) 49-67 Pollard, K.C., Miers, ME and Gilchrist, M (2004) Collaborative learning for collaborative working? Initial findings from a longitudinal study of health and social care students. Health and Social Care in the Community Vol. 12, No. 4, pp 346-358 Polsani, P. (2003) Use and abuse of reusable learning objects Journal of digital information 3(4) http://jodi.tamu.edu/Articles/v06/i01/Polsani/ [accessed online 19/06/07] Rehak, D.R. and Mason R.D. (2003) Chapter3: Keeping the Learning in Learning Objects in Littlejohn, A. (Ed) Re-using online resources: a sustainable approach to e-learning. London. Kogan Page http://wwwjime.open.ac.uk/2003/1/reuse-05.html [accessed online 23/05/07] SPSS Inc. (2007) http://www.spss.com Struthers, J. (2002) Working models for online courses and materials LTSN Generic Centre www.heacademy.ac.uk/resources accessed 12/06/07] TechDis (2007) http://www.techdis.ac.uk [accessed online 12/06/07] Walker, M. (2003) Lessons in e-learning The Institute for Learning and Teaching in Higher Education http://www.heacademy.ac.uk/resources [accessed online [24/06/07] Wiley DA (2000) Connecting learning objects to instructional design theory: a definition, a metaphor, and a taxonomy, in DA Wiley (Ed) The instructional use of learning objects: online version. http://www.reusability.org/read/chapters/wiley.doc [accessed online 14/06/07] Wiley, D.A. (2003) Prepare for Impact: learning objects, learning communities and standards. Australasian WebCT Conference. Gold Coast Queensland Australia 21-23 September Wimba (2007) http://www.wimba.com [accessed online 11/01/08] Pfannkuch, M. (2006) Comparing box plot distributions: A teacher’s reasoning Statistics Education Research Journal, 5(2), 27-45
www.ejel.org
278
©Academic Conferences Ltd