www.ccsenet.org/ass
Asian Social Science
Vol. 8, No. 7; June 2012
KBE Frameworks and Their Applicability to a Resource-based Country: The Case of Brunei Darussalam Munshi Naser Ibne Afzal1 & Roger Lawrey1 1
Faculty of Business, Economics and Policy Studies, Universiti Brunei Darussalam, BE-1410, Brunei Darussalam Correspondence: Munshi Naser Ibne Afzal, Faculty of Business, Economics and Policy Studies, Universiti Brunei Darussalam, Jalan Tungku Link, BE-1410, Brunei Darussalam. Tel: 673-714-6601. E-mail:
[email protected] Received: February 8, 2012 doi:10.5539/ass.v8n7p208
Accepted: March 12, 2012
Published: June 1, 2012
URL: http://dx.doi.org/10.5539/ass.v8n7p208
Abstract Knowledge is generally considered to be one of the most important drivers of economic growth. The difference between a knowledge-based economy (KBE) and a resource-based one is that in the former, the main competition between individuals, firms, and countries is the ability to innovate. Other forms of competition, for example through pricing strategies and access to resources, become secondary. Generally, knowledge is information combined with technology that dramatically increases its impact when shared. Organizations such as the Organization for Economic Cooperation and Development (OECD), Asia Pacific Economic Cooperation Forum (APEC), Australian Bureau of Statistics (ABS) and the World Bank Institute (WBI) have developed different KBE frameworks to indicate the extent of countries’ knowledge base and implicitly to guide policy. But these frameworks have little in theoretical underpinnings and applying them universally across all countries in different regions, at different stages of development and with different institutional, social and economic characteristics may be misleading and result in inappropriate policy responses. In this paper we propose a framework that clearly distinguishes input-output indicators of a knowledge-based economy under four important dimensions: knowledge acquisition, knowledge production, knowledge distribution and knowledge utilization, and attempt to adapt them in a practical policy oriented approach for an economy like Brunei Darussalam, which is attempting to transform from a resource-based to a knowledge-based economy. Keywords: KBE frameworks, policy focus framework, input-output indicators, knowledge dimensions, Brunei 1. Introduction and Background of KBE Frameworks Knowledge economy and knowledge-based economy (KBE) are often used synonymously. ‘Knowledge economy’ is the older of the two concepts, with its origins in the 1950s when Machlup started his research on the knowledge economy framework for the United States (Leydesdorff & Cooke, 2003). However, the importance of knowledge as a driver of economic growth was recognized long before this. Although it was not explicitly termed knowledge economy at the time, many economists began to realize the importance of knowledge in the late 19th century. Alfred Marshall suggested that “knowledge is our most powerful engine of production” and that organization facilitates the growth of knowledge (Marshall, 1890, p.115).The OECD currently defines KBEs as “economies which are directly based on the production, distribution and use of knowledge and information” (OECD, 1996, p.11). This approach to defining KBE is reflected in the World Bank and APEC approaches. The scope of KBE is vast, but the analytical tools, precise theoretical background and development process of indicators for mapping and measuring KBE performance are loose at best (Daugeliene & Krisciunas, 2006). The impact of knowledge as a driver of economic growth was recognized and developed by the Austrian school in analysis of growth and entrepreneurship in the early 20th century. Schumpeter considered the “new combination of knowledge” as an important element for innovation and entrepreneurship (in Cader, 2008). The Schumpeterian concept of “creative destruction” postulates that economic growth occurs by knowledge creation and innovative companies grow while firms that fail to innovate are destroyed (Schumpeter, 1942). Another Austrian, Machlup (1962), was concerned with the intensity of the highly-skilled labor force and measured the knowledge intensity of different sectors of U.S. economy (Cader, 2008). Machlup, who first built a formal KBE framework, considered
208
ISSN 1911-2017
E-ISSN 1911-2025
www.ccsenet.org/ass
Asian Social Science
Vol. 8, No. 7; June 2012
six subsectors in the production sector of the economy: i) education, ii) research and development (R&D), iii) artistic creation, iv) information technology, v) information services and vi) communication media. In general, Machlup highlighted the significance of knowledge production for economic growth through competition, sharing and diffusion in modern economics and has stimulated subsequent research into the knowledge economy framework. For instance in 1974 Hayek in his Nobel Prize lecture (The Pretence of Knowledge) said “people learn by doing and acquire new knowledge through the competitive market process. Therefore, the competitive market process, from the Austrian perspective, has led to beneficial interaction among market participants. This process, over time, reduces ignorance to manageable levels for economic agents, promotes the discovery of knowledge that was not previously available and could contribute to economic growth” (in Lin, 2006, p.326). The emphasis on free markets is very important for the Austrian School and was in contrast to the Keynesian approach that was dominant at the time of Schumpeter’s work. The basic premise of Hayek and others of the Austrian School is that the economy is too complex to model but can be explained through systematic verbal argument, and the free market economy will automatically move to a more knowledge-based economy. Research continues on the knowledge economy in an attempt to measure knowledge in KBEs by the new growth theory economists led by Romer (1986), Lucas (1988) and others (Lin, 2006). The core argument of KBE researchers is that investing in knowledge can increase the productive capacity of the other factors of production as well as transform them into new products and processes. The other key feature of the theory is that knowledge leads to increasing returns to scale in production. Conventional production functions assume diminishing returns to scale, where marginal costs increase. However in knowledge-intensive products, the fixed costs of production are large, but the variable costs of production are small (Lee, 2001). Since then, KBE research has developed to today’s modern KBE frameworks as detailed later in the paper (Cader, 2008). KBE research transcends disciplinary boundaries and researches from a sociological and cultural perspective also make valuable contributions to the study of transition. For example, Evers (2003) studied the social and cultural preconditions as well as consequences in reaching the stage of a knowledge society for Malaysia and Indonesia. In this paper we investigate the appropriateness of using mainstream KBE frameworks as developed by the OECD, WBI and APEC as the basis for policy formation in developing, non-OECD countries. We explore the case of Brunei Darussalam as an example. The paper is organized as follows: Section 2 reviews the KBE frameworks as developed by the OECD, APEC and WBI. Section 3 proposes a new approach to the KBE framework that could be used as a policy tool. Section 4 applies this framework to Brunei Darussalam. Conclusions and directions for future research are presented in Section 5. 2. Current KBE Frameworks The current literature offers few consistent methodological underpinnings to measure the knowledge level of a firm, region or economy. Leung (2004) notes that there is no internationally agreed framework for measuring a KBE, While the development of indices to measure knowledge is interesting, such indices are generally available only at the national level. More fundamentally they tend to be data-driven (using that data which is available across countries) rather than conceptually-driven e.g. “being based on a model of knowledge acquisition and use and relationships to innovation and economic performance” (Cader, 2008, p.120). Models of Comprehensive Knowledge Expression Assessments are presented by the OECD (from 1996), Atkinson and Court’s New Economy Index (1998), the World Bank (2002), the Australian Bureau of Statistics (ABS, 2002), APEC (2000), Harvard University framework and UNECE (Daugeliene & Krisciunas, 2006).The ABS (2002) states that most of these existing frameworks are generally descriptive in nature, in that they are defined in terms of the statistics presented rather than being derived on the basis of theory or empirical evidence. Our objective of this section is to review the various KBE frameworks and highlight some possible shortcomings. 2.1 OECD Framework In 1996, the OECD published the KBE project report, an early attempt to compile statistical indicators on KBEs. It published another compilation in 1999 and started releasing results from the two-year Growth Project in 2000. The impetus for the project was to discover the causes underlying differing economic growth rates of member nations during the 1990s. According to the OECD framework, the root of KBE has been formulated by Romer and Grossman who developed new growth theories to explain the forces which drive long-term economic growth. According to the neo-classical production function, marginal returns diminish as capital is accumulated in an economy, an effect which may be offset, however, by the flow of new technology. In new growth theory, knowledge can raise the marginal returns on investment, which can in turn contribute to the accumulation of knowledge in a positive loop. It does this by stimulating more efficient methods of production as well as new and improved products and services. There is thus the possibility of sustained increases in investment which can lead to continuous rises in a country’s sustainable growth rate. Knowledge can also spill over from one firm or industry to Published by Canadian Center of Science and Education
209
www.ccsenet.org/ass
Asian Social Science
Vol. 8, No. 7; June 2012
another, with new ideas used repeatedly at little extra cost. Such spill-over can ease the constraints placed on growth by the scarcity of capital. The OECD makes the distinction between codified knowledge and tacit knowledge. Codified knowledge is the material, or information, to be transformed into documents, while tacit knowledge refers to the skills and know-how required for handling and interpreting codified knowledge. The principal knowledge indicators, as collected and standardized by the OECD, are: i)
expenditures on research and development (R&D);
ii)
employment of engineers and technical personnel;
iii)
patents; and
iv)
international balances of payments for technology.
The OECD Science, Technology and Industry (STI) Scoreboard consists of 76 indicators under five sub-titles: R&D and Innovation (15), Human Resources in Science and Technology (10), Patents (11), ICT (17), Knowledge Flows and the Global Enterprise (12), and The Impact of Knowledge on Productive Activities (11) (OECD, 2005). To sum up, as can be also seen from the dimensions and their indicators in Table-1A(Appendix-1), the OECD KBE focus is on interaction and positive externalities in ICT development, science and technology improvement and increasing globalization. Table 1A shows the indicators developed by the OECD to measure the extent of an economy’s knowledge base. The critical view of the OECD framework is that it is data-driven rather than based on sound theoretical concepts. This framework does not consider the inputs and outputs of new growth theory in any significant way instead selecting only variables under five key pillars. 2.2 The Asia Pacific Economic Cooperation (APEC) Framework The APEC (2000) framework was developed as part of a project commissioned by the APEC Economic Committee in mid-1999. The title of the project was Towards Knowledge-based Economies in APEC and it was conducted by a specially created KBE Task Force, members of which included Australia, Canada and Korea. The aim of the project was to ‘provide the analytical basis useful for promoting the effective use of knowledge, and the creation and dissemination of knowledge among APEC economies’ (APEC Economic Committee 2000). The APEC Economic Committee states that ‘the knowledge required by a knowledge-based society is wider than purely technological knowledge; for example it includes cultural, social and managerial knowledge’ (APEC 2000). They argue that there are four basic determinants of KBE for sustainable economic growth, as follows: a. Business Environment, b. ICT Infrastructure, c. Innovation System of research and development, d. Human Resource Development. Table 1A in (Appendix 01) shows the detailed list of APEC KBE indicators. Under these four key dimensions, many more detailed variables are used to measure the creation, dissemination and use of knowledge in APEC economies. Unlike the OECD and WBI frameworks, which consider many economies, APEC only considers seven APEC case study economies in order to explain KBE. These represent four clusters of APEC economies: • The Most Developed Economies (with Australia and Canada as case studies), • High Performing Asian Economies (with Singapore and Korea as case studies), • Asian Fast-Growing Economies (with Philippines and Thailand as case studies), and • Latin American Economies (with Chile as a case study). The case study economies were selected primarily on the basis of data available to the project team and their potential for generalisation to other similar APEC countries only (APEC, 2000). This process thus loses the robustness of applicability of the framework for other countries. 2.3 World Bank (WB) Framework The World Bank Institute (2002) has developed the Knowledge Assessment Methodology (KAM) as a KBE framework for its member states in order to indicate their level of knowledge-based economic development and as a policy input to the achievement of sustainable economic growth. They generally agree with the OECD and APEC frameworks of KBE and state that with sustained use and creation of knowledge at the centre of the
210
ISSN 1911-2017
E-ISSN 1911-2025
www.ccsenet.org/ass
Asian Social Science
Vol. 8, No. 7; June 2012
economic development process, an economy essentially becomes a Knowledge Economy. A Knowledge Economy (KE) is one that utilizes knowledge as the key engine of economic growth. It is an economy where knowledge is acquired, created, disseminated and used effectively to enhance economic development. It has been found that the successful transition to a Knowledge Economy typically involves elements such as long-term investments in education, R&D expenditure, developing innovation capability, modernizing the information infrastructure, and having an economic environment that is conducive to market transactions. These elements have been termed the pillars of the Knowledge Economy by the World Bank. More specifically, the four pillars of the Knowledge Economy (KE) according to the WBI framework are: a.
An economic incentive and institutional regime that provides good economic policies and institutions that permit efficient mobilization and allocation of resources, and stimulate creativity and incentives for the efficient creation, dissemination, and use of existing knowledge.
b.
Educated and skilled workers who can continuously upgrade and adapt their skills to efficiently create and use knowledge.
c.
An effective innovation system of firms, research centres, universities, consultants, and other organizations that can keep up with the knowledge revolution and tap into the growing stock of global knowledge and assimilate and adapt it to local needs.
d.
A modern and adequate information infrastructure that can facilitate the effective communication, dissemination, and processing of information and knowledge.
The Knowledge Economy framework thus asserts that investments in the four knowledge economy pillars are necessary for sustained creation, adoption, adaptation and use of knowledge in domestic economic production, which will consequently result in higher value- added goods and services. This would, putatively, increase the probability of economic success, and hence economic development, in the current highly competitive and globalized world. The WBI Knowledge Assessment Methodology (KAM) (www.worldbank.org/kam) is based on 83 structural and qualitative variables that serve as proxies for the four knowledge economy pillars: Overall Economic Performance (9), Economic Incentive and Institutional Regime Index (19), Innovation System Index (24), Education and Human Resources Index (19) and ICT Index (12). There are two frequently used modes of the KAM: The Basic Scorecard and Knowledge-based Economy Index. The World Bank KAM Basic Scorecard provides an overview of the performance of a country in terms of the pillars of the knowledge economy under 5 sub-titles. It includes 14 standard variables: two performance variables and 12 knowledge variables, with 3 variables representing each of the 4 pillars of knowledge economy. Table 1A (appendix-01) shows these indicators. According to the WBI, the knowledge economy can also be quantified by means of a numerical index known as the Knowledge Economy Index (KEI). This is calculated from the data of twelve indicators, each three of which form a single pillar. The KAM Knowledge Economy Index (KEI) is an aggregate index that represents the overall level of development of a country or region as a Knowledge Economy. It summarizes performance of the four Knowledge Economy pillars and is constructed as the simple average of the normalized values of the 12 knowledge indicators of the basic scorecard from 0 to 10. A KEI score that is close to 10 implies relatively good development of the four knowledge economy pillars as compared to other countries, while a score close to 0 indicates relatively poor development. The basic scorecard can be thus seen as a disaggregated representation of the Knowledge Economy Index. In general, all the contemporary KBE frameworks discussed above are constructed using available data and lack rigorous theoretical underpinnings. Moreover, each framework has a specific purpose related to the needs of the organisation’s member states. For instance, the World Bank has developed the KAM to show a country’s readiness to become a KBE, while the OECD focuses on innovation performance in its framework. The aim of the APEC Project was to provide the analytical basis useful for promoting the effective use of knowledge, and the creation and dissemination of knowledge among APEC economies. Comparing these three frameworks, the WBI system is the most comprehensive as it incorporates the important features of the OECD and APEC frameworks and considers KBE indicators into four broad pillars. Although KAM is designed for planners and policy makers engaged in national knowledge assessment, it can be used by anyone with an internet connection. In response to a user’s selection, the KAM generates reports that reveal how an economy compares with other countries on various aspects of the knowledge economy. In the World Bank KAM programme 140 countries are ranked on an ordinal scale, indicating the relative performance of countries as a knowledge economy. The World Bank’s internal databases and published datasets are particularly useful for KAM, but a wide range of publicly accessible data are
Published by Canadian Center of Science and Education
211
www.ccsenet.org/ass
Asian Social Science
Vol. 8, No. 7; June 2012
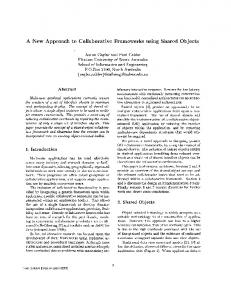
obtained from other organizations as well, among them Freedom House, the Heritage Foundation, the International Labour Organisation, the International Telecommunication Union, the U.S. Patent and Trademark Office, UNESCO’s Institute for Statistics, and the World Economic Forum. The KAM on the Web is continuously updated as new data become available. Thus, unlike OECD and APEC, WBI KAM is more inclusive in terms of data sources and number of countries in the world while defining current KBE frameworks. 3. An Alternative, Policy-focused KBE Framework As discussed in Section 2, the KBE indicators used by APEC, the OECD and the WBI are data-driven and designed with the organizations’ member countries interests in mind. Applying them universally across all countries in different regions, at different stages of development and with different institutional, social and economic characteristics may be misleading and result in inappropriate policy responses. In this paper we propose a framework that clearly distinguishes input-output indicators of a knowledge-based economy under four important dimensions: knowledge acquisition, knowledge production, knowledge distribution and knowledge utilization. The precise variables to be used under each dimension would be determined based on the circumstances of each individual country and availability of data. These variables are, perforce, not rigid but rather flexible and could be modified according to the needs of the respective countries. The modified analytical model is shown in Figure 1.
Input
Knowledge
Knowledge
acquisition 1.Oppenness (Exports + imports)/GDP 2. FDI inward flows as % GDP
Knowledge utilization
production
Knowledge distribution
1.Scientific R & D expenditure as % GDP
1.Education expenditure as % GDP
1.Technological R&D expenditure as % of GDP
2.Researchers per 1000 population
2. Net enrolment ratio at secondary school
3.Inteclactual Property Rights (IPR) Output
1.Competitiveness 2.HDI 3.Real GDP growth
Scientific publications per 1000 population
2.Business R&D expenditure in total R&D expenditure 3.Knowledge transfer rate
3.ICT spending as % GDP
4.FDI inflows %GDP
1.Tertiary education per 1,000 population.
1.Share of patent applications to EPO total.
2.PC penetration per 1,000 population 3.Internet host per 1,000 population
2.Exports of ICT products as % of total. 3.Production of HighTech sector as % of total GDP
Figure 1. A policy focus KBE framework In the above framework the top section of each box contains input indicators and the bottom of each box contains output indicators of KBE. Explicitly considering inputs and outputs of knowledge is not new. Many of the innovation case studies of the past twenty years are focused on a relatively small group of R&D-intensive sectors of the economy and emphasized a process of innovation that proceeds via a linear sequence of phases (Smith, 2000). In this view, innovation begins with new scientific research, progresses sequentially through stages of product development, production and marketing, and terminates with the successful sale of new products, processes and services (OECD, 1996). However, it is now recognised that sources of innovation are not limited to R&D but can stem from many areas, including new manufacturing capabilities and recognition of market needs. Innovation can assume many forms, including incremental improvements to existing products, applications of technology to new markets and uses of new technology to serve an existing market. And the process is not completely linear. Innovation requires considerable communication among different actors – firms, laboratories, academic institutions and consumers – as well as feedback between science, engineering, product development, manufacturing and marketing. Hence innovation can only be possible by the interaction of knowledge acquisition, production, distribution and utilization together in a Knowledge-based economy. As an example of the application of this framework, the potential acquisition of knowledge can be captured by the openness of an economy to the world in trade and foreign direct investment (FDI). The openness of an economy, as an input indicator, is measured as the ratio of a country’s trade (exports plus imports) and FDI inflows to its GDP.
212
ISSN 1911-2017
E-ISSN 1911-2025
www.ccsenet.org/ass
Asian Social Science
Vol. 8, No. 7; June 2012
For an output indicator concerning knowledge acquisition, we use the competitiveness of an economy as estimated by the World Competitiveness Yearbook rank and Human Development Index (HDI) rating. Regarding the production of knowledge, within an economy, the percentage share of expenditure on scientific R&D in GDP and number of researchers are input indicators and scientific publications are used as an output indicator. Distribution and utilization of knowledge are the other two basic dimensions of a knowledge-based economy. The distribution of knowledge includes all forms of disseminating or diffusing knowledge by way of information and communication technologies (ICT) and the transmission of knowledge by way of education. For education, expenditures on the levels of tertiary education and the net enrolment ratio of secondary schooling are used as input indicators while tertiary education enrolment is an output indicator. For ICT, expenditure as a percentage of GDP is an input indicator while personal computer (PC) penetration and the number of internet users per 1000 population are outputs. For knowledge utilization, scientific and technological R&D and business R&D expenditure are used as input indicators while patent applications, the shares of ICT production in GDP and exports of the high-tech sector as a percentage of GDP are used as output indicators. 4. A Case Study of a Resource-based Economy: Brunei Darussalam In this section we investigate the application of the model developed in Section 3 to the case of Brunei Darussalam (hereafter Brunei), which is striving to transform its economy from being almost completely resource-based to being, at least partly, a KBE. One of the major obstacles to assessing Brunei’s current position in ASEAN as a KBE is the limited amount of data available. This is likely to be the case with many developing nations and requires flexibility in the application of the model; some variables will have to be combined and others dropped or replaced in a pragmatic attempt to get real insights into the current status of knowledge development in the economy. 4.1 Current Socio-economic Panorama of Brunei Brunei is a small sultanate on the north coast of Borneo. In 2010, its population was estimated at approximately 414,000; its land area is 5,770 square kilometres and it is bordered by the East Malaysian state of Sarawak. The Brunei economy is largely dependent on oil and natural gas, which in 2009 accounted for 96% of exports, almost 90% of government revenue (Ministry of Finance, 2010) and 60% of GDP (Department of Economic Planning and Development, 2010, Lawrey, 2010a). Brunei is the third largest oil producer in S.E. Asia after Indonesia and Malaysia and a major liquefied natural gas (LNG) exporter. The remainder of the economy is dominated by the public sector with very little manufacturing and with agriculture, forestry and fisheries accounting for less than 2% of GDP. Despite a series of five-year development plans aimed at diversifying the economy, relatively high wages and low productivity make manufacturing uncompetitive and reinforce the dominance of the public sector. It is from this position of a country suffering from Dutch Disease or the resource curse hypothesis that Brunei is looking at the transition directly from a resource-based economy to a KBE. The most recent development plan includes a National Vision, or Wawasan Brunei 2035. In this, the Government has formulated four development thrusts: (i) widening the economic base and strengthening the foundation for a KBE with emphasis on knowledge, creativity and innovation; (ii) accelerating social progress and maintaining political stability to enhance the quality of life, maintain a sustainable and clean environment, strengthen national security and develop a disciplined and caring society; (iii) enlarging the pool of highly-skilled labour force; and (iv) strengthening institutional capacity (Malhotra, 2010). These policy goals are very much in line with the transition from a resource-based to a Knowledge-based economy with the overall goal of long run sustainable development. In order to show Brunei’s current status regarding knowledge acquisition, production, distribution and utilization we adopt the policy focus-framework as follows:
Knowledge production and distribution combined: under this dimension net enrolment ratio of secondary school students is used as the input variable and internet users per thousand populations is considered as an output variable.
Knowledge acquisition: FDI inflows can be used as an input and HDI ratings as an output variable.
Knowledge utilization: R&D expenditure can be used as an input and patents, export of ICT products as a percentage of total exports considered as an output variable.
Published by Canadian Center of Science and Education
213
www.ccsenet.org/ass
Asian Social Science
Vol. 8, No. 7; June 2012
4.2 Knowledge Production and Distribution Table 1. Net enrolment ratio in secondary schools, 2006-2007 (%) Country
2006
2007
Brunei Darussalam
90.1
89.1
Indonesia
60.4
67.5
Malaysia
80.8
81.8
Philippines
60.4
61.3
Thailand
71.0
76.1
Source: ADB key indicators-2007, Human Development Report 2006-07, MDG Indicators Report-2009, collected from ASEAN HQ, Jakarta In Table 1, the data shows that the net enrolment ratio in Brunei of 90.1% in 2006 and 89.1% in 2007 is the highest of the big ASEAN economies. This is a positive input for knowledge production in Brunei. Table 2. ASEAN internet service statistics: 2006-07 Internet users per 1000 population
Brunei
Malaysia
Singapore
Thailand
ASEAN
2006
416.9
542.3
345.9
130.7
96.9
2007
488.2
557.0
692.4
200.3
114.9
Source: ASEAN Connect website; Euro monitor, International Marketing Data and Statistics, 2001; MDG Database as of September 2010, collected from ASEAN HQ, Jakarta Table 2 indicates Brunei stands third in ASEAN for internet usage having 488.2 internet users per thousand populations in 2007 compared to the ASEAN average of 114.9. 4.3 Knowledge Acquisition Table 3. Foreign direct investments inflows into ASEAN by host country, 1995-2009 (US $ million) Country
1995-2009
Brunei Darussalam
10,103.1
Indonesia
40,404.8
Malaysia
68,059.8
Singapore
236,510.2
Thailand
88,079.9
ASEAN
525,159.0
Source: ASEAN Secretariat, ASEAN FDI database as of 30th June, 2010 Table 4. HDI 2006-07 Country
2006
2007
Brunei Darussalam
.919
.920
Indonesia
.729
.734
Malaysia
.825
.829
Singapore
.942
.944
Thailand
.786
.783
Philippines
.747
.751
Source: UNDP Development Report websites, July 2005, November 2006, ADB key Indicators 2006, 2007, 2008 As shown in Table 3, Brunei has the lowest FDI inflows compared to other ASEAN countries. Singapore stands highest in FDI inflows during the 1995-2009 periods in ASEAN. Moreover, the majority of Brunei’s FDI is related to the already well-established oil and gas industry rather than new investment. This is an area of concern for
214
ISSN 1911-2017
E-ISSN 1911-2025
www.ccsenet.org/ass
Asian Social Science
Vol. 8, No. 7; June 2012
knowledge acquisition. Table 4 shows that Brunei has a higher HDI rating in 2006-07 compared to other ASEAN countries. In 2007 Brunei’s HDI was .920 which was second after Singapore. The implication is that Brunei has performed well in knowledge acquisition despite low FDI inflows. But the reality is that Brunei’s high HDI ranking is largely due to the revenues from oil and gas exports and associated investments over the last 40 or so years and so is non-sustainable over the long-term. Moreover, the HDI index is an imperfect measure of the output of knowledge acquisition as it is mainly concerned with the socio-economic development of a country rather than innovation, or a country’s information and communication technology status. However, socio-economically Brunei is certainly in a good position, which is a precondition of KBE development. 4.4 Knowledge Utilization Table 5. ICT goods export (% of total goods exports) Country
2007
Brunei Darussalam
.189 (2006‐07)
Indonesia
5.25
Malaysia
41.64
Singapore
36.19
Thailand
22.23
Philippines
58.13
Source: World Development Indicators (WDI), 2010 In the case of knowledge utilization inputs, Brunei does not have data on R&D expenditure by either the government or business sector. Moreover on the output side, there is no data on patents or exports of high tech products. Therefore, we consider ICT goods exports as a percentage of total goods exports to show the knowledge utilization dimension for Brunei. Table 5 shows Brunei has the lowest ratio of ICT goods export which is only .189% compared to other ASEAN counterparts like Singapore at 36.19%, Malaysia 41.64%, and Philippines 58.13% in the year 2007. As we know, without knowledge utilization through commercialization of knowledge intensive products, a country’s long run sustainable growth, creating high-wage employment and generating higher returns to capital and labour is not possible. Hence, we can say Brunei is still under- performing in knowledge utilization. 5. Conclusion, Policy Implications and Future Research The main aim of this paper is to review the KBE concepts and frameworks developed by WBI, OECD and APEC and consider their applicability to an economy like Brunei, which is attempting to develop as a KBE. In this regard our study finds that the origin of the theoretical aspects of knowledge economy starts with the works of Austrian economists such as Schumpeter, Machlup, and Hayek. They basically argued for a laissez-fair economy where knowledge can be created by free interaction of economic agents of society. The more open an economy and the more free movement of information and new technology, the better the chance of creating new wealth of nations. However, with so little private sector activity in Brunei it seems unlikely that a laissez-fair approach will succeed at this stage of the country’s development. The problem for Brunei is that the likelihood of “organic” growth occurring in the private sector sufficient to make an impact on the macroeconomic performance of the economy appears remote. The challenge at the heart of Brunei’s economic performance is that future economic growth depends upon support from the government through continued public expenditure and possibly public private partnerships but growth is also hindered by a government that exercises too much bureaucratic control, takes away resources from the private sector, and creates a culture of dependency (see Lawrey 2010b). Regarding the use of KBE indicators to guide development policy, this paper has highlighted the shortcomings in the use of a universal approach across countries in different regions, at different stages of development and with different institutional, social and economic characteristics. Not only may this approach be theoretically questionable, but it may simply be impossible given the lack of consistent data in many developing countries. The more pragmatic approach used here is to see what data is available under the four WBI pillars and to attempt to make some policy recommendations based on the picture that emerges. In the case of Brunei, there is clearly much work to be done. Figures are unfavourable for Brunei concerning the dimensions of knowledge acquisition and utilization. Figures are not available for the dimension of knowledge production, but Brunei is performing well in HDI and school enrolment figures which are favourable for knowledge dissemination. Indeed, the education sector is a focal point of policy in Brunei. In 2008, Sistem Pendidikan Negara Abad Ke-21, (The National Education
Published by Canadian Center of Science and Education
215
www.ccsenet.org/ass
Asian Social Science
Vol. 8, No. 7; June 2012
System for the 21st Century SPN21) was introduced, which made major changes to education in Brunei in an attempt to meet the challenges of the 21st century. But what this exercise has shown is that there is substantially more to becoming a KBE than a good education system. If Brunei is to become a KBE, and if the WBI is even partly relevant for Brunei and countries like it, then policies should be directed at improving knowledge production, acquisition and utilization. The primary inputs for these indicators are FDI inflows and research and development, both in terms of the expenditure and number of researchers. While research funding has increased greatly in 2011 (Brunei Times Feb 11, 2011), it is too early to say if this level of funding will be sustained. Moreover, research capacity at the tertiary education level and in other research centres is very constrained. Moreover, FDI is basically non-existent outside the established oil and gas industry. It is in these areas that policy can be directed to increase the knowledge-based component of GDP. In conclusion, for the WBI and other organisations’ KBE indicators to be useful as a policy tool requires a more rigorous approach to establishing their significance than exists at present. Certainly, more work needs to be done in this area, especially regarding developing countries. As far as Brunei is concerned, this paper has established that, in as much as the four pillars of the WBI indicators are relevant for transition to a KBE, there is a considerable amount of work to be done especially regarding FDI and research and development funding. References APEC. (2000). Towards knowledge-based economies in APEC. APEC Economic Committee. Atkinson, R.D., & Court, R. H. (1998). The new economy index: understanding America's economic transformation. Progressive Policy Institute, Washington, DC. Australian Bureau of Statistics (ABS). (2002). Measuring a knowledge-based economy and society – an Australian framework. Discussion paper (cat. No. 1375.0) Brunei Times. (2011). Retrieved Feb 8, from www.bt.com.bn/news-national/.../18m-grants-ubd-research-studies Cader, H. A. (2008). The evolution of the knowledge economy. Journal of Regional Analysis &Policy, JRAP 38(2), 117-129. Daugeliene, R., & Krisciunas, K. (2006). The assessment models of knowledge-based economy penetration. Engineering Economics, 50(5), Economics of Engineering Decisions ISSN 1392-2785. Department of Economic Planning and Development. (2010). Brunei Darussalam statistical yearbook 2010. Brunei Darussalam: Prime Minister’s Office. Evers, H. D. (2003). Transition towards a knowledge society: Malaysia and Indonesia in comparative perspective. Comparative Sociology, 2(2), 355-373(19). Hayek, F. A. V. (1974). The pretence of knowledge. The Nobel Prize Lecture, December 11. Karahan, O. (2011). Input and output indicators of knowledge-based economy. 9th International Conference on Knowledge, Economy& Management Proceedings, June 23-25, 2011 Sarajevo- Bosnia & Herzegovina. Lawrey, R. (2010a). The Brunei economy. In Lynn Daniels (Ed.), The Far East and Australasia. Routledge, 2010. ISBN 10 1-85743-381-5. Lawrey, R. (2010b). An economist’s perspective on economic diversification in Brunei Darussalam. CSPS Strategy and Policy Studies Journal No. 1. Centre for Strategic and Policy Studies, Brunei Darussalam. Lee, K. S. (2001). Economic development through knowledge creation- the case of Korea. Proceedings of the 34th Hawaii International Conference on System Science, 2001. Leung, S. K. C. (2004). Statistics to measure the knowledge-based economy: The case of Hong Kong, China. Asia Pacific Technical Meeting on Information and Communication Technology (ICT) Statistics, Wellington. Leydesdorff, L., & Cooke, P. (2003). Regional development in the knowledge-based economy: the construction of advantage. Lin, C. B. (2006). A sustainable perspective on the knowledge economy: A critique of Austrian and mainstream views. Journal of Ecological economics, 60(2006), 324-332. Lucas Jr., R.E. (1988). On the mechanics of economic development. Journal of Monetary Economics, 22(1). http://dx.doi.org/10.1016/0304-3932(88)90168-7 Machlup, F. (1962). The Production and Distribution of Knowledge in the United States. Princeton, N.J.: Princeton University Press. 216
ISSN 1911-2017
E-ISSN 1911-2025
www.ccsenet.org/ass
Asian Social Science
Vol. 8, No. 7; June 2012
Malhotra, K. (2010). Department of economic planning and development. Government of Brunei Darussalam. Marshall, A. (1890). Principles of Economics. (8th ed). London: Macmillan. Ministry of Finance. (2010). Brunei Darussalam: fiscal and monetary review. Bandar Seri Begawan. June 2010. OECD. (1996). The knowledge-based economy. General distribution, OCDE/GD (96)102. OECD. (1999). The knowledge-based economy: A set of facts and figures. Paris. OECD. (2005). Science, technology and industry scoreboard: towards a knowledge-based economy. Paris. Romer, P. M. (1986). Increasing returns and long-run growth. The Journal of Political Economy, 94(5), 1002-1037. http://dx.doi.org/10.1086/261420 Schumpeter, J.R. (1942). Capitalism, Socialism and Democracy. New York: Harper & Row. Smith, K. (2000). Innovation indicators and the knowledge economy: concepts, results and policy challenges. STEP Group (Group for Studies in Technology, Innovation and Economic Policy), Storgaten 1 O155 Oslo, Norway. World Bank Institute. (2002). Programme on knowledge for development. Knowledge Assessment Methodology and Scorecards. Appendix: 01 Table 1A. OECD, APEC and WBI knowledge economy pillars and indicators OECD APEC WBI 1. Performance 1. Business Environment 1. Knowledge-Based Economy 1.1 Knowledge Investment 1.1 Knowledge based Industries 1.1 Average annual GDP growth (education, R&D and software) as % of GDP (%) as % of GDP 1.2 Services Exports as of GDP 1.2 Human Development Index 1.2 Education of the adult 1.3 High-Tech Exports as of GDP population as % of the population 1.4 Foreign Direct Investment aged 25-64 inward flow as % of GDP 1.3 R&D expenditure as a 1.5 Government transparency rating percentage of GDP by World Competitiveness 1.4 Basic research expenditure as a Yearbook percentage of GDP 1.6 Financial transparency rating by 1.5 Expenditure of Business R&D World Competitiveness Yearbook in domestic product of industry 1.7 Competition policy rating by 1.6 Expenditure of Business R&D World Competitiveness Yearbook in manufacturing 1.8 Openness rating by World 1.7 Share of services in R&D Competitiveness Yearbook expenditure 1.8 Expenditure on innovation as a share of total sales 1.9 Investment in venture capital as a percentage of GDP 2. Economic Incentive and 2.Information and Communication 2. ICT Infrastructure 2.1 Number of mobile telephones in Institutional Regime Technology use per 1000 inhabitants 2.1 ICT spending as % of GDP 2.1 Tariff and non-tariff barriers 2.2 Number of telephone mainlines 2.2 Regulatory Quality 2.2 PC penetration in households 2.3 Number of internet host per in use per 1000 inhabitants 2.3 Rule of Law 2.3 Number of computers per 1000 1000 inhabitants 2.4 Percentage share of ICT inhabitants 2.4 Number of internet users as % industries in GDP 2.5 Share of ICT in patents granted of population 2.5 Internet hosts per 10000 by USPTO 2.6 Expected e-commerce Revenues, M$US 3. Science and Technology Policies 3. Innovation System 3. Education and Human Resources 3.1 Publicly funded R&D as % of 3.1 Scientists Engineers in R&D per 3.1 Adult Literacy rate (%age 15 GDP million of the population and above) Published by Canadian Center of Science and Education
217
www.ccsenet.org/ass
3.2 Government R&D expenditure on health-defense-environment 3.3 Government R&D expenditure in total R&D expenditure 3.4 Business R&D expenditure in total R&D expenditure 3.5 Share of Government-Business R&D expenditure financed together 3.6 Tax subsidies rate for R&D
Asian Social Science
3.2 Full-time researchers per million of the population 3.3 Gross Expenditure on R&D (% of GDP) 3.4 Business Expenditure on R&D (% of GDP) 3.5 US Patents per annum 3.6 The number of technological cooperation among companies 3.7 The number of technological cooperation between company-university 4. Human Resource Development 4.1 Secondary enrolment (% of age group) 4.2 Natural Sciences Graduates per annum 4.3 Knowledge Workers (% of labor force) 4.4 Newspaper (per 1000 inhabitants) 4.5 Human Development Index
Vol. 8, No. 7; June 2012
3.2 Secondary Enrolment 3.3 Tertiary Enrolment
4. Globalization 4. Innovation System 4.1 Share of foreign affiliates in 4.1 Researchers in R-D, per million R&D populations 4.2 Share of foreign and domestic 4.2 Patent Applications granted by ownership in total inventions the USPTO, per million populations 4.3 Number of international 4.3 Scientific and technical journal technological alliances articles, per million populations 4.4 Percentage of scientific publications with a foreign co-author 4.5 Percentage of patents with a foreign co-investor 5. Information Infrastructure 5. Output and Impact 5.1 Scientific publications per 100 5.1 Telephones per 1000 persons, 000 population (telephone mainlines + mobile 5.2 Share of countries in total EPO phones) patent application 5.2 Computers per 1000 persons 5.3 Share of firm creating any 5.3 Internet Users per 10000 innovative output persons 5.4 GDP per employed person 5.5 Share of knowledge-based industries in total value added 5.6 Share medium-high technology industries in manufacturing export 5.7 Technology balance of payments as a percentage of GDP Source: OECD, (1999), “The Knowledge-Based Economy: A Set of Facts and Figures”, Paris, APEC, (2000), “Towards Knowledge-Based Economies in APEC”, APEC Economic Committee, World Bank Database, The Knowledge Assessment Methodology (KAM), website (www.worldbank.org/kam) (Cited in Karahan, 2011)
218
ISSN 1911-2017
E-ISSN 1911-2025