Definition 1 (Covariance Stationarity) The sequence {ei} is covariance stationary if ... still linear-unbiased as well as consistent, but they are no longer efficient (i.e., minimum ... New Developments in Kernel Regression with Correlated Errors.
Journal of Machine Learning Research 12 (2011) 1955-1976
Submitted 2/11; Revised 4/11; Published 6/11
Kernel Regression in the Presence of Correlated Errors Kris De Brabanter
KRIS . DEBRABANTER @ ESAT. KULEUVEN . BE
Department of Electrical Engineering SCD-SISTA K.U. Leuven Kasteelpark Arenberg 10 B-3001 Leuven, Belgium
Jos De Brabanter
JOS . DEBRABANTER @ ESAT. KULEUVEN . BE
Departement Industrieel Ingenieur - E&A KaHo Sint Lieven (Associatie K.U. Leuven) G. Desmetstraat 1 B-9000 Gent, Belgium
Johan A.K. Suykens Bart De Moor
JOHAN . SUYKENS @ ESAT. KULEUVEN . BE BART. DEMOOR @ ESAT. KULEUVEN . BE
Department of Electrical Engineering SCD-SISTA K.U. Leuven Kasteelpark Arenberg 10 B-3001 Leuven, Belgium
Editor: Xiaotong Shen
Abstract It is a well-known problem that obtaining a correct bandwidth and/or smoothing parameter in nonparametric regression is difficult in the presence of correlated errors. There exist a wide variety of methods coping with this problem, but they all critically depend on a tuning procedure which requires accurate information about the correlation structure. We propose a bandwidth selection procedure based on bimodal kernels which successfully removes the correlation without requiring any prior knowledge about its structure and its parameters. Further, we show that the form of the kernel is very important when errors are correlated which is in contrast to the independent and identically distributed (i.i.d.) case. Finally, some extensions are proposed to use the proposed criterion in support vector machines and least squares support vector machines for regression. Keywords: nonparametric regression, correlated errors, bandwidth choice, cross-validation, shortrange dependence, bimodal kernel
1. Introduction Nonparametric regression is a very popular tool for data analysis because these techniques impose few assumptions about the shape of the mean function. Hence, they are extremely flexible tools for uncovering nonlinear relationships between variables. Given the data {(x1 ,Y1 ), . . . , (xn ,Yn )} where xi ≡ i/n and x ∈ [0, 1] (fixed design). Then, the data can be written as Yi = m(xi ) + ei ,
i = 1, . . . , n,
c
2011 Kris De Brabanter, Jos De Brabanter, Johan A.K. Suykens and Bart De Moor.
(1)
D E B RABANTER , D E B RABANTER , S UYKENS AND D E M OOR
where ei = Yi − m(xi ) satisfies E[e] = 0 and Var[e] = σ2 < ∞. Thus Yi can be considered as the sum of the value of the regression function at xi and some error ei with the expected value zero and the sequence {ei } is a covariance stationary process. Definition 1 (Covariance Stationarity) The sequence {ei } is covariance stationary if • E[ei ] = µ for all i • Cov[ei , ei− j ] = E[(ei − µ)(ei− j − µ)] = γ j for all i and any j. Many techniques include a smoothing parameter and/or kernel bandwidth which controls the smoothness, bias and variance of the estimate. A vast number of techniques have been developed to determine suitable choices for these tuning parameters from data when the errors are independent and identically distributed (i.i.d.) with finite variance. More detailed information can be found in the books of Fan & Gijbels (1996), Davison & Hinkley (2003) and Konishi & Kitagawa (2008) and the article by Feng & Heiler (2009). However, all the previous techniques have been derived under the i.i.d. assumption. It has been shown that violating this assumption results in the break down of the above methods (Altman, 1990; Hermann, Gasser & Kneip, 1992; Opsomer, Wand & Yang, 2001; Lahiri, 2003). If the errors are positively (negatively) correlated, these methods will produce a small (large) bandwidth which results in a rough (oversmooth) estimate of the regression function. The focus of this paper is to look at the problem of estimating the mean function m in the presence of correlation, not that of estimating the correlation function itself. Approaches describing the estimation of the correlation function are extensively studied in Hart & Wehrly (1986), Hart (1991) and Park et al. (2006). Another issue in this context is whether the errors are assumed to be short-range dependent, where the correlation decreases rapidly as the distance between two observations increases or longrange dependent. The error process is said to be short-range dependent if for some τ > 0, δ > 1 σ2 ∞ and correlation function ρ(·), the spectral density H(ω) = 2π ∑k=−∞ ρ(k)e−iω of the errors satisfies (Cox, 1984) H(ω) ∼ τω−(1−δ) as ω → 0,
where A ∼ B denotes A is asymptotic equivalent to B. In that case, ρ( j) is of order | j|−δ (Adenstedt, 1974). In case of long-range dependence, the correlation decreases more slowly and regression estimation becomes even harder (Hall, Lahiri & Polzehl, 1995; Opsomer, Wand & Yang, 2001). Here, the decrease is of order | j|−δ for 0 < δ ≤ 1. Estimation under long-range dependence has attracted more and more attention in recent years. In many scientific research fields such as astronomy, chemistry, physics and signal processing, the observational errors sometimes reveal long-range dependence. K¨unsch, Beran & Hampel (1993) made the following interesting remark: “Perhaps most unbelievable to many is the observation that high-quality measurements series from astronomy, physics, chemistry, generally regarded as prototype of i.i.d. observations, are not independent but long-range correlated.” Further, since Kulkarni et al. (2002) have proven consistency for the data-dependent kernel estimators, that is, correlated errors and/or correlation among the independent variables, there is no need to alter the kernel smoother by adding constraints. Confirming their results, we show that the problem is due to the model selection criterion. In fact, we will show in Section 3 that there exists 1956
K ERNEL R EGRESSION IN THE P RESENCE OF C ORRELATED E RRORS
a simple multiplicative relation between the bandwidth under correlation and the bandwidth under the i.i.d. assumption. In the parametric case, ordinary least squares estimators in the presence of autocorrelation are still linear-unbiased as well as consistent, but they are no longer efficient (i.e., minimum variance). As a result, the usual confidence intervals and the test hypotheses cannot be legitimately applied (Sen & Srivastava, 1990).
2. Problems With Correlation Some quite fundamental problems occur when nonparametric regression is attempted in the presence of correlated errors. For all nonparametric regression techniques, the shape and the smoothness of the estimated function depends on a large extent on the specific value(s) chosen for the kernel bandwidth (and/or regularization parameter). In order to avoid selecting values for these parameters by trial and error, several data-driven methods are developed. However, the presence of correlation between the errors, if ignored, causes breakdown of commonly used automatic tuning parameter selection methods such as cross-validation (CV) or plug-in. Data-driven bandwidth selectors tend to be “fooled” by the correlation, interpreting it as reflecting the regression relationship and variance function. So, the cyclical pattern in positively correlated errors is viewed as a high frequency regression relationship with small variance, and the bandwidth is set small enough to track the cycles resulting in an undersmoothed fitted regression curve. The alternating pattern above and below the true underlying function for negatively correlated errors is interpreted as a high variance, and the bandwidth is set high enough to smooth over the variability, producing an oversmoothed fitted regression curve. The breakdown of automated methods, as well as a suitable solution, is illustrated by means of a simple example shown in Figure 1. For 200 equally spaced observations and a polynomial mean function m(x) = 300x3 (1 − x)3 , four progressively more correlated sets of errors were generated from the same vector of independent noise and added to the mean function. The errors are normally distributed with variance σ2 = 0.3 and correlation following an Auto Regressive process of order 1, denoted by AR(1), corr(ei , e j ) = exp(−α|xi − x j |) (Fan & Yao, 2003). Figure 1 shows four local linear regression estimates for these data sets. For each data set, two bandwidth selection methods were used: standard CV and a correlation-corrected CV (CC-CV) which is further discussed in Section 3. Table 1 summarizes the bandwidths selected for the four data sets under both methods. Table 1 and Figure 1 clearly show that when correlation increases, the bandwidth selected by CV becomes smaller and smaller, and the estimates become more undersmoothed. The bandwidths selected by CC-CV (explained in Section 3), a method that accounts for the presence of correlation, are much more stable and result in virtually the same estimate for all four cases. This type of undersmoothing behavior in the presence of positively correlated errors has been observed with most commonly used automated bandwidth selection methods (Altman, 1990; Hart, 1991; Opsomer, Wand & Yang, 2001; Kim et al., 2009).
3. New Developments in Kernel Regression with Correlated Errors In this Section, we address how to deal with, in a simple but effective way, correlated errors using CV. We make a clear distinction between kernel methods requiring no positive definite kernel and kernel methods requiring a positive definite kernel. We will also show that the form of the kernel, 1957
D E B RABANTER , D E B RABANTER , S UYKENS AND D E M OOR
Correlation level Independent α = 400 α = 200 α = 100
Autocorrelation 0 0.14 0.37 0.61
CV 0.09 0.034 0.0084 0.0072
CC-CV 0.09 0.12 0.13 0.13
6
6
5
5
4
4
Y , mˆ n (x)
Y , mˆ n (x)
Table 1: Summary of bandwidth selection for simulated data in Figure 1
3 2 1
3 2 1
0
0
−1
−1
−2 0
0.2
0.4
x
0.6
0.8
−2 0
1
0.2
6
5
5
4
4
Y , mˆ n (x)
Y , mˆ n (x)
6
3 2 1
−1
0.6
1
0.8
1
1
−1
x
0.8
2
0
0.4
0.6
3
0
0.2
x
(b) α = 400
(a) Uncorrelated
−2 0
0.4
0.8
−2 0
1
(c) α = 200
0.2
0.4
x
0.6
(d) α = 100
Figure 1: Simulated data with four levels of AR(1) correlation, estimated with local linear regression; full line represents the estimates obtained with bandwidth selected by CV; dashed line represents the estimates obtained with bandwidth selected by our method.
based on the mean squared error, is very important when errors are correlated. This is in contrast with the i.i.d. case where the choice between the various kernels, based on the mean squared error, is not very crucial (H¨ardle, 1999). In what follows, the kernel K is assumed to be an isotropic kernel. 1958
K ERNEL R EGRESSION IN THE P RESENCE OF C ORRELATED E RRORS
3.1 No Positive Definite Kernel Constraint To estimate the unknown regression function m, consider the Nadaraya-Watson (NW) kernel estimator (Nadaraya, 1964; Watson, 1964) defined as i K( x−x h )Yi
n
mˆ n (x) = ∑
i=1
∑nj=1 K(
x−x j , h )
where h is the bandwidth of the kernel K. This kernel can be one of the following kernels: Epanechnikov, Gaussian, triangular, spline, etc. An optimal h can for example be found by minimizing the leave-one-out cross-validation (LCV) score function LCV(h) =
�2 1 n � (−i) , Y − m ˆ (x ; h) n i i ∑ n i=1
(2)
(−i)
where mˆ n (xi ; h) denotes the leave-one-out estimator where point i is left out from the training. For notational ease, the dependence on the bandwidth h will be suppressed. We can now state the following. Lemma 2 Assume that the errors are zero-mean, then the expected value of the LCV score function (2) is given by # " i h �2 n � 1 2 n (−i) (−i) E[LCV(h)] = E ∑ m(xi ) − mˆ n (xi ) + σ2 − ∑ Cov mˆ n (xi ), ei . n n i=1 i=1 �
Proof: see Appendix A.
Note that the last term on the right-hand side in Lemma 2 is in addition to the correlation already included in the first term. Hart (1991) shows, if n → ∞, nh → ∞, nh5 → 0 and for positively correlated errors, that E[LCV(h)] ≈ σ2 + c/nh where c < 0 and c does not depend on the bandwidth. If the correlation is sufficiently strong and n sufficiently large, E[LCV(h)] will be minimized at a value of h that is very near to zero. The latter corresponds to almost interpolating the data (see Figure 1). This result does not only hold for leave-one-out cross-validation but also for Mallow’s criterion (Chiu, 1989) and plug-in based techniques (Opsomer, Wand & Yang, 2001). The following theorem provides a simple but effective way to deal with correlated errors. In what follows we will use the following notation Z ∞
k(u) =
−∞
K(y)e−iuy dy
for the Fourier Transform of the kernel function K. Theorem 3 Assume uniform equally spaced design, x ∈ [0, 1], E[e] = 0, Cov[ei , ei+k ] = E[ei ei+k ] = γk and γk ∼ k−a for some a > 2. Assume that (C1) K is Lipschitz continuous at x = 0; (C2) (C3)
R
R
R
K(u) du = 1, lim|u|→∞ |uK(u)| = 0, |K(u)| du < ∞, supu |K(u)| < ∞; |k(u)| du < ∞ and K is symmetric.
1959
D E B RABANTER , D E B RABANTER , S UYKENS AND D E M OOR
Assume further that boundary effects are ignored and that h → 0 as n → ∞ such that nh2 → ∞, then for the NW smoother it follows that # " �2 n � 4K(0) ∞ 1 (−i) + σ2 − E[LCV(h)] = E ∑ m(xi ) − mˆ n (xi ) ∑ γk + o(n−1h−1 ). (3) n nh − K(0) i=1 k=1 �
Proof: see Appendix B.
Remark 4 There are no major changes in the proof if we consider other smoothers such as PriestleyChao and local linear regression. In fact, it is well-known that the local linear estimate is the local constant estimate (Nadaraya-Watson) plus a correction for local slope of the data and skewness of the data point under consideration. Following the steps of the proof of Theorem 3 for the correction factor will yield a similar result. From this result it is clear that, by taking a kernel satisfying the condition K(0) = 0, the correlation structure is removed without requiring any prior information about its structure and (3) reduces to # " �2 n � 1 (−i) E[LCV(h)] = E ∑ m(xi ) − mˆ n (xi ) + σ2 + o(n−1 h−1 ). (4) n i=1 Therefore, it is natural to use a bandwidth selection criterion based on a kernel satisfying K(0) = 0, defined by hˆ b = arg min LCV(h), h∈Qn
where Qn is a finite set of parameters. Notice that if K is a symmetric probability density function, then K(0) = 0 implies that K is not unimodal. Hence, it is obvious to use bimodal kernels. Such a kernel gives more weight to observations near to the point x of interest than those that are far from x. But at the same time it also reduces the weight of points which are too close to x. A major advantage of using a bandwidth selection criterion based on bimodal kernels is the fact that is more efficient in removing the correlation than leave-(2l + 1)-out CV (Chu & Marron, 1991). Definition 5 (Leave-(2l + 1)-out CV) Leave-(2l + 1)-out CV or modified CV (MCV) is defined as � �2 1 n (−i) MCV(h) = ∑ Yi − mˆ n (xi ) , n i=1
(5)
(−i)
where mˆ n (xi ) is the leave-(2l + 1)-out version of m(xi ), that is, the observations (xi+ j ,Yi+ j ) for −l ≤ j ≤ l are left out to estimate mˆ n (xi ). Taking a bimodal kernel satisfying K(0) = 0 results in Equation (4) while leave-(2l + 1)-out CV with unimodal kernel K, under the conditions of Theorem 3, yields # " �2 ∞ n � 1 4K(0) (−i) E[MCV(h)] = E ∑ m(xi ) − mˆ n (xi ) γk + o(n−1 h−1 ). + σ2 − ∑ n nh − K(0) k=l+1 i=1 The formula above clearly shows that leave-(2l + 1)-out CV with unimodal kernel K cannot completely remove the correlation structure. Only the first l elements of the correlation are removed. 1960
K ERNEL R EGRESSION IN THE P RESENCE OF C ORRELATED E RRORS
Another possibility of bandwidth selection under correlation, not based on bimodal kernels, is to estimate the covariance structure γ0 , γ1 , . . . in Equation (3). Although the usual residual-based ˆ k is not a consistent estimator of ∑∞ estimators of the autocovariances γˆ k are consistent, ∑∞ k=1 γ k=1 γk (Simonoff, 1996). A first approach correcting for this, is to estimate ∑∞ γ by fitting a parametric k=1 k model to the residuals (and thereby obtaining estimates of γk ) and use these estimates in Equation (3) together with a univariate kernel. If the assumed parametric model is incorrect, these estimates can be far from the correct ones resulting in a poor choice of the bandwidth. However, Altman (1990) showed that, if the signal to noise ratio is small, this approach results in sufficiently good estimates of correlation for correcting the selection criteria. A second approach, proposed by Hart (1989, 1991), suggests estimating the covariance structure in the spectral domain via differencing the data at least twice. A third approach is to derive an asymptotic bias-variance decomposition under the correlated error assumption of the kernel smoother. In this way and under certain conditions on the correlation function, plug-ins can be derived taking the correlation into account, see Hermann, Gasser & Kneip (1992), Opsomer, Wand & Yang (2001), Hall & Van Keilegom (2003), FranciscoFern´andez & Opsomer (2004) and Francisco-Fern´andez et al. (2005). More recently, Park et al. (2006) proposed to estimate the error correlation nonparametrically without prior knowledge of the correlation structure. 3.2 Positive Definite Kernel Constraint Methods like support vector machines (SVM) (Vapnik, 1999) and least squares support vector machines (LS-SVM) (Suykens et al., 2002) require a positive (semi) definite kernel (see Appendix C for more details on LS-SVM for regression). However, the following theorem reveals why a bimodal kernel K˜ cannot be directly applied in these methods. ˜ satisfying K(0) ˜ Theorem 6 A bimodal kernel K, = 0, is never positive (semi) definite. �
Proof: see Appendix D.
Consequently, the previous strategy of using bimodal kernels cannot directly be applied to SVM and LS-SVM. A possible way to circumvent this obstacle, is to use the bandwidth hˆ b , obtained from the bimodal kernel, as a pilot bandwidth selector for other data-driven selection procedures such as leave-(2l + 1)-out CV or block bootstrap bandwidth selector (Hall, Lahiri & Polzehl, 1995). Since the block bootstrap in Hall, Lahiri & Polzehl (1995) is based on two smoothers, that is, one is used to compute centered residuals and the other generates bootstrap data, the procedure is computationally costly. Therefore, we will use leave-(2l + 1)-out CV or MCV which has a lower computational cost. A crucial parameter to be estimated in MCV, see also Chu & Marron (1991), is l. Indeed, the amount of dependence between mˆ n (xk ) and Yk is reduced as l increases. A similar problem arises in block bootstrap where the accuracy of the method critically depends on the block size that is supplied by the user. The orders of magnitude of the optimal block sizes are known in some inference problems (see K¨unsch, 1989; Hall, Horowitz & Jing, 1995; Lahiri, 1999; B¨uhlmann & K¨unsch, 1999). However, the leading terms of these optimal block sizes depend on various population characteristics in an intricate manner, making it difficult to estimate these parameters in practice. Recently, Lahiri et al. (2007) proposed a nonparametric plug-in principle to determine the block size. For l = 0, MCV is ordinary CV or leave-one-out CV. One possible method to select a value for l is to use hˆ b as pilot bandwidth selector. Define a bimodal kernel K˜ and assume hˆ b is available, then 1961
D E B RABANTER , D E B RABANTER , S UYKENS AND D E M OOR
one can calculate K˜
n
mˆ n (x) = ∑
i=1
�
x−xi hˆ b
∑nj=1 K˜
From this result, the residuals are obtained by
�
�
Yi
x−x j hˆ b
�.
(6)
eˆi = Yi − mˆ n (xi ), for i = 1, . . . , n and choose l to be the smallest q ≥ 1 such that n−q eˆ eˆ Φ−1 (1 − α ) ∑i=1 i i+q √ 2 , |rq | = ≤ ∑ni=1 eˆ2i n
(7)
where Φ−1 denotes the quantile function of the standard normal distribution and α is the significance level, say 5%. Observe that Equation (7) is based on the fact that rq is asymptotically normal distributed under the centered i.i.d. error assumption (Kendall, Stuart & Ord, 1983) and hence provides an approximate 100(1 − α)% confidence interval for the autocorrelation. The reason why Equation (7) can be legitimately applied is motivated by combining the theoretical results of Kim et al. (2004) and Park et al. (2006) stating that 1 n−q 1 n−q e ˆ e ˆ = ∑ i i+q n − q ∑ ei ei+q + O(n−4/5 ). n − q i=1 i=1 Once l is selected, the tuning parameters of SVM or LS-SVM can be determined by using leave(2l +1)-out CV combined with a positive definite kernel, for example, Gaussian kernel. We then call Correlation-Corrected CV (CC-CV) the combination of finding l via bimodal kernels and using the obtained l in leave-(2l + 1)-out CV. Algorithm 1 summarizes the CC-CV procedure for LS-SVM. This procedure can also be applied to SVM for regression. Algorithm 1 Correlation-Corrected CV for LS-SVM Regression ˆ b in Equation (6) with a bimodal kernel by means of LCV 1: Determine h 2: Calculate l satisfying Equation (7) 3: Determine both tuning parameters for LS-SVM by means of leave-(2l + 1)-out CV Equation (5) and a positive definite unimodal kernel.
3.3 Drawback of Using Bimodal Kernels Although bimodal kernels are very effective in removing the correlation structure, they have an inherent drawback. When using bimodal kernels to estimate the regression function m, the estimate mˆ n will suffer from increased mean squared error (MSE). The following theorem indicates the asymptotic behavior of the MSE of mˆ n (x) when the errors are covariance stationary. Theorem 7 (Simonoff, 1996) Let Equation (1) hold and assume that m has two continuous derivatives. Assume also that Cov[ei , ei+k ] = γk for all k, where γ0 = σ2 < ∞ and ∑∞ k=1 k|γk | < ∞. Now, as 1962
K ERNEL R EGRESSION IN THE P RESENCE OF C ORRELATED E RRORS
n → ∞ and h → 0, the following statement holds uniformly in x ∈ (h, 1 − h) for the Mean Integrated Squared Error (MISE) MISE(mˆ n ) =
R
µ22 (K)h4 (m′′ (x))2 dx R(K)[σ2 + 2 ∑∞ k=1 γk ] + + o(h4 + n−1 h−1 ), 4 nh
R
R
where µ2 (K) = u2 K(u) du and R(K) = K 2 (u) du. An asymptotic optimal constant or global bandwidth hˆ AMISE , for m′′ (x) 6= 0, is the minimizer of the Asymptotic MISE (AMISE) R
µ2 (K)h4 (m′′ (x))2 dx R(K)[σ2 + 2 ∑∞ k=1 γk ] AMISE(mˆ n ) = 2 + , 4 nh w.r.t. to the bandwidth, yielding �1/5 � ∞ 2 ˆhAMISE = R(K)[σR + 2 ∑k=1 γk ] n−1/5 . µ22 (K) (m′′ (x))2 dx
(8)
We see that hˆ AMISE is at least as big as the bandwidth for i.i.d data hˆ 0 if γk ≥ 0 for all k ≥ 1. The following corollary shows that there is a simple multiplicative relationship between the asymptotic optimal bandwidth for dependent data hˆ AMISE and bandwidth for independent data hˆ 0 . Corollary 8 Assume the conditions of Theorem 7 hold, then ∞
"
hˆ AMISE = 1 + 2 ∑ ρ(k) k=1
#1/5
hˆ 0 ,
(9)
where hˆ AMISE is the asymptotic MISE optimal bandwidth for dependent data, hˆ 0 is the asymptotic optimal bandwidth for independent data and ρ(k) denotes the autocorrelation function at lag k, that is, ρ(k) = γk /σ2 = E[ei ei+k ]/σ2 . �
Proof: see Appendix E.
Thus, if the data are positively autocorrelated (ρ(k) ≥ 0 ∀k), the optimal bandwidth under correlation is larger than that for independent data. Unfortunately, Equation (9) is quite hard to use in practice since it requires knowledge about the correlation structure and an estimate of the bandwidth hˆ 0 under the i.i.d. assumption, given correlated data. By taking hˆ AMISE as in Equation (8), the corresponding asymptotic MISE is equal to 2/5
AMISE(mˆ n ) = cDK n−4/5 , where c depends neither on the bandwidth nor on the kernel K and 2
DK = µ2 (K)R(K) =
�Z
� �Z �2 2 u K(u) du K (u) du . 2
1963
(10)
D E B RABANTER , D E B RABANTER , S UYKENS AND D E M OOR
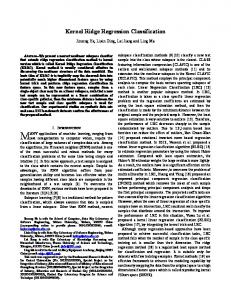
It is obvious that one wants to minimize Equation (10) with respect to the kernel function K. This leads to the well-known Epanechnikov kernel Kepa . However, adding the constraint K(0) = 0 (see Theorem 3) to the minimization of Equation (10) would lead to the following optimal kernel � Kepa (u), if u 6= 0; ⋆ K (u) = 0, if u = 0. Certainly, this kernel violates assumption (C1) in Theorem 3. In fact, an optimal kernel does not exist in the class of kernels satisfying assumption (C1) and K(0) = 0. To illustrate this, note that there exist a sequence Rof kernels {Kepa (u, ε)}ε∈]0,1[R, indexed by ε, such that Kepa (u) converges to K ⋆ (u) and the value of Kepa (u, ε)2 du decreases to K ⋆ (u)2 du as ε tends to zero. Since an optimal kernel in this class cannot be found, we have to be satisfied with a so-called ε-optimal class of bimodal kernels K˜ ε (u), with 0 < ε < 1, defined as � 3 2 4 4 (1 − u )I{|u|≤1} , |u| ≥ ε; K˜ ε (u) = 2 3 1−ε 4 − 3ε − ε3 |u| < ε. 4 ε |u|, For ε = 0, we define K˜ ε (u) = Kepa (u). Table 2 displays several possible bimodal kernel functions with their respective DK value compared to the Epanechnikov kernel. Although it is possible to express the DK value for K˜ ε (u) as a function of ε, we do not include it in Table 2 but instead, we graphically illustrate the dependence of DK on ε in Figure 2a. An illustration of the ε-optimal class of bimodal kernels is shown in Figure 2b. kernel function
Illustration
DK
0.8
0.6
Kepa
3 2 4 (1 − u )I{|u|≤1}
0.072
0.4
0.2
0 −1.5
−1
−0.5
0
0.5
1
1.5
2.5 2
K˜ 1
630(4u2 − 1)2 u4 I{|u|≤1/2}
1.5
0.374
1 0.5 0 −1
−0.5
0
0.5
1
0.5 0.4
K˜ 2
√2 u2 exp(−u2 ) π
0.3
0.134
0.2 0.1 0 −3
−2
−1
0
1
2
3
0.2
0.15
K˜ 3
1 2 |u|
exp(−|u|)
0.093
0.1
0.05
0 −8
−6
−4
−2
0
2
4
6
8
Table 2: Kernel functions with illustrations and their respective DK value compared to the Epanechnikov kernel. IA denotes the indicator function of an event A. Remark 9 We do not consider ε as a tuning parameter but the user can set its value. By doing this one should be aware of two aspects. First, one should choose the value of ε so that its DK 1964
K ERNEL R EGRESSION IN THE P RESENCE OF C ORRELATED E RRORS
0.9
0.22
0.8
0.2
0.7
0.18
0.6
K˜ ε (u)
0.24
DK
0.16 0.14
0.5 0.4
Epanechnikov
0.12
0.3
0.1
0.2
0.08
0.1
0.06 0
0.2
0.4
ε
0.6
0.8
1
0 −1.5
(a)
−1
−0.5
−ǫ
0
u
ǫ
0.5
1
1.5
(b)
Figure 2: (a) DK as a function of ε for the ε-optimal class of kernels. The dot on the left side marks the Epanechnikov kernel; (b) Illustration of the ε-optimal class of kernels for ε = 0.3. value is lower than the DK value of kernel K˜ 3 . This is fulfilled when ε < 0.2. Second, by choosing ε extremely small (but not zero) some numerical difficulties may arise. We have experimented with several values of ε and we concluded that the value taken in the remaining of the paper, that is, ε = 0.1 is small enough and it does not show any numerical problems. In theory, there is indeed a difference between kernel K˜ 3 and the ε-optimal class of bimodal kernels. However, in practice the difference is rather small. One can compare it with the i.i.d. case where the Epanechnikov kernel is the optimal kernel, but in practice the difference with say a Gaussian kernel is negligible.
4. Simulations In this Section, we illustrate the capability of the proposed method on several toy examples corrupted with different noise models as well as a real data set. 4.1 CC-CV vs. LCV with Different Noise Models In a first example, we compare the finite sample performance of CC-CV (with K˜ ε and ε = 0.1 in the first step and the Gaussian kernel in the second step) to the classical leave-one-out CV (LCV) based on the Epanechnikov (unimodal) kernel in the presence of correlation. Consider the following function m(x) = 300x3 (1 − x)3 for 0 ≤ x ≤ 1. The sample size is q set to n = 200. We consider two types of noise models: (i) an AR(5) process e j = ∑5l=1 φl e j−l + 1 − φ21 Z j where Z j are i.i.d. normal random variables with variance σ2 = 0.5 and zero mean. The data is generated according to Equation (1). The errors e j for j = 1, . . . , 5 are standard normal random variables. The AR(5) parameters are set to [φ1 , φ2 , φ3 , φ4 , φ5 ] = [0.7, −0.5, 0.4, −0.3, 0.2]. (ii) m-dependent models ei = √ √ 1+2ν+ 1−2ν r0 δi +√r1 δi−1√with m = 1 where δi is i.i.d. standard normal random variable, r0 = and 2 r1 = 1+2ν−2 1−2ν for ν = 1/2. Figure 3 shows typical results of LS-SVM regression estimates for both noise models. Table 3 summarizes the average of the regularization parameters γˆ , bandwidths hˆ and asymptotic squared error, defined as ASE = 1n ∑ni=1 (m(xi ) − mˆ n (xi ))2 , for 200 runs for both noise models. By looking at the average ASE, it is clear that the tuning parameters obtained by CC-CV result into better 1965
D E B RABANTER , D E B RABANTER , S UYKENS AND D E M OOR
estimates which are not influenced by the correlation. Also notice the small bandwidths and larger regularization constants found by LCV for both noise models. This provides clear evidence that the kernel smoother is trying to model the noise instead of the true underlying function. These findings are also valid if one uses generalized CV or v-fold CV. Figure 4 and Figure 5 show the CV surfaces 8
8 7 6 5
4
Y , mˆ n (x)
Y , mˆ n (x)
6
2
0
4 3 2 1 0
−2
−1 −4 0
0.2
0.4
x
0.6
0.8
−2 0
1
(a) AR(5)
0.2
0.4
x
0.6
0.8
1
(b) m-dependence models
Figure 3: Typical results of the LS-SVM regression estimates for both noise models. The thin line represents the estimate with tuning parameters determined by LCV and the bold line is the estimate based on the CC-CV tuning parameters.
AR(5) av. γˆ av. hˆ av. ASE
LCV 226.24 0.014 0.39 (2.9 × 10⁻² )
CC-CV 2.27 1.01 0.019 (9.9 × 10⁻⁴ )
m-dependence models LCV CC-CV 1.05 × 10⁵ 6.87 0.023 1.88 0.90 (8.2 × 10⁻² ) 0.038 (1.4 × 10⁻³ )
Table 3: Average of the regularization parameters γˆ , bandwidths hˆ and average ASE for 200 runs for both noise models. The standard deviation is given between parenthesis. for both model selection methods on the AR(5) noise model corresponding to the model selection of the estimate in Figure 3(a). These plots clearly demonstrate the shift of the tuning parameters. A cross section for both tuning parameters is provided below each surface plot. Also note that the surface of the CC-CV tends to be flatter than LCV and so it is harder to minimize numerically (see Hall, Lahiri & Polzehl, 1995). 4.2 Evolution of the Bandwidth Under Correlation Consider the same function as in the previous simulation and let n = 400. The noise error model is taken to be an AR(1) process with varying parameter φ = −0.95, −0.9, . . . , 0.9, 0.95. For each φ, 100 replications of size n were made to report the average regularization parameter, bandwidth and average ASE for both methods. The results are summarized in Table 4. We used the K˜ ε kernel with ε = 0.1 in the first step and the Gaussian kernel in the second step for CC-CV and the Gaussian kernel for classical leave-one-out CV (LCV). The results indicate that the CC-CV method is indeed capable of finding good tuning parameters in the presence of correlated errors. The CC-CV method 1966
K ERNEL R EGRESSION IN THE P RESENCE OF C ORRELATED E RRORS
0.4 0.6
1.4 1.2
0.5
0.2
1
LCV
LCV
LCV
0.3
0.4
0.1
0.8 0.6
0.3
0 2
0.4
4 6 −3.6
8
log(γ)
−3.4
−3.2
−3
−2.8
0.2 0.2 0.1 −4
log(h)
−3
−2
−1
0
1
0 −1
2
0
1
2
log(h)
(a)
3
4
5
6
log(γ)
(b)
(c)
3
0.37
0.6
0.368
2.5
0.2
0.366
CC-CV
0.4
CC-CV
CC-CV (l = 3)
Figure 4: (a) CV surface for LCV; (b) cross sectional view of log(h) for fixed log(γ) = 5.5; (c) cross sectional view of log(γ) for fixed log(h) = −3.6. The dot indicates the minimum of the cost function. This corresponds to the model selection of the wiggly estimate in Figure 3(a).
2
0.364
1.5
0 0 1
1
0.5
2
log(γ)
0 3
−0.5
log(h)
0.362
1
0.36
0.358
0.5 0 −4
0.356 −3
−2
−1
log(h)
(a)
(b)
0
1
2
0.354 −1
0
1
2
3
4
5
log(γ) (c)
Figure 5: (a) CV surface for CC-CV; (b) cross sectional view of log(h) for fixed log(γ) = 0.82; (c) cross sectional view of log(γ) for fixed log(h) = 0.06. The dot indicates the minimum of the cost function. This corresponds to the model selection of the smooth estimate in Figure 3(a). outperforms the classical LCV for positively correlated errors, that is, φ > 0. The method is capable of producing good bandwidths which do not tend to very small values as in the LCV case. In general, the regularization parameter obtained by LCV is larger than the one from CC - CV. However, the latter is not theoretically verified and serves only as a heuristic. On the other hand, for negatively correlated errors (φ < 0), both methods perform equally well. The reason why the effects from correlated errors is more outspoken for positive φ than for negative φ might be related to the fact that negatively correlated errors are seemingly hard to differentiate form i.i.d. errors in practice. 4.3 Comparison of Different Bimodal Kernels Consider a polynomial mean function m(xk ) = 300xk3 (1 − xk )3 , k = 1, . . . , 400, where the errors are normally distributed with variance σ2 = 0.1 and correlation following an AR(1) process, corr(ei , e j ) = exp(−150|xi −x j |). The simulation shows the difference in regression estimates (Nadaraya-Watson) based on kernels K˜ 1 , K˜ 3 and K˜ ε with ε = 0.1, see Figure 6a and 6b respectively. Due to the larger DK value of K˜ 1 , the estimate tends to be more wiggly compared to kernel K˜ 3 . The difference be1967
D E B RABANTER , D E B RABANTER , S UYKENS AND D E M OOR
φ -0.95 -0.9 -0.8 -0.7 -0.6 -0.5 -0.4 -0.3 -0.2 -0.1 0 0.1 0.2 0.3 0.4 0.5 0.6 0.7 0.8 0.9 0.95
γˆ 14.75 11.48 7.52 2.89 28.78 42.58 39.15 72.91 98.12 60.56 102.5 1251 1893 1535 482.3 2598 230.1 9785 612.1 448.8 878.4
LCV hˆ 1.48 1.47 1.39 1.51 1.52 1.71 1.55 1.68 1.75 1.81 1.45 1.22 0.98 0.66 0.12 0.04 0.03 0.03 0.03 0.02 0.01
av. ASE 0.0017 0.0017 0.0021 0.0024 0.0030 0.0031 0.0052 0.0055 0.0061 0.0069 0.0091 0.0138 0.0482 0.11 0.25 0.33 0.36 0.41 0.45 0.51 0.66
γˆ 7.65 14.58 18.12 6.23 5.48 87.85 39.02 19.76 99.56 101.1 158.4 209.2 224.6 5.18 667.5 541.8 986.9 12.58 1531 145.12 96.5
CC-CV hˆ 1.43 1.18 1.15 1.21 1.62 1.75 1.43 1.54 1.96 1.89 1.89 1.88 1.65 1.86 1.68 1.82 1.85 1.68 1.53 1.35 1.19
av. ASE 0.0019 0.0021 0.0031 0.0030 0.0033 0.0048 0.0060 0.0061 0.0069 0.0070 0.0092 0.0105 0.0160 0.0161 0.023 0.033 0.036 0.052 0.069 0.095 0.13
Table 4: Average of the regularization parameters, bandwidths and average ASE for 100 runs for the AR(1) process with varying parameter φ
tween the regression estimate based on K˜ 3 and K˜ ε with ε = 0.1 is very small and almost cannot be seen on Figure 6b. For illustration purposes we did not visualize the result based on kernel K˜ 2 . For the sake of comparison between regression estimates based on K˜ 1 , K˜ 2 ,K˜ 3 and K˜ ε with ε = 0.1, we show the corresponding asymptotic squared error (ASE) in Figure 7 based on 100 simulations with the data generation process described as above. The boxplot shows that the kernel K˜ ε with ε = 0.1 outperforms the other three.
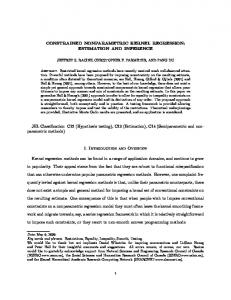
4.4 Real Life Data Set We apply the proposed method to a time series of the Beveridge (1921) index of wheat prices from the year 1500 to 1869 (Anderson, 1971). These data are an annual index of prices at which wheat was sold in European markets. The data used for analysis are the natural logarithms of the Beveridge indices. This transformation is done to correct for heteroscedasticity in the original series (no other preprocessing was performed). The result is shown in Figure 8 for LS-SVM with Gaussian kernel. It is clear that the estimate based on classical leave-one-out CV (assumption of no correlation) is very rough. The proposed CC-CV method produces a smooth regression fit. The selected parameters ˆ for LS-SVM are (15.61, 29.27) and (96.91, 1.55) obtained by CC-CV and LCV respectively. (ˆγ, h) 1968
K ERNEL R EGRESSION IN THE P RESENCE OF C ORRELATED E RRORS
5
4
4
Y , mˆ n (x)
Y , mˆ n (x)
5
3
3
2
2
1
1
0 0
0
0.2
0.4
x
0.6
0.8
1
0
0.2
0.4
(a)
x
0.6
0.8
1
(b)
Figure 6: Difference in the regression estimate (Nadaraya-Watson) (a) based on kernel K˜ 1 (full line) and K˜ 3 (dashed line). Due to the larger DK value of K˜ 1 , the estimate tends to be more wiggly compared to K˜ 3 ; (b) based on kernel K˜ 3 (full line) and ε-optimal kernel with ε = 0.1 (dashed line). 0.035 0.03
ASE
0.025 0.02 0.015 0.01
˜1 K
˜3 K
˜ǫ K
˜2 K
Figure 7: Boxplot of the asymptotic squared errors for the regression estimates based on bimodal kernels K˜ 1 , K˜ 2 , K˜ 3 and K˜ ε with ε = 0.1.
5. Conclusion We have introduced a new type of cross-validation procedure, based on bimodal kernels, in order to automatically remove the error correlation without requiring any prior knowledge about its structure. We have shown that the form of the kernel is very important when errors are correlated. This in contrast with the i.i.d. case where the choice between the various kernels on the basis of the mean squared error is not very important. As a consequence of the bimodal kernel choice the estimate suffers from increased mean squared error. Since an optimal bimodal kernel (in mean squared error sense) cannot be found we have proposed a ε-optimal class of bimodal kernels. Further, we have used the bandwidth of the bimodal kernel as pilot bandwidth selector for leave-(2l + 1)-out cross-validation. By taking this extra step, methods that require a positive definite kernel (SVM and LS-SVM) can be equipped with this technique of handling data in the presence of correlated errors since they require a positive definite kernel. Also other kernel methods which do not require positive definite kernels can benefit from the proposed method. 1969
D E B RABANTER , D E B RABANTER , S UYKENS AND D E M OOR
6 5.5
log(Y )
5 4.5 4 3.5 3 2.5 2 1500
1550
1600
1650
1700
1750
1800
1850
1900
x Figure 8: Difference in regression estimates (LS-SVM) for standard leave-one-out CV (thin line) and the proposed method (bold line).
Acknowledgments The authors would like to thank Prof. L´aszl´o Gy¨orfi and Prof. Ir`ene Gijbels for their constructive comments which improved the results of the paper. Research supported by Research Council KUL: GOA/11/05 Ambiorics, GOA/10/09 MaNet, CoE EF/05/006 Optimization in Engineering (OPTEC) en PFV/10/002 (OPTEC), IOF-SCORES4CHEM, several PhD/post-doc & fellow grants; Flemish Government: FWO: FWO: PhD/postdoc grants, projects: G0226.06 (cooperative systems and optimization), G0321.06 (Tensors), G.0302.07 (SVM/ Kernel), G.0320.08 (convex MPC), G.0558.08 (Robust MHE), G.0557.08 (Glycemia2), G.0588.09 (Brain-machine) research communities (WOG: ICCoS, ANMMM, MLDM); G.0377.09 (Mechatronics MPC), IWT: PhD Grants, Eureka-Flite+, SBO LeCoPro, SBO Climaqs, SBO POM, O&ODsquare, Belgian Federal Science Policy Office: IUAP P6/04 (DYSCO, Dynamical systems, control and optimization, 2007-2011), IBBT, EU: ERNSI; FP7-HD-MPC (INFSO-ICT-223854), COST intelliCIS, FP7-EMBOCON (ICT-248940), Contract Research: AMINAL, Other: Helmholtz, viCERP, ACCM. BDM is a full professor at the Katholieke Universiteit Leuven, Belgium. JS is a professor at the Katholieke Universiteit Leuven, Belgium.
Appendix A. Proof of Lemma 2 We first rewrite the LCV score function in a more workable form. Since Yi = m(xi ) + ei �2 1 n � Yi − mˆ (−i) (xi ) ∑ n i=1 � � �2 � 1 n (−i) (−i) 2 2 = ∑ m (xi ) + 2m(xi )ei + ei − 2Yi mˆ n (xi ) + mˆ n (xi ) n i=1 i2 1 n 1 n h (−i) + ∑ e2i = m(x ) − m ˆ (x ) n i i ∑ n i=1 n i=1 h i 2 n (−i) + ∑ m(xi ) − mˆ n (xi ) ei . n i=1
LCV(h) =
1970
K ERNEL R EGRESSION IN THE P RESENCE OF C ORRELATED E RRORS
Taking expectations, yields 1 E[LCV(h)] = E n
"
n
∑
i=1
�
�2 (−i) m(xi ) − mˆ n (xi )
#
+ σ2 −
h i 2 n (−i) Cov m ˆ (x ), e . n i i ∑ n i=1
Appendix B. Proof of Theorem 3 Consider only the last term of the expected LCV (Lemma 2), that is, A(h) = −
i h 2 n (−i) Cov m ˆ (x ), e n i i . ∑ n i=1 (−i)
Plugging in the Nadaraya-Watson kernel smoother for mˆ n (xi ) in the term above yields � � xi −x j n n K Yj h 2 � A(h) = − ∑ Cov ∑ n xi −xl , ei . n i=1 j6=i ∑l6=i K h
By using the linearity of the expectation operator, Y j = m(x j ) + e j and E[e] = 0 it follows that � x −x � i j n n K Y j h 2 � A(h) = − ∑ ∑ E n x −x ei n i=1 j6=i ∑ j6=i K i h l � � xi −x j n n K h 2 � E [ei e j ] . = − ∑∑ n l n i=1 j6=i ∑ j6=i K xi −x h
By slightly rewriting the denominator and using the covariance stationary property of the errors (Definition 1), the above equation can be written as � � xi −x j n n K h 2 � γ|i− j| . (11) A(h) = − ∑ ∑ n l n i=1 j6=i ∑ j=1 K xi −x − K(0) h
Let f denote the design density. The first term of the denominator can be written as � � n xi − xl = nh fˆ(xi ) ∑K h j=1 = nh f (xi ) + nh( fˆ(xi ) − f (xi )).
If conditions (C2) and (C3) are fulfilled, f is uniform continuous and h → ∞ as n → ∞ such that nh2 → ∞, then P | fˆ(xi ) − f (xi )| ≤ sup | fˆ(xi ) − f (xi )| −→ 0 as n → ∞, xi
P
due to the uniform weak consistency of the kernel density estimator (Parzen, 1962). −→ denotes convergence in probability. Hence, for n → ∞, the following approximation is valid nh fˆ(xi ) ≈ nh f (xi ). 1971
D E B RABANTER , D E B RABANTER , S UYKENS AND D E M OOR
Further, by grouping terms together and using the fact that xi ≡ i/n (uniform equispaced design) and assume without loss of generality that x ∈ [0, 1], Equation (11) can be written as � � n xi − x j 2 n 1 K A(h) = − ∑ γ|i− j| n i=1 nh f (xi ) − K(0) ∑ h j6=i � � � n−1 � 4 n−k k = − K γk . ∑ nh − K(0) k=1 n nh � � n−1 n−k k −1 −1 K nh γk = K(0) ∑∞ Next, we show that ∑k=1 k=1 γk + o(n h ) for n → ∞. Since the kernel n K ≥ 0 is Lipschitz continuous at x = 0 [K(0) +C2 x]+ ≤ K(x) ≤ K(0) +C1 x, where [z]+ = max(z, 0). Then, for K(0) ≥ 0 and C1 > C2 , we establish the following upperbound � � � �� � n−1 � n−1 � k k n−k k ∑ n K nh γk ≤ ∑ 1 − n K(0) +C1 nh γk k=1 k=1 ≤
n−1
n−1
k=1
k=1
k
∑ K(0)γk + ∑ C1 nh γk .
Then, for n → ∞ and using γk ∼ k−a for a > 2, n−1
n−1 1−a k k γk = C1 ∑ = o(n−1 h−1 ). nh nh k=1 k=1
C1 ∑ Hence, n−1 �
∑
k=1
� � � ∞ n−k k K γk ≤ K(0) ∑ γk + o(n−1 h−1 ). n nh k=1
For the construction of the lower bound, assume first that C2 < 0 and K(0) ≥ 0 then � � � �� � n−1 � n−1 � k k k n−k ∑ n K nh γk ≥ ∑ 1 − n K(0) +C2 nh γk . + k=1 k=1 Since C2 < 0, it follows that k ≤ n−1 �
∑
k=1
k 1− n
��
K(0) −C2 nh
k K(0) +C2 nh
and therefore
�
+
� � min n−1, K(0) −C nh �
γk =
∑
k=1
2
k 1− n
�� � k K(0) +C2 γk . nh
Analogous to deriving the upper bound, we obtain for n → ∞ � � � ∞ n−1 � k n−k ∑ n K nh γk ≥ K(0) ∑ γk + o(n−1 h−1 ). k=1 k=1 In the second case, that is, C2 > 0, the same lower bound can be obtained. Finally, from the upper and lower bound, for n → ∞, yields � � � n−1 � ∞ n−k k K γ = K(0) k ∑ n ∑ γk + o(n−1 h−1 ). nh k=1 k=1 1972
K ERNEL R EGRESSION IN THE P RESENCE OF C ORRELATED E RRORS
Appendix C. Least Squares Support Vector Machines for Regression Given a training set defined as Dn = {(xk ,Yk ) : xk ∈ Rd ,Yk ∈ R; k = 1, . . . , n}. Then least squares support vector machines for regression are formulated as follows (Suykens et al., 2002) n
min J (w, e) = 12 wT w + 2γ ∑ e2k w,b,e
s.t. Yk =
k=1 wT ϕ(xk ) + b + ek ,
(12) k = 1, . . . , n,
where ek ∈ R are assumed to be i.i.d. random errors with zero mean and finite variance, ϕ : Rd → Rnh is the feature map to the high dimensional feature space (possibly infinite dimensional) and w ∈ Rnh , b ∈ R. The cost function J consists of a residual sum of squares (RSS) fitting error and a regularization term (with regularization parameter γ) corresponding to ridge regression in the feature space with additional bias term. However, one does not need to evaluate w and ϕ explicitly. By using Lagrange multipliers, the solution of Equation (12) can be obtained by taking the Karush-Kuhn-Tucker (KKT) conditions for optimality. The result is given by the following linear system in the dual variables α !� � � � 1Tn 0 0 b = , 1n Ω + 1γ In α Y with Y = (Y1 , . . . ,Yn )T , 1n = (1, . . . , 1)T , α = (α1 , . . . , αn )T and Ωkl = ϕ(xk )T ϕ(xl ) = K(xk , xl ), with K(xk , xl ) positive definite, for k, l = 1, . . . , n. According to Mercer’s theorem, the resulting LS-SVM model for function estimation becomes n
mˆ n (x) =
∑ αˆ k K(x, xk ) + b,ˆ
k=1
where K(·, ·) is an appropriately chosen positive definite kernel. � � In this paper we choose K to be the −kxk −xl k2 −d/2 Gaussian kernel, that is, K(xk , xl ) = (2π) exp . 2h2
Appendix D. Proof of Theorem 6 We split up the proof in two parts, that is, for positive definite and positive semi-definite kernels. The statement will be proven by contradiction. ˜ This leads to a positive definite • Suppose there exists a positive definite bimodal kernel K. kernel matrix Ω. Then, all eigenvalues of Ω are strictly positive and hence the trace of Ω is always larger than zero. However, this is in contradiction with the fact that Ω has all zeros on its main diagonal. Consequently, a positive definite bimodal kernel K˜ cannot exist. ˜ Then, at least one eigenvalue • Suppose there exists a positive semi-definite bimodal kernel K. of the matrix Ω is equal to zero (the rest of the eigenvalues is strictly positive). We have now two possibilities, that is, some eigenvalues are equal to zero and all eigenvalues are equal to zero. In the first case, the trace of the matrix Ω is larger than zero and we have again a contradiction. In the second case, the trace of the matrix Ω is equal to zero and also the determinant of Ω equals zero (since all eigenvalues are equal to zero). But the determinant can never be zero since there is no linear dependence between the rows or columns (there is a zero in each row or column). 1973
D E B RABANTER , D E B RABANTER , S UYKENS AND D E M OOR
Appendix E. Proof of Corollary 8 From Equation (8) it follows that hˆ AMISE
2R(K) ∑∞ γk R(K)σ2 R R k=1 + = 2 2 nµ2 (K) (m′′ (x))2 dx nµ2 (K) (m′′ (x))2 dx � �1/5 σ2 R(K) 2 ∑∞ 5 k=1 γk ˆ R = h0 + 2 σ2 nµ2 (K) (m′′ (x))2 dx #1/5 " ∞ hˆ 0 . = 1 + 2 ∑ ρ(k) �
�1/5
k=1
References R.K. Adenstedt. On large sample estimation for the mean of a stationary sequence. Ann. Statist., 2(6):1095–1107, 1974. N.S. Altman. Kernel smoothing of data with correlated errors. J. Amer. Statist. Assoc., 85(411):749– 759, 1990. T.W. Anderson. The Statistical Analysis of Time Series. Wiley, New York, 1971. P. B¨uhlmann and H.R. K¨unsch. Block length selection in the bootstrap for time series. Computational Statistics & Data Analysis, 31(3):295310, 1999 S.-T. Chiu. Bandwidth selection for kernel estimate with correlated noise. Statist. Probab. Lett., 8(4):347–354, 1989. C.K. Chu and J.S. Marron. Comparison of two bandwidth selectors with dependent errors. Ann. Statist., 19(4):1906–1918, 1991. D.R. Cox. Long-range dependence: a review. In Proceedings 50th Anniversary Conference. Statistics: An Appraisal. pages 55–74, Iowa State Univ. Press. A.C Davison and D.V. Hinkley. Bootstrap Methods and their Application (reprinted with corrections). Cambridge University Press, 2003. J. Fan and I. Gijbels. Local Polynomial Modelling and Its Applications. Chapmann & Hall, 1996. J. Fan and Q. Yao. Nonlinear Time Series: Nonparametric and Parametric Methods. Springer, 2003. Y. Feng and S. Heiler. A simple bootstrap bandwidth selector for local polynomial fitting. J. Stat. Comput. Simul., 79(12):1425–1439, 2009. M. Francisco-Fern´andez and J.D. Opsomer. Smoothing parameter selection methods for nonparametric regression with spacially correlated errors. Canad. J. Statist., 33(2):279–295, 2004. M. Francisco-Fern´andez, M., J.D. Opsomer and J.M. Vilar-Fern´andez. A plug-in bandwidth selector for local polynomial regression estimator with correlated errors. J. Nonparametr. Stat., 18(1– 2):127–151, 2005. 1974
K ERNEL R EGRESSION IN THE P RESENCE OF C ORRELATED E RRORS
P. Hall, S.N. Lahiri and J. Polzehl. On bandwidth choice in nonparametric regression with both short- and long-range dependent errors. Ann. Statist., 23(6):1921–1936, 1995. P. Hall, J.L. Horowitz, and B.-Y. Jing. On blocking rules for the bootstrap with dependent data. Biometrika, 82(3):561574, 1995 P. Hall and I. Van Keilegom. Using difference-based methods for inference in nonparametric regression with time-series errors. J. Roy. Statist. Assoc. Ser. B Stat. Methodol., 65(2):443–456, 2003. W. H¨ardle. Applied Nonparametric Regression (Reprinted). Cambridge University Press, 1999. J.D. Hart and T.E. Wehrly. Kernel regression estimation using repeated measurements data. J. Amer. Statist. Assoc., 81(396):1080–1088, 1986. J.D. Hart. Differencing as an approximate de-trending device. Stoch. Processes Appl., 31(2):251– 259, 1989. J.D. Hart. Kernel regression estimation with time series errors. J. Royal Statist. Soc. B, 53(1):173– 187, 1991. E. Hermann, T. Gasser and A. Kneip. Choice of bandwidth for kernel regression when residuals are correlated. Biometrika, 79(4):783–795, 1992. M.G. Kendall, A. Stuart and J. K. Ord. The Advanced Theory of Statistics, vol. 3, Design and Analysis, and Time-Series (4th ed.). Griffin, London, 1983. T.Y. Kim, D. Kim, B.U. Park and D.G. Simpson. Nonparametric detection of correlated errors. Biometrika, 91(2):491–496, 2004. T.Y. Kim, B.U. Park, M.S. Moon and C. Kim. Using bimodal kernel inference in nonparametric regression with correlated errors. J. Multivariate Anal., 100(7):1487–1497, 2009. S. Konishi and G. Kitagawa. Information Criteria and Statistical Modeling. Springer, 2008. S.R. Kulkarni, S.E. Posner and S. Sandilya. Data-dependent kn -NN and kernel estimators consistent for arbitrary processes. IEEE Trans. Inform. Theory, 48(10):2785–2788, 2002. H. K¨unsch. The jackknife and the bootstrap for general stationary observations. Ann. Statist., 17(3):12171261, 1989. H. K¨unsch, J. Beran and F. Hampel. Contrasts under long-range correlations. Ann. Statist., 21(2):943–964, 1993. S.N. Lahiri. Theoretical comparisons of block bootstrap methods. Ann. Statist., 27(1):386404, 1999. S.N. Lahiri. Resampling Methods for Dependent Data. Springer, 2003. S.N. Lahiri, K. Furukawa, and Y.-D. Lee. A nonparametric plug-in rule for selecting optimal block lengths for block bootstrap methods. Statistical Methodology, 4(3):292321, 2007. E.A. Nadaraya. On estimating regression. Theory Probab. Appl., 9(1):141–142, 1964. 1975
D E B RABANTER , D E B RABANTER , S UYKENS AND D E M OOR
J. Opsomer, Y. Wang and Y. Yang. Nonparametric regression with correlated errors. Statist. Sci., 16(2):134–153, 2001. B.U. Park, Y.K. Lee, T.Y. Kim and C. Park. A simple estimator of error correlation in non-parametric regression models. Scand. J. Statist., 33(3):451–462, 2006. E. Parzen. On estimation of a probability density function and mode. The Annals of Mathematical Statistics, 33(3):10651076, 1962 A. Sen and M. Srivastava. Regression Analysis: Theory, Methods and Applications. Springer, 1990. J.S. Simonoff. Smoothing Methods in Statistics. Springer, 1996. J.A.K. Suykens, T. Van Gestel, J. De Brabanter, B. De Moor and J. Vandewalle. Least Squares Support Vector Machines. World Scientific, 2002. V.N. Vapnik. Statistical Learning Theory. John Wiley & Sons, 1999. G.S. Watson. Smooth regression analysis. Sankhy¯a Ser. A, 26(4):359–372, 1964.
1976