Kernel Smoothing Toolbox. â for MATLAB. Jan KolÑcek and Jirâ¤Ä± Zelinka. Contents. 1 Kernels in MATLAB toolbox. 3. 2 Univariate kernel density estimation. 6.
Kernel Smoothing Toolbox ∗ for MATLAB Jan Kol´aˇcek and Jiˇr´ı Zelinka
Contents 1 Kernels in MATLAB toolbox
3
2 Univariate kernel density estimation 2.1 Running the program . . . . . . . . . 2.2 Main figure . . . . . . . . . . . . . . 2.3 Setting the parameters . . . . . . . . 2.4 Eye-control method . . . . . . . . . . 2.5 The final estimation . . . . . . . . .
6 6 6 7 7 8
. . . . .
. . . . .
. . . . .
. . . . .
. . . . .
. . . . .
. . . . .
. . . . .
. . . . .
. . . . .
. . . . .
. . . . .
. . . . .
. . . . .
. . . . .
. . . . .
. . . . .
3 Kernel estimation of a distribution function 3.1 Running the program . . . . . . . . . . . . . 3.2 Main figure . . . . . . . . . . . . . . . . . . 3.3 Setting the parameters . . . . . . . . . . . . 3.4 Eye-control method . . . . . . . . . . . . . . 3.5 The final estimation . . . . . . . . . . . . .
. . . . .
. . . . .
. . . . .
. . . . .
. . . . .
. . . . .
. . . . .
. . . . .
. . . . .
. . . . .
. . . . .
. . . . .
. . . . .
. . . . .
. . . . .
12 . 12 . 12 . 12 . 13 . 13
. . . .
. . . .
17 17 17 17 18
. . . .
22 22 22 23 23
4 Kernel estimation and reliability 4.1 Running the program . . . . . . 4.2 Start menu . . . . . . . . . . . 4.3 Simulation menu . . . . . . . . 4.4 The final estimation . . . . . . 5 Kernel estimation of a hazard 5.1 Running the program . . . . 5.2 Main figure . . . . . . . . . 5.3 Setting the parameters . . . 5.4 Eye-control method . . . . .
. . . . .
. . . . .
. . . . .
assessment . . . . . . . . . . . . . . . . . . . . . . . . . . . . . . . .
function . . . . . . . . . . . . . . . . . . . . . . . .
. . . .
. . . .
. . . .
. . . .
. . . . . . . .
. . . . . . . .
. . . . . . . .
. . . . . . . .
. . . . . . . .
. . . . . . . .
. . . . . . . .
. . . . . . . .
. . . . . . . .
. . . . . . . .
. . . . . . . .
. . . . . . . .
. . . . . . . .
. . . .
Jan Kol´ aˇcek and Jiˇr´ı Zelinka, Department of Mathematics and Statistics, Masaryk University, Kotl´ aˇrsk´a 2, Brno, Czech Republic, available on http://www.math.muni.cz/english/science-andresearch/developed-software/232-matlab-toolbox.html ∗
1
5.5
The final estimation . . . . . . . . . . . . . . . . . . . . . . . . . . . . .
23
6 Kernel estimation of a regression function 6.1 Running the program . . . . . . . . . . . . . . . 6.2 Main figure . . . . . . . . . . . . . . . . . . . . 6.3 Setting the parameters . . . . . . . . . . . . . . 6.4 Estimation of optimal parameters . . . . . . . . 6.5 Eye-control method . . . . . . . . . . . . . . . . 6.6 Comparing of methods for bandwidth selection . 6.7 The final estimation . . . . . . . . . . . . . . .
. . . . . . .
. . . . . . .
. . . . . . .
. . . . . . .
. . . . . . .
. . . . . . .
. . . . . . .
. . . . . . .
. . . . . . .
. . . . . . .
. . . . . . .
. . . . . . .
. . . . . . .
29 . 29 . 30 . 30 . 31 . 32 . 32 . 33
7 Multivariate kernel density estimation 7.1 Running the program . . . . . . . . . . 7.2 Main figure . . . . . . . . . . . . . . . 7.3 Setting the parameters . . . . . . . . . 7.4 The final estimation . . . . . . . . . .
. . . .
. . . .
. . . .
. . . .
. . . .
. . . .
. . . .
. . . .
. . . .
. . . .
. . . .
. . . .
. . . .
36 . 36 . 37 . 37 . 40
2
. . . .
. . . .
. . . .
. . . .
. . . .
1
Kernels in MATLAB toolbox
In the toolbox, kernel functions are created by the command K def. Syntax K = K def(type) K = K def(’gauss’,s) K = K def(method,par1,par2,par3) Description K def creates a kernel function which satisfies conditions of the definition in Section 1.1. in [3] K = K def(type) creates a kernel as a predefined type, where type is a string variable. Predefined types are: ’epan’ Epanechnikov kernel ’quart’ quartic kernel ’rect’ uniform (rectangular) kernel ’trian’ triangular kernel ’gauss’ Gaussian kernel K = K def(’gauss’,s) creates the Gaussian kernel with variance s2 . K = K def(method,par1,par2,par3) creates a kernel by a specified method (string) with parameters par1, par2, par3 (string or double). All possible combinations of method and parameters are listed in Table 1. Output The output variable K is a structure array with fields described in Table 1.
3
method parameters purpose ’opt’ double values ν, optimal kernel from k, µ Sν,k of smoothness µ ’str’
par1 a string formula (in variable ’x’), par2, par3 double values
kernel defined by the formula par1 normalized on the support [par2, par3]
’pol’
par1 vector, par3 values
’fun’
par1 a string, kernel defined by par2, par3 dou- the external function par1 normalized ble values on the support [par2, par3]
double polynomial kernel par2, defined by the vecdouble tor of coefficients par1 normalized on the support [par2, par3]
Table 1: Combinations of parameters for K def
Example (Gaussian kernel) K = K def(’gauss’) gives K =
type: name: coef: support: nu: k: mu: var: beta:
’gau’ ’ ’ 1 [-Inf, Inf] 0 2 Inf 0.2821 1
Example (the Epanechnikov kernel) In this case, we have two possibilities how to create the kernel. K = K def(’opt’,0,2,0) or K = K def(’epan’) gives
4
field type
description type of the kernel ’opt’ optimal kernel (default) ’str’ string (variable denoted as ’x’) ’pol’ polynomial kernel ’fun’ external function ’tri’ triangular kernel ’gau’ Gaussian kernel
name
string with kernel expression or function name, ignored for optimal and polynomial kernel
coef
coefficients of the optimal or polynomial kernel
support
support of the kernel, default [−1, 1]
nu, k, mu order and smoothness of the kernel var
variance of the kernel V (K)
beta
k-th moment of the kernel βk Table 2: Structure of output
K =
type: name: coef: support: nu: k: mu: var: beta:
’opt’ ’ ’ [-3/4 0 3/4] [-1, 1] 0 2 0 3/5 1/5
For evaluation of the kernel K in a vector x use the function K val with syntax value = K val(K,x).
5
2 2.1
Univariate kernel density estimation Running the program
Toolbox for kernel density estimates can be launched by command ksdens. Launching without parameters will cause the start to the situation when only data input (button 1m) or terminating the program (button 2m) is possible (see Figure 1). In the data 1
�
��
�
��
0.9
1
��
0.8
0.7
0.6
0.5
0.4
0.3
0.2
0.1
0
0
0.1
0.2
0.3
0.4
0.5
0.6
0.7
0.8
0.9
1
2
��
Figure 1: Start of the program. input subroutine (Figure 2) you can choose reading data from the workspace (button 3m), from the external file (button 4m) or to create simulated data (button 5m). After choosing the source of data select the name of the variable containing the random variable (button 6m). If you know the true density (e.g., for simulated data), you can put it to the text field 7mwith ’x’ as variable. It can be used to compare with the final estimate of the density. At the end you can cancel the subroutine (button 8m) or confirm data (button m 9 ).
2.2
Main figure
After data input you will see data and you obtain another possibilities (Figure 3) in the main figure. The same situation is invoked if the main program is called with a parameter, i.e., by command ksdens(X). The variable X contains a sample of random variable which density we want to estimate. mcalls the same figure as Figure 3. It is also possible to save sePressing button 10 m, see Figure 4) into a file (button 15 m) or into the workspace lected variables (button 11 m (button 16 ). It should be point out that the most of variables is empty at the beginning of the program. 6
�� 3 �� �� 4 �� �� 5 ��
��
�
6
�� ��
�
�� 8 ��
7
��
�
��
9
��
Figure 2: Data input. Another two possibilities after data input concern the histogram: you can display it m(see Figure 5) and set the number of bins for the histogram by button by button 12 m. 13
2.3
Setting the parameters
minvokes the setting the parameters for smoothing (Figure 6). The upper part Button 14 of the window contains the brief instructions for entering the parameters. In the left part m) or the optimal kernel of the window you can choose a predefined kernel (button 17 m). Confirm the choice of the kernel by pressing button OK. By button (buttons 18 myou get the picture with the shape of the kernel. 19 m). Basic methods If the kernel is selected, the bandwidth can be chosen (field 20 of bandwidth selection are implemented (see Section 2.4 in [3] for details). Button mcalls the automatic procedure for setting of all parameters described in Section 2.6 in 22 [3]. In the right part of the window there are boxes where points for drawing the estimate m). Finally, you can confirm the parameters (button of the density can be set up ( 23 m m). 24 ) or close the window without change of the parameters (button 25
2.4
Eye-control method
m). This The bandwidth can be chosen by so-called “Eye-control” method (button 21 m m button invokes other window (see Figure 7). In boxes 26 and 27 the bandwidth and m(the middle the step for its increasing or decreasing can be set. By pressing button 28 one) the estimate for actual bandwidth is displayed, the arrows at the left and right side cause increasing or decreasing the bandwidth by a step and redrawing the figure. By myou can run and stop the gradual increasing the bandwidth and drawing buttons 29
7
Data
��
1
10 ��� ) � �� � 11 �� �� � 12 �� �� i P P 13 �� �� � 14 ��
0.8
0.6
0.4
0.2
0
−0.2
−0.4
−0.6
−0.8
−1 −2.5
−2
−1.5
−1
−0.5
0
0.5
1
1.5
2
2.5
Figure 3: Data view. the corresponding estimate. Finally it is possible to accept selected bandwidth (button m) or cancel the procedure (button 31 m) . 30
2.5
The final estimation
If all smoothing parameters are set, the estimate of the density function can be displayed m). For correction of boundary effects buttons 33 mcan be applied. (Figure 8, button 32 In the separate window you can set the left and the right boundaries for the removal the boundary effects. Then pressing buttons “L” or “R” the boundary effects correction is applied at the corresponding part of the estimate. mis intended to display the true density function if it was specified (see Button 34 mcan be used for displaying the grid in the figure that may help to Figure 9). Button 35 myou obtain the separate window identify the values of the graph. By the last button 36 with the density estimate without the buttons for other manipulation with the graph (exporting into some graphical format etc.)
8
�� 15 �� �� 16 ��
Figure 4: Data saving.
Histogram 20
18
16
14
12
10
8
6
4
2
0 −2.5
−2
−1.5
−1
−0.5
0
0.5
1
1.5
Figure 5: Histogram.
9
2
2.5
�� 17 ��
Q�� k � 23 +�� � ��
�
�� � 18 �� @ R @
20
�� �� 21 ���� � ��� �� � � �� 22 ��� ���� �� � ��� � � �� 9� � � � �� � 24 ��� �� ��� � � �� �� 9 � � 25 ��
�� 19 ��
Figure 6: Setting parameters.
��
29 ��� � ���� 9� � � 28 9���� � �� � 26 �� i�� P
0.45
0.4
0.35
27
�� �� � 30 ��
0.3
0.25
0.2
0.15
0.1
0.05
0 −3
−2
−1
0
1
2
3
Figure 7: “Eye-control” method.
10
�� � 31 ��
Kernel Estimate 0.4
0.35
0.3
0.25
0.2
�� � 32 � ) �� �� � 33 �� �� � 34 ��
0.15
0.1
0.05
0 −3
−2
−1
0
1
2
3
Figure 8: Kernel estimate.
�� 36 ��
0.4
0.35
0.3
0.25
0.2
0.15
0.1
0.05
�� 35 ��
0 −3
−2
−1
0
1
2
3
Figure 9: Estimate with the true density.
11
3 3.1
Kernel estimation of a distribution function Running the program
The toolbox is launched by command kscdf. Launching without parameters will cause the start to the situation when only data input (button 1m) or terminating the program (button 2m) is possible (see Figure 10). In the subroutine for data input (Figure 11) 1
�
��
�
��
0.9
1
��
0.8
0.7
0.6
0.5
0.4
0.3
0.2
0.1
0
0
0.1
0.2
0.3
0.4
0.5
0.6
0.7
0.8
0.9
1
2
��
Figure 10: Start of the program. you can choose the source of the data – you can choose reading data from the workspace (buttons 3m), from the file (button 4m) or create the simulated data (button 5m). Then select the name of the variable in the list 6m. If the true distribution function is known (for simulated data, for instance), put it to the text field 7m. You can use it to compare with the final estimate of the distribution function. The data input can be cancelled by button 8mor confirmed by button 9m.
3.2
Main figure
m, Figure 12) and save chosen values After data input you can view data (button 10 m). (button 11 mdisplays the empirical distribution function (Figure 13). Button 13 minvokes Button 12 the setting of the parameters for smoothing (Figure 14).
3.3
Setting the parameters
m), an optimal kernel In this subroutine you can choose a predefined kernel (button 16 m) and draw the kernel (button 18 m), but only kernels of order ν = 0, k = 2 (button 17 mif the kernel is selected. Four are available. The bandwidth can be selected in box 19
12
�� 3 �� �� 4 �� �� 5 ��
��
�
6
�� ��
�
�� 8 ��
7
��
�
��
9
��
Figure 11: Data input. methods for bandwidth choice are implemented (see Section 3.3 in [3]). The points for m) in the right part of the window. drawing the estimate of the density can be set up ( 21 m) or close the windows without change Finally, you can confirm the setting (button 22 m). of the parameters (button 23
3.4
Eye-control method
You can use the “Eye-control” method (see Figure 15) for bandwidth choice by button m. First set the initial bandwidth and the step for its increasing or decreasing in boxes 20 mand 25 m. Pressing the middle button from 26 mdisplays the estimate for actual 24 bandwidth, the arrows at the left and the right side cause increasing or decreasing myou can run and stop the bandwidth by a step and redrawing the figure. By buttons 27 the gradual increasing the bandwidth and drawing the corresponding estimate. Finally m) or cancel the procedure (button it is possible to accept selected bandwidth (button 28 m) . 29
3.5
The final estimation
m, Figure If the kernel and the bandwidth are set the estimate is displayed (button 30 16). Now, it is possible to set the correction of the boundary effects (the middle button m) and display the result by pressing “L” or “R” for the left or the right boundary in 31 m, Figure (see Figure 17). We can also display the true distribution function (button 32 17), if it was entered. The grid and the separate window with the estimate is also at disposal (buttons m m). 33 and 34
13
��
1
10 ��� � ) �� � 11 ��
0.8
0.6
�� � 12 ��
0.4
0.2
�� � 13 ��
0
−0.2
−0.4
−0.6
−0.8
−1
0
1
2
3
4
5
6
Figure 12: Data view.
Empirical distribution function 1
0.9
0.8
0.7
0.6
0.5
0.4
0.3
0.2
0.1
0 −1
0
1
2
3
4
5
6
Figure 13: Empirical distribution function.
14
�� 16 ��
Q�� k � 21 +�� � ��
�
�� � 17 �� @ R @
19
�� �� 20 ���� � ��� � � �� ��� �� � �� � 9� � � 22 ��
�� 18 ��
�� � 23 ��
Figure 14: Setting the parameters.
��
27 ��� � ���� 9� � �
1
26 ����� 9 �� � 24 �� i�� P
0.9
0.8
25
�� �� � 28 ��
0.7
0.6
0.5
0.4
0.3
0.2
0.1
0 −1
0
1
2
3
4
5
6
Figure 15: “Eye-control” method.
15
�� � 29 ��
1
0.9
0.8
0.7
0.6
0.5
0.4
�� � 30 � ) �� �� � 31 �� �� � 32 ��
0.3
0.2
0.1
0 −1
0
1
2
3
4
5
6
Figure 16: Kernel estimate.
�� 34 ��
1
0.9
0.8
0.7
0.6
0.5
0.4
0.3
0.2
0.1
�� 33 ��
0 −1
0
1
2
3
4
5
6
Figure 17: Estimate with boundary correction and the true distribution function.
16
4 4.1
Kernel estimation and reliability assessment Running the program
The Start menu (Figure 18) for kernel estimation of quality indices is called up by the command ksquality. �
1 � S S w �
2 � � � /
� 3 �
�
4 � � /
Figure 18: Start menu. You can skip this menu by typing input data as an argument ksquality(x0,x1), where the vectors x0 and x1 are score results for two groups G0 and G1 . If we know also their densities f0 and f1 (for example for simulated data), we can set them as the next arguments. For more see help ksquality. After the execution of this command the window in Figure 22 is called up directly.
4.2
Start menu
In the Start menu, you have several possibilities how to define input data. You can load it from a file (button 1m) or simulate data (button 2m). In the fields 3myou can list your variables in the current workspace to define input data. If your workspace is empty, these fields are nonactive. If you know the true densities for both groups, you can write them to text fields or load them from selected variables. If you need to simulate values for a model, press button 2m. Then the menu for simulation (Figure 19) is called up.
4.3
Simulation menu
In the Simulation menu, first it is necessary to generate random samples for both groups by buttons 5m. Either of these buttons calls up the Data generating menu (Figure 20). 17
�
5 � � Z = ~
1
0.9
0.8
0.7
0.6
0.5
0.4
0.3
0.2
0.1
0
0
0.1
0.2
0.3
0.4
0.5
0.6
0.7
0.8
0.9
1
Figure 19: Simulation menu – start. In this menu, you can set the type of distribution and the size of a sample (fields 6m). In the figure, the histogram for the generated sample is illustrated. In the bottom part of the menu, you can change parameters of a distribution and make a new sample by 7m. If you have done the sample generating, you need to export your data. The button 8mcalls up the menu where you specify the name of variable and confirm by pressing “OK”. Then the Data generating menu will be closed and you will be returned to the Simulation menu. After data generating for both groups it looks like Figure 21. In the figure, the histograms of generated samples for both groups are illustrated. The cyan color represents data for G0 and the red color is for G1 . In this stage you can save data to variables or as a file by using buttons 9m. If you have done the simulam. The Simulation menu will be closed and you will be returned tion, press button 10 to the Start menu (Figure 18). In this menu, you can redefine the input data. If you want to continue, press button 4m. The menu will be closed and the Basic menu (see the next paragraph) will be called up.
4.4
The final estimation
This menu (Figure 22) was called up from the Start menu or directly from the command line (see help ksquality). At the start of this application, you can see some color symbols in the figure. The blue crosses represent the score values X01 , . . . , X0n0 for the first group G0 , the red circles illustrate the score values X11 , . . . , X1n1 for the second group G1 .
18
�
6 � � Z � Z = Samples Z � ~
Distribution 20 18 16
Counts
14 12 10 8 6 4 2 0 −8
−6
−4
−2
0 Values
2
4
6
S o� 7 �
8
S o� 8 �
Figure 20: Data generating menu.
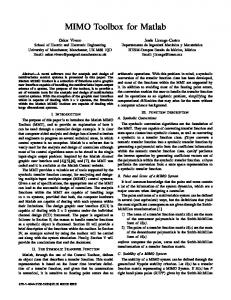
In the menu, there are six fields for computation of indices for reliability assessment. Each field contains two buttons for estimation. The “empiric” button represents the empirical estimate of the related index and the “kernel” button stands for the estimate obtained by kernel smoothing. For all cases the Epanechnikov kernel is used and the optimal smoothing parameter is estimated by the method of maximal smoothing principle. To avoid the boundary effects in estimation the reflection method is applied. For more details see Chapter 2 and 3 in [3]. Let us describe all fields more properly: • “ROC” – in the first field you obtain the ROC curve for the actual model. At the right hand side of the used button the value of AUC (defined by (4.8) in [3]) is written. The actual curve is plotted in the figure, see Figure 23. • “Gini” – this field stands for the estimation of the Gini index defined in (4.11) in [3]. • “MIS” – estimates the Kolmogorov – Smirnov statistics denoted as MIS (Maximum Improvement of Sensitivity over chance diagonal, see §4.3.2 in [3]). • “Inf. Value” – the estimate of the Information Value (see (4.16) in [3]) is computed and the related function fIV is plotted. 19
�
9 � � /
0.25
0.2
Counts
0.15
0.1
�
10 � � /
0.05
0 −4
−3
−2
−1
0
1
2
3
4
5
Values
Figure 21: Simulation menu. • “KR” – this field is for estimating the KR index (see (4.17) in [3]) and plotting the function χ2 . • “Lift” – set the value q (from interval (0, 1)) first and then estimate the cumulative Lift function (see (4.12) in [3]) at this point, the estimate is plotted in the current figure. The terms “LR” and “IRL” stand for the estimation of the Lift Ratio (see 4.14 in [3]) and the Integrated Relative Lift (see 4.15 in [3]), respectively. m. You can also save data to If you want to show only the actual curve, use button 11 m. Button 13 mends the application. variables and then as a file by using buttons 12
20
1
0.8
0.6
0.4
0.2
0
−0.2
−0.4
−0.6
−0.8
−1 −4
−3
−2
−1
0
1
2
3
4
5
Figure 22: Basic menu.
�
11 � S w
1
0.9
0.8
0.7
0.6
0.5
0.4
0.3
�
0.2
12
� / �� 13 � / �
0.1
0
0
0.1
0.2
0.3
0.4
0.5
0.6
0.7
0.8
0.9
Figure 23: Basic menu.
21
1
5 5.1
Kernel estimation of a hazard function Running the program
The program can be launched by command kshazard. If we launch it without parameters it is possible only input data (button 1m) or terminate the program (button 2m) Figure 24). 1
�
��
�
��
0.9
1
��
0.8
0.7
0.6
0.5
0.4
0.3
0.2
0.1
0
0
0.1
0.2
0.3
0.4
0.5
0.6
0.7
0.8
0.9
1
2
��
Figure 24: Start of the program. There is no simulation in the data input window (Figure 25) as the creating of simulated censored data for given hazard function is rather complicated (see Section 5.7 in [3]). We can select the source of the data (the workspace by button 3mor the file by button 4m). Then we choose the names of used variables containing the lifetimes and censoring indicator (buttons 5mand 6m). Finally confirm the values or cancel the subroutine (buttons 7mand 8m).
5.2
Main figure
Data input causes the same situation as if the toolbox is called with parameters (e.g., kshazard(X,d)). A window with data are displayed, uncensored data is represented by mwill open the window crosses, censored by circles (see Figure 26, button 9m). Button 10 for data saving. It is also possible to display Kaplan–Meier estimate of the survival function by button m mopens the window, where the parameters for kernel estimate 11 (Figure 27). Button 12 of hazard function can be set (see Figure 28).
22
�� 3 �� �� 4 ��
��
�
5
�� ��
�
�� 7 ��
6
��
�
��
8
��
Figure 25: Data input.
5.3
Setting the parameters
m), an optimal kernel In this subroutine you can choose a predefined kernel (button 15 m) and draw the kernel (button 17 m). The optimal kernel can be obtained (button 16 m) are available only for ν = 0. Only three methods for bandwidth selection (button 18 (see Section 5.3 in [3]). min the setting window the points for drawing the estimates can be set. In boxes 20 mor cancel the subroutine by Finally we can confirm the selected values by button 21 m. button 22
5.4
Eye-control method
Procedure with the “Eye-control” method for bandwidth selection can be invoked by m(see Figure 29). In boxes 23 mand 24 mwe can set the bandwidth and the step button 19 mdisplays the estimate for its increasing or decreasing. Pressing the middle button in 25 for the actual bandwidth. The two arrows at the left and the right side cause increasing mwe or decreasing the bandwidth by a step and redrawing the figure. By buttons 26 can run and stop the gradual increasing the bandwidth and drawing the corresponding m) or cancel estimate. Finally it is possible to accept actual bandwidth (button 27 m the procedure (button 28 ) .
5.5
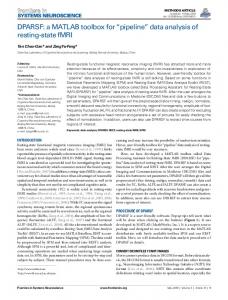
The final estimation
After setting the parameters we obtain a window from Figure 30 with the kernel estimate m). In addition, we have other options: to display of hazard function (also button 29 m, the confidence intervals for the kernel estimate of the hazard function (button 30 Figure 31), to show the points of the most rapid change (decreasing) of the estimate 23
1 uncensored censored 0.8
0.6
0.4
0.2
0
��
9 ��� ) � �� � 10 �� �� � 11 �� �� � 12 ��
−0.2
−0.4
−0.6
−0.8
−1
0
50
100
150
200
250
Figure 26: Data view. m, Figure 32) and to present the kernel estimate of the hazard function (button 31 m, Figure 33). of the survival function (button 32 The grid and the separate window with the estimate can be also invoked (buttons mand 34 m). 33
24
Kaplan−Meier estimate of survival function 1
0.95
0.9
0.85
0.8
0.75
0
50
100
150
200
250
Figure 27: Kaplan–Meier estimate of survival function.
�� 15 ��
�
�� � 16 �� @ R @
Q�� k � 20 +�� � ��
18
�� �� � 19 � � �� �� ��� � � � �� ��� �� 9�� � � 21 ��
�� 17 ��
�� � 22 ��
Figure 28: Setting the parameters.
25
��
−3
4
x 10
26 ��� � ���� 9� � �
25 ����� 9 �� � 23 �� i�� P
3.5
3
24
�� �� � 27 ��
2.5
2
1.5
1
0.5
0
0
50
100
150
200
250
�� � 28 ��
Figure 29: “Eye-control” method.
�� 34 ��
−3
3.5
x 10
3
2.5
2
��
29 ��� � ) �� i P P 30 �� �� � 31 ��
1.5
1
�� � 32 ��
0.5
�� 33 ��
0
0
50
100
150
200
250
Figure 30: Estimate of the hazard function.
26
Confidence intervals
−3
5
x 10
4.5
4
3.5
3
2.5
2
1.5
1
0.5
0
0
50
100
150
200
250
Figure 31: Confidence intervals.
−3
3.5
x 10
3
2.5
2
1.5
1
0.5
0
0
50
100
150
200
250
Figure 32: Points of the most rapid decreasing.
27
1
0.95
0.9
0.85
0.8
0.75
0
50
100
150
200
250
Figure 33: Kernel estimate of the survival function.
28
6 6.1
Kernel estimation of a regression function Running the program
The Start menu (Figure 34) for kernel regression is called up by the command ksregress. �
1 � S S w �
2 � � � /
� 3 �
�
4 � � � /
Figure 34: Start menu. You can skip this menu by typing input data as an argument ksregress(x,y), where the vectors x and y should be of the same length n and they mark x and y axes of measurements. If we know also the true regression function m(x) (for example for simulated data), we can set it as the next argument. For more see help ksregress. After executing this command directly the window in Figure 36 is called up. In the Start menu, you have several possibilities how to define input data. You can load it from a file (button 1m) or simulate data (button 2m). In the fields 3myou can list your variables in the current workspace to define input data. If your workspace is empty, these fields are nonactive. If you know the true regression function of the model, you can write it to the text field or load it from a variable. If you need to simulate a regression model, press button 2m. Then the menu for simulation (Figure 35) is called up. In the Simulation menu, first, set the regression function. You can write it to the text field 5m(after doing it press ENTER or click anywhere outside the field) or load it from a variable. In the fields 6mspecify the interval, the number of design points and the variance. You can simulate a regression model by pressing button 7m. Then you can save data to variables and then as a file by using buttons 8m. If you have done the simulation, press button 9m. The Simulation menu will be closed and you will be returned to the Start menu. In this menu, you can redefine the input data. If you want 29
�
5 � / � � 6 �
2
1.5
�
1
7 � � / � �
0.5
8 � � � / � 9 � � / �
0
−0.5
0
0.1
0.2
0.3
0.4
0.5
0.6
0.7
0.8
0.9
1
Figure 35: Simulation menu. to continue, press button 4m. The menu will be closed and the Basic menu (see Figure 36) will be called up.
6.2
Main figure
This menu (Figure 36) was called up from the Start menu or directly from the command line (see help ksregress). The values of independent variable x are automatically transformed to the interval [0, 1]. Symbols × mark the measurements after this m. Button 12 mends transformation. If you want to show the original data, use button 11 mto continue. Other buttons are nonactive. the application. Press button 10
6.3
Setting the parameters
mcalls up the menu for setting of the parameters which will be used for kernel Button 10 regression, see Figure 37. m, we can set kernel regression parameters. First, set the order of the In the array 13 kernel (ν, k), where ν + k should be even, for the regression estimation ν = 0 is used. The parameter µ is the smoothness of this kernel. If you want to draw the kernel, use m. Finally set the bandwidth h. The value should be between 0 and 1. To button 14 m, to close the window, use 16 m. The other buttons are useful confirm the setting use 15 for choosing the optimal bandwidth. mcalls up the “Eye-control” menu (see Figure 39), where we can change Button 17 mstarts the althe value of h and observe the effect upon the final estimate. Button 18
30
�
�
11 � S w
10 � � / �
13
12
11
10
9
8
7
6
�
5
4
12 � � / � 0
0.1
0.2
0.3
0.4
0.5
0.6
0.7
0.8
0.9
1
Figure 36: Basic menu. gorithm for estimation of optimal kernel order and optimal bandwidth (see §6.4). This m. By algorithm automatically sets the values of optimal parameters in the array 13 m m selecting one type of kernel estimators in 19 you make active 20 . This button calls up the menu for using and comparing various methods for choosing the optimal smoothing parameter h (see §6.6).
31
� 13 � �
18 � S w S
�
�
14 � � /
19 � S w S 7 � � � � � � 15 �
7 � � � 20 �
S� o 17 �
S� o 16 �
Figure 37: Setting of parameters.
6.4
Estimation of optimal parameters
mcalls up an algorithm for the estimation of optimal order of kernel and Button 18 optimal bandwidth. At first, it is necessary to set the type of kernel estimator:
Next, the menu for estimating the optimal bandwidth is called up (see Figure 38). mwe make active button 23 mwhich By choosing one of the methods in the array 21 0 starts the computation of optimal parameters k and h (we suppose K ∈ S0,k ). In the arm 22 ray , we can set limits for the parameter k, the default values are kmin = 2, kmax = 12. m. The results of the computation are automatically set in the array 13
6.5
Eye-control method
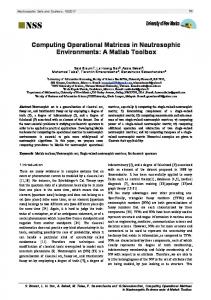
mcalls up a window, where we can change the value of parameter h and observe Button 17 the effect of these changes upon the final estimate (see Figure 39). m, set the starting value of parameter h and the step (it can be In the arrays 24 mstarts positive or negative number) for the size of changes of h. The left button 25 a sequence of pictures representing the quality of estimation dependence on h. The right button stops the sequence. You can change the value of h only one step more or less by m. buttons 26
32
�
21 � S S SS w
�
22 � S S SS w � 7 � 23 �
Figure 38: Estimation of optimal parameters.
6.6
Comparing of methods for bandwidth selection
mcalls up the window for using and comparing of various methods for the opButton 20 timal bandwidth selection (see Figure 40). In this window, all mentioned bandwidth estimators are summarized. In the array m, there are presented: 27
• method of penalizing functions – see §6.3.3 in [3] • the cross-validation method (denoted as “Classic CV”) – see §6.3.2 in [3]. By clicking on the button with the method’s name, the optimal bandwidth is computed by the actual method. The button “draw” calls up a graph of the minimized m. Buterror function. To draw all penalizing functions applied up to this time use 28 mrepresents Mallows’ method (see §6.3.1 in [3]), button 30 mdenotes the method ton 29 mmarks of Fourier transformation described in the first part of §6.3.4 in [3] and 31 ˆ PI given by (6.35) in [3]. If the original the plug-in method, i.e., the bandwidth estimate h regression function is known (for example for simulated data), we can compute the value of optimal bandwidth as a minimum of AMISE{m(·, b h)} (see the formula (6.12) in [3]) m 32 in the array . To do this computation, it is necessary to have the Symbolic toolbox installed on your computer. If this toolbox is not installed or the regression function is not defined on input, the array is not active. For the graph of all error functions and m. Button 34 mcloses the application. their minimal values use 33
33
�
25 �� 9�� / � ��
The NW estimate with kernel of order (0,2), smoothness 0 and h=0.075 13
26 �� ��� � 9 / � o �
12
24 �
11 10 9 8 7 6 5 4 0
0.1
0.2
0.3
0.4
0.5
0.6
0.7
0.8
0.9
1
Figure 39: “Eye-control” menu.
6.7
The final estimation
If you have set all values in the window for parameters setting (see Figure 37) and if you want to go to the final estimation of the regression function, confirm your setting m. It calls up the Basic menu, where all buttons are active already. by button 15 mfor the Nadaraya By clicking on the button with the estimator’s name (for example 35 – Watson estimator), the relevant regression estimate is drawn (solid line in the figure). The button “cyclic” shows the regression estimate with using the assumption of cyclic model. By using buttons “L” and “R” we get the estimate near the boundary of the inmdraws terval obtained by using special boundary kernels (L=left, R=right). Button 36 confidence intervals (dashed) computed by using the formula (6.14) in [3]. To do this computation, it is necessary to have the Stats toolbox installed on your computer. If this mshows original data and toolbox is not installed, the button is not active. Button 37 the final estimate. You can also save data to variables and then as a file by using buttons m. Button 39 mends the application. 38
34
�
�
27 � S w S
30 � � / �
�
31 � � / � �
32 � � / �
� 28 XXX � z � XX
�
29 � S w S
34 � � / � � 7 � 33 �
Figure 40: Bandwidth estimators.
�
�
36 � S w
37 � S w Nadaraya−Watson
�
13
35 � � / �
12
11
10
9
8
7
�
6
38 � �� � 39 / � � / �
5
4
0
0.1
0.2
0.3
0.4
0.5
0.6
0.7
0.8
0.9
1
Figure 41: Original data and the final kernel regression estimate.
35
7 7.1
Multivariate kernel density estimation Running the program
The Start menu (Figure 42) for kernel estimation of two-dimensional density is called up by the command ksbivardens. �
1 � S S w �
2 � � � /
� 3 �
�
4 � � � /
Figure 42: Start menu. You can skip this menu by typing input data as an argument ksbivardens(X), where the matrix X should have the size 2 × n, where n is the sample size. If we know also the original density f (for example for simulated data), we can set it as the next argument. For more see help ksbivardens. After the execution of this command, the window in Figure 45 is called up directly. In the Start menu, you have several possibilities how to define input data. You can load it from a file (button 1m) or simulate data (button 2m). In the fields 3myou can list your variables in the current workspace to define input data. If your workspace is empty, these fields are nonactive. If you know the true density of the sample, you can write it to the text field or load it from a variable. If you need to simulate a sample, press button 2m. Then the menu for simulation (Figure 43) is called up. This application generates a random sample from a two-dimensional normal mixture density. In the Simulation menu, first set the number of components of the mixture by 5m. You can choose from 1 to 5 components of the normal mixture density. In the fields 6mspecify the parameters (mean, variance matrix and proportion) of each component. By 7mspecify the sample size. You can simulate a sample by pressing button 8mand then see the result (Figure 44). myou By clicking on 9myou can print the current plot to a new figure. In the fields 10 switch the type of view between the data plot with contours and the 3-D plot of the den36
�
5 � S w � 6 �
1
�
7 � S w S �
0.9
8 � / �
0.8
0.7
0.6
0.5
0.4
0.3
0.2
0.1
0
0
0.1
0.2
0.3
0.4
0.5
0.6
0.7
0.8
0.9
1
Figure 43: Simulation menu. sity function. You can also save the obtained data to variables and then as a file by m. If you have done the simulation, press button 12 m. The Simulation using buttons 11 menu will be closed and you will be returned to the Start menu. In this menu, you can redefine the input data. If you want to continue, press button 4m. The menu will be closed and the Basic menu (see the next subsection) will be called up.
7.2
Main figure
This menu (Figure 45) was called up from the Start menu or directly from the command myou can switch line (see help ksbivardens). If the original density is known, in 14 the type of view between the data plot with contours and the 3-D plot of the density myou can show or hide contours of original density. If function. By clicking on 15 mto continue. the original density is unknown, only data are plotted. Use button 13
7.3
Setting the parameters
mcalls up the menu for setting the parameters (Figure 46) which will be used Button 13 for bivariate kernel density estimation. m, you can set a type of the kernel. Implicit setting is the Gaussian In the array 16 kernel or it can be changed to polynomial kernel. In this case, set the type of kernel (product or spherically symmetric) and set the order of the kernel (ν, k), where ν + k should be even, for density estimation ν = 0 is used. The parameter µ is the smoothness
37
�
9 � � � /
5 0.12 4 0.1 3
0.08
y
2
1 0.06
� � 10 � �
0 0.04 −1
0.02
−2
11 � � � / � 12 � � � /
−3 −3
−2
−1
0
1
2
3
x
Figure 44: Simulation menu – results. m. In the array 17 m, specify of this kernel. If you want to draw the kernel, use button 18 the bandwidth matrix H. The matrix should be symmetric and positive definite. If these conditions are not satisfied, the application writes an error message. The implicit setting is
(1)
b n−1/3 , b =Σ H
b is the empirical estimate of the covariance matrix and n is the number of obserwhere Σ vations. This formula (known as “Reference rule”) is based on the assumption of normal density and Gaussian kernel (see §7.3.3 in [3]). The terms of the bandwidth matrix can m. There are two be set manually or you can use one of the buttons in the array 19 groups of methods: 1. Diagonal matrix – in this case, it is supposed that the bandwidth matrix is diagonal. Because of computational aspects, the used methods are developed for product polynomial kernels. For other types of kernel the buttons are not active. There are five buttons: • Pseudo-likelihood CV – represents the pseudo-likelihood cross-validation method described in [2]. This bivariate method is a straightforward extension of univariate pseudo-likelihood CV (see [1]). • Least squares CV – the method is based on the paper [4], where some research on LSCV selector for diagonal matrix was carried out. • Iterative method 1 – it represents the proposed M 1 method described in §7.4.1 in [3]. 38
�
4
0.12
13 � � � /
0.11 3 0.1
0.09 2 0.08
1
0.07
� � 14 �
0.06 0 0.05
0.04 −1
S o S� 15 �
0.03
−2 −3
−2
−1
0
1
2
3
0.02
Figure 45: Basic menu. • Iterative method 2 – this means the second proposed iterative method M 2, which is explained in §7.4.2 in [3]. • AMISE optimal – this button is active only in the case of known original density, it finds the AMISE optimal diagonal bandwidth matrix by the formula (7.17) in [3]. 2. Full matrix – in this case, the full bandwidth matrix and Gaussian kernel φI are supposed. There are also five buttons: • Reference rule – represents the implicit setting based on the multiplication of the covariance matrix estimate, see the formula (7.22) in [3]. • Least squares CV – it minimizes the CV error function (7.9) in [3] for r = 0. • Maximal smoothing – represents the maximal smoothing principle described in §7.3.4 in [3]. • Iterative method – it represents the proposed iterative method for full matrix described in §7.3.5 in [3]. • MISE optimal – this button is active only in the case of known mixture of normal distributions as an original density. It estimates the MISE optimal bandwidth matrix by minimizing (7.5) in [3]. m, to close the window, use 21 m. To confirm the setting use 20
39
� 16 �
�
19 � � / �
�
17 � S w S
�
�
21 � � � /
18 � S w S 7 � � � 20 �
Figure 46: Setting of parameters.
7.4
The final estimation
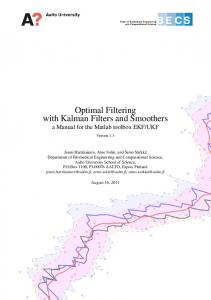
If you set all the values in the window for setting parameters (see Figure 46) and if you m. want to go to the final estimation of the density, confirm your setting by button 20 It calls up the Basic menu, where all buttons are active already. mthe relevant kernel density estimate is drawn. You can By clicking on button 23 mand switch between types again add contours for the known original density by 15 m. By clicking on 22 myou can print the current plot to a new figure. You of view in 14 m. Button 25 mends can also save data to variables and then as a file by using buttons 24 all applications.
40
�
22 � S w 0.1 5
0.09 4
0.08
�
23 � � � /
3
0.07 2 0.06 1 0.05 0 0.04
−1 0.03
−2 0.02
�
24 � �� / � 25 � � / �
−3 −3
−2
−1
0
1
2
3
0.01
Figure 47: Final kernel density estimate.
References [1] Cao, R., Cuevas, A. and Gonz´alez Manteiga, W. (1994). A comparative study of several smoothing methods in density estimation, Computational Statistics and Data Analysis 17, 2, pp. 153–176. [2] Horov´a, I., Kol´aˇcek, J. and Vopatov´a, K. (2009). Bandwidth matrix choice for bivariate kernel density estimates, in Book of short papers (MU Brno), pp. 22–25. [3] Horov´a, I., Kol´aˇcek, J. and Zelinka, J. (2012). Kernel smoothing in MATLAB, World Scientific. [4] Sain, S., Baggerly, K. and Scott, D. (1994). Cross-validation of multivariate densities, Journal of the American Statistical Association 89, 427, pp. 807–817.
41