Physics in Medicine and Biology, 43(4):973â982, 1998 (preprint). Kinetic parameter estimation from SPECT cone-beam projection measurements.
Physics in Medicine and Biology, 43(4):973–982, 1998 (preprint)
Kinetic parameter estimation from SPECT cone-beam projection measurements R H Huesman† , B W Reutter† , G L Zeng‡ and G T Gullberg‡ † Center for Functional Imaging, Lawrence Berkeley National Laboratory, University of California, Berkeley, CA 94720, USA ‡ Department of Radiology, University of Utah, Salt Lake City, UT 84132, USA Abstract. Kinetic parameters are commonly estimated from dynamically acquired nuclear medicine data by first reconstructing a dynamic sequence of images and subsequently fitting the parameters to time activity curves generated from regions of interest overlaid upon the image sequence. Biased estimates can result from images reconstructed using inconsistent projections of a time-varying distribution of radiopharmaceutical acquired by a rotating SPECT system. If the SPECT data are acquired using cone-beam collimators wherein the gantry rotates so that the focal point of the collimators always remains in a plane, additional biases can arise from images reconstructed using insufficient, as well as truncated, projection samples. To overcome these problems we have investigated the estimation of kinetic parameters directly from SPECT cone-beam projection data by modeling the data acquisition process. To accomplish this it was necessary to parameterize the spatial and temporal distribution of the radiopharmaceutical within the SPECT field of view. In a simulated chest image volume, kinetic parameters were estimated for simple one-compartment models for four myocardial regions of interest. Myocardial uptake and washout parameters estimated by conventional analysis of noiseless simulated conebeam data had biases ranging between 3–26% and 0–28%, respectively. Parameters estimated directly from the noiseless projection data were unbiased as expected, since the model used for fitting was faithful to the simulation. Statistical uncertainties of parameter estimates for 10 000 000 events ranged between 0.2–9% for the uptake parameters and between 0.3–6% for the washout parameters.
Physics in Medicine and Biology, 43(4):973–982, 1998 (preprint)
2
1. Introduction Kinetic parameters are commonly estimated from dynamically acquired nuclear medicine data by first reconstructing a dynamic sequence of images and subsequently fitting the parameters to time activity curves generated from regions of interest overlaid upon the reconstructed image sequence. Since SPECT data acquisition involves movement of the detectors (figure 1) and the distribution of radiopharmaceutical changes during the acquisition (figure 2) the data acquired over a revolution of the camera will not generally correspond to any distribution of radionuclide. Projections at different angles come from different distributions, and we refer to such data as being inconsistent. The image reconstruction step can produce erroneous results that lead to biases in the estimated kinetic parameters. If the SPECT data are acquired using cone-beam collimators wherein the gantry rotates so that the focal point of the collimators always remains in a plane, the additional problem of reconstructing dynamic images from insufficient projection samples arises. The reconstructed intensities will also have errors due to truncated cone-beam projection data, thus producing additional biases in the estimated kinetic parameters.
B(t)
m k21
Qm (t) m k12
Figure 1. Cone-beam SPECT scanner. The detector rotates about the patient (not shown) so that the focal point remains in a plane perpendicular to the long axis of the patient’s body.
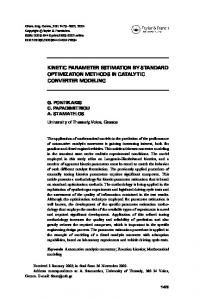
Figure 2. Compartmental model for 99m Tc-teboroxime in the myocardium. B(t) is the blood input function, Qm (t) is the tracer m m , k12 are in tissue type m, and k21 the rate constants for uptake and washout, respectively.
To overcome these problems we have investigated the estimation of the kinetic parameters directly from the projection data by modeling the data acquisition process of a time-varying distribution of radiopharmaceutical detected by a rotating SPECT system with cone-beam collimation. To accomplish this it was necessary to parameterize the spatial and temporal distribution of the radiopharmaceutical within the SPECT cone-beam field of view. We hypothesize that by estimating directly from cone-beam projections instead of from reconstructed time-activity curves, the parameters which describe the time-varying distribution of radiopharmaceutical can be estimated without bias. The direct estimation of kinetic parameters from the projection measurements has become an active area of research. However, to our knowledge no one has accomplished
Physics in Medicine and Biology, 43(4):973–982, 1998 (preprint)
3
direct estimation from full 3D projection data sets. At the University of Michigan, Chiao et al (Chiao et al 1994a, Chiao et al 1994b) performed estimates of ROI kinetic parameters for a one-compartment model and estimates of parameters of the boundaries for the ROIs from simulated transaxial PET measurements. They demonstrated that the biases in the kinetic parameter estimators were reduced by allowing for estimators of the boundaries of the ROIs to be included in the estimation process. At Simon Fraser University, Limber et al (Limber et al 1995) fit the parameters of a single exponential decay (to model fatty acid metabolism in the heart) directly from simulated projections acquired with a single rotating SPECT detector system. Estimation of time-activity curves from projections has been investigated by several groups. We have described a method to estimate the average activity in a 2D region of interest (Huesman 1984), and Defrise et al (Defrise et al 1990) extended these ideas to 3D. To compensate for physical factors such as attenuation and detector resolution, Carson (Carson 1986) described a method to estimate activity density assumed to be uniform in a set of regions of interest using maximum likelihood, and Formiconi (Formiconi 1993) similarly used least squares. The present research builds on the work of Carson and Formiconi as well as on our previous research (Zeng et al 1995) wherein a one-compartment model was fit to dynamic sequences in a 3×3 array directly from projection measurements. This work showed a bias in estimates from the reconstructed time activity curves, which was eliminated when estimating the parameters directly from the projections. The estimation was performed in a two step process: by first estimating the exponential factors using linear time-invariant system theory, then estimating the multiplicative factors using a linear estimation technique. Later we presented preliminary work in 2D (Huesman et al 1997) which was the precursor to this 3D research. The research presented here formulates the problem as a minimization of one nonlinear estimation problem for a 3D time-varying distribution measured with planar orbit cone-beam tomography. A one-compartment model is assumed for the simulated myocardial tissue with a known blood input function, which would correspond to the kinetics of teboroxime in the heart (Smith et al 1994, Smith et al 1996). Parameters are estimated by minimizing a weighted sum of squared differences between the projection data and the model predicted values for a rotating detector SPECT system with conebeam collimators. The estimation of parameters directly from projections is compared with estimation of kinetic parameters from tomographic determination of time-activity curves for four regions of interest. 2. Estimation of kinetic parameters directly from projections The parameters are determined from a model of the projection data that assumes a onecompartment kinetic model for each tissue type as shown in figure 2. The expression
Physics in Medicine and Biology, 43(4):973–982, 1998 (preprint)
4
{
}
4 wjn
}
ujn
{ 1 wjn
vjn
{
{ Figure 3. Phantom: The outer surface is the limit of the background activity, and the ellipsoid enclosing the small ellipsoid and three spheres represents the outer surface of the left ventricle. The small ellipsoid is the inner wall of the left ventricle and contains the blood pool.
Figure 4. Illustration of lengths along a projection ray for background, vjn , blood pool, ujn , 1 , and sepmain myocardium, wjn 4 tal ROI, wjn .
for uptake in tissue type m is m
Q (t) =
m k21
Z
0
t
m
m m B(τ )e−k12 (t−τ ) dτ = k21 V (t) ,
(1)
m m is the uptake parameter, and k12 is where B(t) is the known blood input function, k21 the washout parameter. Total activity in the tissue is given by m m Qm (t) + fvm B(t) = k21 V (t) + fvm B(t) ,
(2)
where fvm is the fraction of vasculature in the tissue. This analysis starts with an image volume segmented into blood pool, M tissue types of interest, and background as is schematically shown in figure 3. In order to obtain tissue boundaries, the object (patient) is assumed motionless during data acquisition, and the reconstructed image volume (for example, via the projections at the time of strongest signal, or via the summed projections) is segmented to provide anatomical structure. The image intensity at each segmented region is not used. From the segmented image volume the lengths of the blood pool, tissue, and background regions along each projection ray for each projection angle are calculated. The number of projection rays per projection angle is denoted by N , the number of projection angles per rotation by J, and the number of rotations by I. Thus, there are a total of IJN projection rays distributed in time and space. For a typical projection ray at angle j and position n, the length of the blood pool along the projection ray is denoted by ujn , the m length of the background by vjn , and the length of heart tissue m by wjn (figure 4). The amplitude of the background activity is denoted by g, and the background is assumed
Physics in Medicine and Biology, 43(4):973–982, 1998 (preprint)
5
to be proportional to the blood activity. The projection equations can be expressed as Z
pijn =
tij
tij −∆t
(
ujn B(τ ) + vjn gB(τ ) +
)
M X m=1
m wjn
m m [k21 V (τ )
+
fvm B(τ )]
dτ ,
(3)
m where the time tij is equal to [j + (i − 1)J]∆t. The constants ujn , vjn , and wjn are pure geometrical weighting factors for blood, background, and tissue m, respectively, and m these equations are linear in the unknowns g, k21 , and fvm . The nonlinear parameters, m k12 , are contained in V m (t). The criterion which is minimized by varying the model parameters is the weighted sum of squares function
χ2 =
I X J X N X (pijn − p∗ijn )2 2 σijn
i=1 j=1 n=1
,
(4)
where p∗ijn are the measured data and σijn are their statistical uncertainties. An estimate ˆ = ( kˆm gˆ kˆm fˆm ) is of the covariance matrix for the resulting model parameters Θ 12 21 v
ˆ = cov(Θ)
1 ∂ 2 χ2 2 ∂Θ2 Θ=Θˆ
!−1
.
(5)
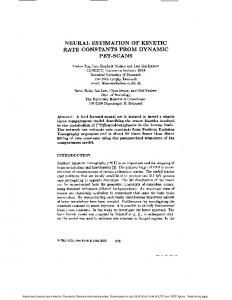
ˆ are the square roots of Then the statistical uncertainties of the parameter estimates, Θ, the diagonal elements of the covariance matrix given by equation (5). m As mentioned above, equation (3) is a linear function of the parameters g, k21 , and m fv . Therefore the model it describes is called a conditionally linear, partially linear, or separable nonlinear model (Bates and Watts 1988, Seber and Wild 1989). Using standard techniques for removing conditionally linear parameters, equation (4) can be m considered to be a function of only the nonlinear parameters, k12 . We have used this technique to obtain the results presented here. 3. Computer simulations A simulation was performed to evaluate the ability to estimate the kinetic parameters directly from cone-beam projection data. A simulated image volume, shown in figure 3, contained background, blood, and four tissue regions of interest. The blood input function and simulated tissue activity curves are shown in figure 5. The blood input function was assumed known, and simple one-compartment models were used within four regions of interest of a simulated left ventricle of the myocardium. Boundaries of the myocardial regions were assumed known, and background activity was proportional to the input function. The parameter g was the ratio of background to blood. There were 13 parameters to estimate: the amplitudes, decay rates, and vascular fractions for the four myocardial regions, and the amplitude of the overall background. The 15 minute data acquisition protocol consisted of 10 revolutions of a single-head SPECT system with a detector radius of 30 cm, acquiring 120 angles per revolution and 48 transverse × 30 axial samples per angle. Attenuation, scatter, and geometric point response were not modeled. Each projection had 8.33 mm bin width at the the detector,
Physics in Medicine and Biology, 43(4):973–982, 1998 (preprint)
6
900 800 700 main myocardium Concentration
600 lateral ROI
apical ROI
500 400 300 blood
200 100 0
septal ROI
background
0
100
200
300
400 500 Time (sec)
600
700
800
900
Figure 5. Time-activity curves for blood, background, and four tissue regions of interest as shown in figure 3.
and line length weighting was assumed. The cone-beam collimators had a focal length of 70 cm and yielded a 4.76 mm projection ray spacing at the center of the tomograph. We also simulated the use of parallel-beam collimators. For each collimator geometry, a dynamic image sequence was reconstructed and conventional kinetic analysis was performed on time-activity curves obtained by overlaying ROIs upon the reconstructed images. The cone-beam projections were reconstructed into a 48×48×30 array of 4.76×4.76×4.76 mm volume elements (voxels) using the Feldkamp algorithm (Feldkamp et al 1984) and the parallel-beam projections were reconstructed into a 48×48×30 array of 8.33×8.33×8.33 mm voxels using filtered back-projection. ROIs were defined by taking all voxels containing at least 80% blood pool, background, or one of the four tissue types, to ensure that the centers of the voxels were well within the surfaces bounding the anatomical structures of interest. Parameter estimates obtained from conventional analysis of time-activity curves generated from the reconstructed projections were compared with parameters obtained by estimating the time-activity curves from the projections (i.e., the work of Formiconi (Formiconi 1993)). Comparisons were also made with parameters estimated directly from the projections. The results for noiseless projections are shown in tables 1 and 2 and figures 6 and 7. Parameter estimates obtained from conventional analysis of noiseless, inconsistent, cone-beam projections had biases ranging between 3–26% for the uptake parameters and 0–28% for the washout parameters. The biases were largest for the lateral and septal ROIs, which encompassed small volumes and had relatively fast washout. The estimates obtained using Formiconi’s method had smaller biases, ranging between 0.4–17% for the uptake parameters and 0–5% for the washout parameters. Parameters estimated directly from the noiseless projections were unbiased as expected, since the model used for fitting was faithful to the simulation. In addition, multiple local minima were not
Physics in Medicine and Biology, 43(4):973–982, 1998 (preprint)
7
Table 1. Results of kinetic parameter estimation from noiseless, inconsistent, conebeam projections: (a) simulated values; (b) values from dynamic reconstructions; (c) values from direct estimation of region time-activity curves (Formiconi 1993); (d) values from direct estimation from projections; (e) uncertainties of values from direct estimation from projections for 10 000 000 events using equation (5). Results of kinetic parameter estimation from noiseless, forced consistent, cone-beam projections: (b0 ) values from dynamic reconstructions; (c0 ) values from direct estimation of region m m and k12 are min−1 . time-activity curves. The units for k21 a
b
c
d
e
b0
c0
main myocardium
1 k21 1 k12 fv1
0.540 0.060 0.100
0.518 0.060 0.135
0.542 0.060 0.102
0.540 0.060 0.100
0.001 0.0002 0.002
0.518 0.060 0.121
0.540 0.060 0.100
apical ROI
2 k21 2 k12 fv2
0.765 0.150 0.150
0.740 0.141 0.162
0.769 0.150 0.133
0.765 0.150 0.150
0.010 0.002 0.017
0.742 0.142 0.165
0.765 0.150 0.150
lateral ROI
3 k21 3 k12 fv3
0.960 0.600 0.200
0.771 1.124 0.460 0.630 0.294 −0.003
0.960 0.600 0.200
0.043 0.021 0.029
0.754 0.455 0.295
0.960 0.600 0.200
septal ROI
4 k21 4 k12 fv4
0.960 0.900 0.200
0.708 0.644 0.338
0.976 0.937 0.271
0.960 0.900 0.200
0.082 0.056 0.038
0.628 0.585 0.333
0.960 0.900 0.200
background
g
0.200
0.223
0.200
0.200
0.0001
0.224
0.200
1.4
1.2
1.2 inconsistent data direct forced consistency conventional C Formiconi F
1
inconsistent data direct forced consistency conventional C Formiconi F
1 k12 (1/min)
k21 (1/min)
0.8 0.8
0.6
0.6
0.4 0.4 0.2
0.2
0
C F C F main myocardium
C F C F apical ROI
C F C F lateral ROI
C F C F septal ROI
0
C F C F main myocardium
C F C F apical ROI
C F C F lateral ROI
C F C F septal ROI
m m Figure 6. Cone-beam values for k21 (left) and k12 (right). The gray bars depict the estimates obtained from conventional and Formiconi analyses of noiseless, inconsistent projections. The white bar depicts the unbiased estimate (simulated value) obtained directly from the projections, along with its estimated uncertainty predicted for 10 000 000 events using equation (5). The black bars depict the estimates obtained from conventional and Formiconi analyses of noiseless, forced consistent projections.
encountered regardless of noise levels simulated. Estimated parameter uncertainties (see equation (5)) for 10 000 000 total events ranged between 0.2–9% for the uptake parameters and 0.3–6% for the washout parameters.
Physics in Medicine and Biology, 43(4):973–982, 1998 (preprint)
8
Table 2. Results of kinetic parameter estimation from noiseless, inconsistent, parallelbeam projections: (a) simulated values; (b) values from dynamic reconstructions; (c) values from direct estimation of region time-activity curves (Formiconi 1993); (d) values from direct estimation from projections; (e) uncertainties of values from direct estimation from projections for 3000 000 events using equation (5). Results of kinetic parameter estimation from noiseless, forced consistent, parallelbeam projections: (b0 ) values from dynamic reconstructions; (c0 ) values from direct m m and k12 are min−1 . estimation of region time-activity curves. The units for k21 a
b
c
d
e
b0
c0
main myocardium
1 k21 1 k12 fv1
0.540 0.060 0.100
0.520 0.060 0.135
0.539 0.060 0.116
0.540 0.060 0.100
0.002 0.0004 0.004
0.522 0.061 0.113
0.540 0.060 0.100
apical ROI
2 k21 2 k12 fv2
0.765 0.150 0.150
0.715 0.139 0.182
0.748 0.148 0.215
0.765 0.150 0.150
0.022 0.005 0.039
0.722 0.141 0.154
0.765 0.150 0.150
lateral ROI
3 k21 3 k12 fv3
0.960 0.600 0.200
0.718 0.437 0.351
0.965 0.600 0.199
0.960 0.600 0.200
0.096 0.045 0.066
0.710 0.429 0.317
0.960 0.600 0.200
septal ROI
4 k21 4 k12 fv4
0.960 0.900 0.200
0.607 0.558 0.362
1.178 0.988 0.088
0.960 0.900 0.200
0.176 0.119 0.083
0.562 0.523 0.355
0.960 0.900 0.200
background
g
0.200
0.199
0.201
0.200
0.0001
0.199
0.200
1.4
1.2
1.2 inconsistent data direct forced consistency conventional C Formiconi F
1
inconsistent data direct forced consistency conventional C Formiconi F
1 k12 (1/min)
k21 (1/min)
0.8 0.8
0.6
0.6
0.4 0.4 0.2
0.2
0
C F C F main myocardium
C F C F apical ROI
C F C F lateral ROI
C F C F septal ROI
0
C F C F main myocardium
C F C F apical ROI
C F C F lateral ROI
C F C F septal ROI
m m Figure 7. Parallel-beam values for k21 (left) and k12 (right). The gray bars depict the estimates obtained from conventional and Formiconi analyses of noiseless, inconsistent projections. The white bar depicts the unbiased estimate (simulated value) obtained directly from the projections, along with its estimated uncertainty predicted for 3000 000 events using equation (5). The black bars depict the estimates obtained from conventional and Formiconi analyses of noiseless, forced consistent projections.
Parameter estimates were also obtained from noiseless cone-beam projections forced to be consistent over the 90 sec time frame of the dynamic data acquisition. Over the course of each revolution of the SPECT system, the activity in each region was held
Physics in Medicine and Biology, 43(4):973–982, 1998 (preprint)
9
constant at the average of the continuously varying value that yielded the inconsistent projections. For the conventional analysis the biases changed very little for the main myocardium and for the apical and lateral ROIs, and increased for the septal ROI. The estimates obtained using Formiconi’s method were unbiased for the forced consistent projections, as expected. Parameter estimates obtained from the noiseless parallel-beam projections had larger biases, compared to those obtained from the cone-beam projections. Biases for the estimates obtained from conventional analysis of inconsistent parallel-beam projections ranged between 4–37% for the uptake parameters and 0–38% for the washout parameters. The biases were again largest for the lateral and septal ROIs. The estimates obtained using Formiconi’s method had biases ranging between 0.2–23% for the uptake parameters and 0–10% for the washout parameters. Parameters estimated directly from the noiseless projections were again unbiased and multiple local minima were not encountered regardless of noise levels simulated. Estimated parameter uncertainties (see equation (5)) for 3000 000 total events ranged between 0.4–18% for the uptake parameters and 0.7–13% for the washout parameters. For the conventional analysis of noiseless, forced consistent, parallel-beam projections, the biases again changed very little for the main myocardium and for the apical and lateral ROIs, and increased for the septal ROI. The estimates obtained using Formiconi’s method were again unbiased. 4. Summary The combination of gantry motion and the time-varying nature of the radionuclide distribution being imaged results in inconsistent projection data sets. Estimating kinetic parameters from time-activity curves taken from reconstructed images (Feldkamp et al 1984) results in biases. These biases are reduced if the time-activity curves are estimated from the projection data (Formiconi 1993). Estimating the kinetic parameters directly from cone-beam projections removes all bias for noiseless data as expected. Implementation of this strategy requires a spatial and temporal model of the distribution of radionuclide within the SPECT field of view. Acknowledgments This work was supported by U.S. Department of Health and Human Services grants R01-HL50663 and P01-HL25840 and by U.S. Department of Energy contract DE-AC0376SF00098. References Bates D M and Watts D G 1988 Nonlinear Regression Analysis and Its Applications (New York: John Wiley & Sons)
Physics in Medicine and Biology, 43(4):973–982, 1998 (preprint)
10
Carson R E 1986 A maximum likelihood method for region-of-interest evaluation in emission tomography J. Comput. Assist. Tomogr. 10 654–63 Chiao P C, Rogers W L, Clinthorne N H, Fessler J A and Hero A O 1994 Model-based estimation for dynamic cardiac studies using ECT IEEE Trans. Med. Imag. 13 217–26 Chiao P C, Rogers W L, Fessler J A, Clinthorne N H and Hero A O 1994 Model-based estimation with boundary side information or boundary regularization IEEE Trans. Med. Imag. 13 227–34 Defrise M, Townsend D and Geissbuhler A 1990 Implementation of three-dimensional image reconstruction for multi-ring positron tomographs Phys. Med. Biol. 35 1361–72 Feldkamp L A, Davis L C and Kress J W 1984 Practical cone-beam algorithm J. Opt. Soc. Am. A 1 612–9 Formiconi A R 1993 Least squares algorithm for region-of-interest evaluation in emission tomography IEEE Trans. Med. Imag. 12 90–100 Huesman R H 1984 A new fast algorithm for the evaluation of regions of interest and statistical uncertainty in computed tomography Phys. Med. Biol. 29 543–52 Huesman R H, Reutter B W, Zeng G L and Gullberg G T 1997 Kinetic parameter estimation from SPECT projection measurements J. Nucl. Med. 38 222P Limber M A, Limber M N, Celler A, Barney J S and Borwein J M 1995 Direct reconstruction of functional parameters for dynamic SPECT IEEE Trans. Nucl. Sci. 42 1249–56 Seber G A F and Wild C J 1989 Nonlinear Regression (New York: John Wiley & Sons) Smith A M, Gullberg G T, Christian P E and Datz F L 1994 Kinetic modeling of teboroxime using dynamic SPECT imaging of a canine model J. Nucl. Med. 35 984–95 Smith A M, Gullberg G T and Christian P E 1996 Experimental verification of 99m Tc-teboroxime kinetic parameters in the myocardium using dynamic SPECT: reproducibility, correlations to flow, and susceptibility to extravascular contamination J. Nucl. Cardiol. 3 130–42 Zeng G L, Gullberg G T and Huesman R H 1995 Using linear time-invariant system theory to estimate kinetic parameters directly from projection measurements IEEE Trans. Nucl. Sci. 42 2339–46
Disclaimer This document was prepared as an account of work sponsored by the United States Government. While this document is believed to contain correct information, neither the United States Government nor any agency thereof, nor The Regents of the University of California, nor any of their employees, makes any warranty, express or implied, or assumes any legal responsibility for the accuracy, completeness, or usefulness of any information, apparatus, product, or process disclosed, or represents that its use would not infringe privately owned rights. Reference herein to any specific commercial product, process, or service by its trade name, trademark, manufacturer, or otherwise, does not necessarily constitute or imply its endorsement, recommendation, or favoring by the United States Government or any agency thereof, or The Regents of the University of California. The views and opinions of authors expressed herein do not necessarily state or reflect those of the United States Government or any agency thereof, or The Regents of the University of California. Ernest Orlando Lawrence Berkeley National Laboratory is an equal opportunity employer.