MEAL SCHEME IN GOVERNMENT SCHOOLS OF CHANDIGARH ... PROFESSOR, DEPT OF COMMUNITY MEDICINE, GMCH SEC-32, CHANDIGARH.
KNOWLEDGE, ATTITUDE, PRACTICES AND NUTRITIONAL STATUS OF STUDENTS AVAILING MID DAY MEAL SCHEME IN GOVERNMENT SCHOOLS OF CHANDIGARH AUTHORS - PRATAP THAKUR1, RAJ KAMAL PATHAK2, NAVEEN KUMAR GOEL3 1. ASSISTANT PROFESSOR, AKAL SCHOOL OF PUBLIC HEALTH & HOSPITAL ADMINISTARTION, ETERNAL UNIVERSITY, BARU SAHIB, HP, 2. PROFESSOR, DEPT. OF ANTHROPOLOGY, PANJAB UNIVERSITY, CHANDIGARH 3. PROFESSOR, DEPT OF COMMUNITY MEDICINE, GMCH SEC-32, CHANDIGARH
Introduction
Material & Methods
Education and learning depend on good nutrition and health. The National and the State governments have been implementing a number of poverty alleviation programmes for the overall socioeconomic development of the community and to mitigate the sufferings of the vast multitudes of the population at risk. Poor nutrition and health among schoolchildren contributes to the inefficiency of the educational system. Children with diminished cognitive abilities and sensory impairments naturally perform less well and are more likely to repeat grades and to drop out of school than children who are not impaired; they also enroll in school at a later age, if at all, and finish fewer years of schooling. The irregular school attendance of malnourished and unhealthy children is one of the key factors in poor performance. Even short-term hunger, common in children who are not fed before going to school, can have an adverse effect on learning. Children who are hungry have more difficulty concentrating and performing complex tasks, even if otherwise well nourished. The Government of India’s National Nutrition Policy, apart from setting nutrition goals to control and prevent malnutrition in the country started National Programme of Nutritional Support to Primary Education (NP-NSPE) as a Centrally Sponsored Scheme on 15th August 1995, initially in 2408 blocks in the country. By 1997-98 it was introduced in all blocks of the country. It was further extended in 2002 to cover children studying in EGS and AIE centers. Cooked mid-day meal is the popular name for the school meal programme which involves provision of lunch –free of cost to school children on all school days.
Objective
Stretching over an area of 114 sq. Kms. Chandigarh is unique, because it is the capital of two state governments, Punjab and Haryana. Chandigarh is a planned city, with a high standard of civic amenities. It has a total population of 10, 55,450 people. It includes 5, 80,663 males and 4, 74,787 females. The city has density of 9,258 persons per sq. km. As per the State Primary Census Abstract data 2011 released by the Census Department, the city has 97.3 per cent population living in urban areas and 2.74 per cent living in rural areas. Sampling Study Area: Government schools of Chandigarh Study Design: Cross-sectional school based survey Study Duration Five months (1st January to 31st May 2012) Study Population: Students of classes 6th, 7th and 8th Sample Size: 1274 Sampling Technique: It was a school based survey of students studying in classes 6th, 7th and 8th . There are 185 recognized schools in Chandigarh with 106 Government and 79 Private schools. The population parameter of the study was all government schools of Chandigarh. For representation each area, U.T Chandigarh was categorized into urban, rural and slums. Therefore 7 schools from urban area were enrolled. Similarly, 3 schools from rural area and 2 schools from slum were randomly selected from the list of all the schools present in respective areas. A randomly selected section of each class (6th, 7th and 8th) from selected schools was taken up for survey. It was ensured that boys and girls get equal representation.
Objective
a) To find out knowledge, attitude and practices of children availing mid day meal attending classes 6th, 7th and 8thof Govt. Schools scheme in government schools of Chandigarh.
Data Collection Administering the questionnaire: - A Semi-structured questionnaire was administered to the students. They were briefed about the rules & regulations for filling the same. They were given 20 minutes to finish. Anthropometric measurements: - All the measurement were taken before meals. A calibrated Anthropometer was used to measure children after removing their shoes in erect position. Bathroom weighing scale was used to measure the weight of students in standing position with sweaters and shoes removed. Mid Upper Arm Circumference (MUAC) was taken with help of calibrated measuring tape Scholastic achievement: - Performance of children in First-term examination in present class was used to determine scholastic achievement. Marks were taken from school records and graded according to CBSE’s grading system for 6th , 7th and 8th ( Statistical Analysis: The data entry was done in MS excel. Statistical analysis was done with the help of SPSS 20. WHO Anthroplus software was used to find out nutritional status of children.
Results Socio-Demographic Profile Distribution of students by location of school
Attitude and Practices of students availing Mid-day scheme
Distribution of students age wise
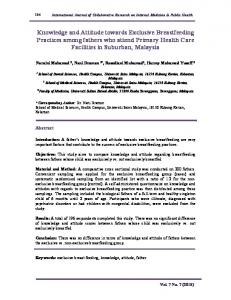
Source of food in school Source Mid-day
Slum 15%
Urban 51%
Mid-day meal
7% 21%
27%
Rural 34%
Slum
10 and less
11
12
13
14
100.00
Sikh 14.84%
Others 0.71%
Girls
45.29%
Muslim
Sikh
Chrstan
Distribution of students class wise
32.18%
35.40%
30.93%
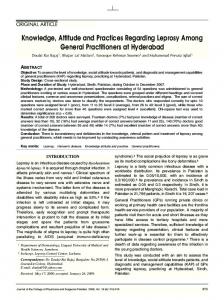
32.42% iv (Upper lower)
More food
223
17.50
Milk
222
17.43
Egg
96
7.54
Something else
66
5.18
Total
1274
100.00
Causes of students not taking mid-day meal regularly
30.53
Cause
Frequency
Percent
No problem
463
36.34
Don’t like taste
455
35.71
Poor-Hygiene
136
10.68
Food is less
111
8.71
Normal
311
24.41
Bad
21
1.65
Very bad
8
0.63
Total
1229
96.47
Parents don’t allow
109
8.56
3.53
Total
1274
100.00
1274
Distribution of grades achieved by students in mid-year examination Grades A1
Frequency 7
Percent 0.57
A2
69
5.61
B1
130
10.58
B2
214
17.41
C1
305
24.82
C2
336
27.34
D
160
13.02
E1
8
0.65
Total
1229
100.00
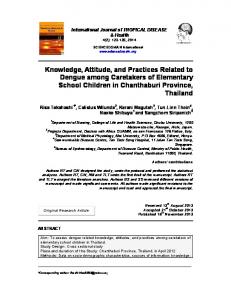
Height for age comparison against WHO Z-scores - All Children
Height for age comparison against WHO Z-scores - Girls & Boys
meal No. of Days
Frequency
Percent
1
107
8.40
2
104 104
6th
7th
8.16 8.16
4
59
4.63
5
58
4.55
6
797
62.56
Total
1229
96.47 3.53
meal at all Total
v (Lower)
100.00
BMI for age comparison against WHO Z-scores - All Children
BMI for age comparison against WHO Z-scores - Girls & Boys
From which class are you taking mid-day meal Class
Frequency
Percent
1
366
28.73
2
158
12.40
3
166
13.03
4
142
11.15
5
113
8.87
6
139
10.91
7
81
6.36
8
64
5.02
Total
1229
96.47
How many times a week you take Mid-day
Do not take mid-day 45
iii (Lower middle)
52.35
39.25
Hindu 77.79% Others
22.68%
ii (Upper Middle)
667
500
Total
0.55%
I (Upper)
Fruit
Good
3 0.55%
Percent
Association of scholastic achievement and stunting N Length/height-for-age (%) Grade % < -3SD % < -2SD A1 7 0 0 A2 69 4.3 17.4 B1 130 3.8 14.6 B2 214 8.9 26.2 B2 214 8.9 26.2 B2 214 8.9 26.2 C1 305 5.9 25.9 C2 336 9.2 28.3 D 160 8.1 30 E1 8 25 50 Total 1229 7.4 25.5
meal at all
Hindu
Distribution by SocioEconomic background
389
Do not take mid-day 45
Boys 54%
Boys
Frequency
Frequ Percent ency
15 and more
Muslim 4.95%
Girls 46%
1274
Choice
In your opinion how does food taste?
Religion wise distribution of students Chrstan 1.73%
36.34
Total
Very good
Distribution of students gender wise
463
3.53
Opinion Rural
60.13
Food only from home 45
28%
Urban
+ 766
Homemade food
6% 11%
What will you like to be added to menu?
Frequency Percent meal
Scholastic and Nutritional achievement
Do not take mid-day meal 45 at all Total
1274
3.53
1274
100.00
100.00
8th
References Bhoite R, Iyer U. Magnitude of malnutrition and iron deficiency anemia among rural school children: An Appraisal. Asian J Exp Biol Sci. 2011, 2(2):354–361. Sati V, Dahiya S. Nutritional assessment of rural school-going children (7-9 years) of Hisar district, Haryana. Scientific reports. 2012; 1(7):1-4. The essential package: Twelve interventions to improve the health and nutrition of school-age children.World food programme [ Internet] : New York [ Cited 12 July 2014] Available from: http://www.un.org/esa/socdev/poverty/PovertyForum/Documents/The%20Essential%20Package.pdf. Rosso JMD, Marek T. Class Action: Improving School Performance in the Developing World through Better Health and Nutrition. Washington: World Bank Publications; 01 Jan 1996. Policy Brief: School Health and Nutrition: Manoff Group; Washington: December 2009 [Cited 1 July 2014] Available from: http://www.manoffgroup.com/documents/SchoolhealthandnutritionpolicybriefENGDec09.pdf. Rosso JMD. Investing in school and health and nutrition in Indonesia. Washington, DC: World Bank; 2009. [Cited 10 june 2014] Available from: http://documents.worldbank.org/curated/en/2009/10/12521174/investing-school-health-nutritionindonesia. Deodhar YD, Mahandiratta S, Ramani KV, et al. An evaluation of mid-day meal scheme. J Ind School Political Economy. 2010; 22(1-4): 34-38. Sharma S, Passi SJ, Thomas S, et al Evaluation of mid-day meal programme in MCD schools. Nutrition foundation of India. Delhi: Municipal Corporation Of Delhi; 2006. Scientific Report 18.[Cited 2 July 2014] Available from: http://www.mdm.nic.in/Files/Initiatives%20&%20Case%20Studies/NUTRITION_%20FOUNDATION_%20 OF_%20INDIA.pdf.
Summary & Conclusions It was found 60.13 % of the students were taking food from mid-day meal programme as well as bringing home cooked food 36.33% students reported that they take only mid-day meal at school 3.53% of the students took only home cooked food 36.34% reported that they had no problem with the food and they were taking it regularly 35.71% reported that they don’t like taste 62.56% of the students were taking food regularly six days a week whereas only 8.40% students took MDMs only once Most of the respondents 28.73% reported that they are taking mid-day meal from 1st class 59.42 %( 757) children liked Kadi-Chawal as their favourite recipe with, 32.50%, 30.53% and 37.21% reporting it to be very good Most of students 52.35 %( 667) wanted fruits to be added to their diet other 17.50 %( 223) wanted quantity of food to be increased Out of total 1229 students taking mid-day meal scheme 27.34% students secured C2 grade in first term examination Scholastic performance was seen to be directly linked to nutritional status. In our study, lowest prevalence of stunting was found in Students who were achieving high grades. On trying to find out relation of malnutrition with socio-economic variables it was found that Stunting (-2SD) has highest prevalence in Lower class (42.9%) and it decreases with increasing socioeconomic status. Severe stunting was also highest among lower class at 14.9%. Thinness (-2SD) has highest prevalence among upper middle class at 24.4% where as severe thinness (-3SD) was highest among upper class at 7.3%. It was lowest among Lower class. Obesity (+2SD) has highest prevalence among Lower middle class i.e. 2.2%. The study revealed that Chandigarh is facing problem of adolescent malnutrition. Malnutrition is affecting mostly the people of poor socio-economic group.09-16 is an age group which will take responsibility of our country’s future. These adolescents are facing double edged problem as malnutrition also affects educational performance The positive finding is that Students like their meals which proves it is meeting some objectives though not all of them as revealed by poor scholastic scores and high prevalence of malnutrition.
Acknowledgement This poster would not have been possible without the support of many people. I will like to express gratitude to my teachers, staff members and management who were helpful and offered support and guidance. Without their guidance this poster would not have been successful.