waste, the residual is milled and sieved on a 6 cm trommel. The subsequent ... the material was also manually sieved on a 1 cm screen to increase homogeneity.
METHANE OXIDATION AND ATTENUATION OF SULPHURATED COMPOUNDS IN LANDFILL TOP COVER SYSTEMS: LAB-SCALE TESTS R. COSSU, R. RAGA AND M. ZANE IMAGE Department, University of Padua, via Loredan 20, 35131 Padova, Italy
SUMMARY: In new landfills for pretreated waste biogas utilization for energy production might be not profitable and the construction of biogas extraction systems unnecessary, provided that emissions into the atmosphere are strongly reduced or avoided by means of proper design of top cover systems. Lab-scale tests were set up at the IMAGE Department of the University of Padua, to investigate the effectiveness of different kinds of landfill cover soil, even coupled with activated carbon membranes, in the removal of methane and sulphurated compounds from a biogas stream. According to the results of the tests, a top cover system suitable for new landfills for mechanical biological pretreated waste will be proposed as a sole system for biogas emissions control. 1. INTRODUCTION Biogas production in new landfills for pretreated municipal solid waste might be reduced by up to 90% of what expected in traditional landfills (Leikam and Stegmann, 1997). In such landfills, biogas utilization for energy production will be not profitable and the construction of biogas extraction systems might be unnecessary, provided that emissions into the atmosphere are strongly reduced or avoided by means of proper design of top cover systems. Results of lab-scale and pilot-scale tests have proven that methane oxidation and degradation of trace organic compounds in biogas can occur (Scheutz and Kjeldsen, 2001; Humer and Lechner, 1999) in landfill cover soil. In particular, ripe compost from municipal solid waste provides excellent properties as a carrier for methane oxidation processes and it could be used as cover soil (Humer and Lechner, 1999). The main purpose of research was to investigate the behaviour of different kinds of materials considered as possible landfill cover soil, even coupled with activated carbon membranes, with respect to the methane oxidation and the adsorption of sulphurated compounds usually present in the biogas.
Proceedings Sardinia 2003, Ninth International Waste Management and Landfill Symposium S. Margherita di Pula, Cagliari, Italy; 6 - 10 October 2003 © 2003 by CISA, Environmental Sanitary Engineering Centre, Italy
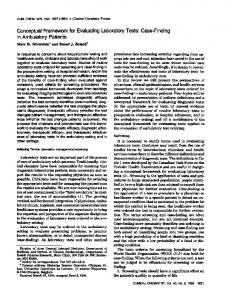
2. MATERIALS AND METHODS Laboratory tests were carried out using six plexiglas columns (height 100 cm, diameter 10 cm), installed in a climate chamber, at the constant temperature of 30 °C. The following materials considered as possible landfill cover soil were employed: • mechanical-biological pretreated municipal solid waste (MBP); • mechanical-biological pretreated biowaste (PB); • fine (PBSf) and coarse (PBSc) mechanical-biological pretreated biowaste and sewage sludge mixtures; • natural soil usually used as landfill cover (NS). Mechanical-biological pretreated municipal solid waste (MBP) were taken at the Legnago municipal solid waste (MSW) pretreatment plant (Verona, Italy). After separation of bulky waste, the residual is milled and sieved on a 6 cm trommel. The subsequent biological treatment of the material passing the sieve consists in forced aeration for two to three weeks and curing phase in windrows for three to four weeks. Before filling the columns, the material was also manually sieved on a 1 cm screen to increase homogeneity. Mechanical-biological pretreated biowaste (PB) were taken at the Este composting plant (Padua, Italy) and are obtained from woody cellulosic residuals and the biodegradable fraction from separate collection of MSW. At the pretreatment plant in Este, cellulosic materials are milled and mixed with the biowaste. Then the mixture is stabilized for 3 weeks by means of forced aeration and a subsequent maturation phase for 45 days in windrows. PBS waste were obtained from the Tergola Consortium of Vigonza (Padua, Italy) after treatment of mixtures of sewage sludge and woody cellulosic residues. The latter are initially milled and mixed with the sludge. Afterwards, the mixture undergoes a bio-oxidation treatment for one month and is subsequently sieved on a 35 mm screen before a 2 months curing phase in windrows. Fine and coarse PBS are obtained by a 1 cm and 2 cm screening respectively. The natural soil (NS) consists of a mixture of filling material and silty-clayey soil as usually employed as cover soil at S. Urbano landfill (Padua, Italy). Even the NS was manually sieved on a 1 cm screen. Prior to filling of columns, all the materials were analysed as reported in Table 1. Void index was calculated as ratio between the empty volume and the solid volume. TOC was tested by chemical oxidation with potassium dichromate. The respiration index was measured using the Sapromat respirometer (mod. E, Voith Gmbh). Heavy metal concentrations were measured, after extraction, by ICP analyser (Varian mod. Perkin Elmer 4200 DV). Other parameter were measured according to Standard Methods. Leaching tests were also carried out at a solid/liquid ratio of 1/20, with distilled water and a solution 1N of acetic acid as elution liquids, mixed in a Jar Test for 24 hours. The analytical results of leaching test are reported in Table 2 and Table 3. Methane, carbon dioxide and oxygen concentrations were measured by means of a mobile landfill gas meter (LFG20). H2S and mercaptans (carbonyl sulphide, ethylmercaptan and isopropyl mercaptan) were analysed on a HP5890 gas-chromatograph equipped with a HP-Plot Q column. The columns were filled with the chosen materials and with the same coupled with activated carbon membranes. The testing materials were filled in to a depth of 60 cm and saturated to about 50% of the field capacity. In order to simulate the condition in the top cover of landfills, biogas (taken from a MSW landfill) was supplied from the bottom and air from the top at a controlled flow rate (see Figure 1). In this way oxygen and methane were able to penetrate into the substrate as under natural landfill conditions. Along the lateral surface of the columns sample points were inserted, for the determination of CH4, CO2 and O2 concentrations trend. The temperature inside the column at the different depth was also measured.
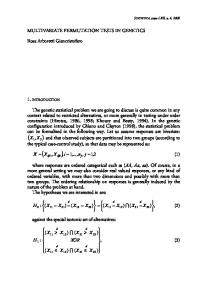
Biogas collected at the landfill was stored in Tedlar bags (SKC 100 litre capacity) and fed into the columns by means of membrane pumps (KNF, model N86 KT.18); the flow rate was adjusted by means of digital flowmeters (Brooks Instruments, model 5850S). Air was blown using aquarium pumps (Prodac, model Air Professional 360) and the flow rate adjusted by means of flowmeters (Brooks Instruments, model Sho-Rate GT1335). Three series of test were carried out. In the first one (Test 1) mechanical-biological pretreated municipal solid waste (MBP), mechanical biological pretreated biowaste (PB) and natural soil (NS) were tested. The columns with the correspondent fillings are shown in Table 4. Columns containing sterilized materials were used as control, where methane oxidation was not expected. Biogas flow rate was adjusted to 10 ml/min corresponding to about 38 l·m-2·h-1 of methane, value that may be considered typical of an active landfill (Humer and Lechner, 1999). This test lasted 35 days. In Test 2 the activated carbon membrane was added in the upper part of the columns, upon the compost layer. Three types of membrane were utilized: 2 • Type 1: 125 g/m 2 • Type 2: 220 g/m 2 • Type 3: 360 g/m These membranes are commonly employed for the daily cover of landfills in order to reduce the emission of smelly substances from waste and at composting plants. Columns with respective fillings are listed in Table 5. In column A2 a sandwich made-up by a compost layer of only 15 cm bounded by a geotextile at the bottom and a membrane type 3 at the top was tested (see Figure 2). Test 2 lasted 44 days. Test 3 lasted 31 days and was carried out to assess the effectiveness of activated carbon membranes on adsorption of H2S and sulphurated compounds. To that end two columns were fed with only biogas, and no air flow was provided. One column was filled with MBP coupled with the membrane, in the other the sole membrane was inserted. Furthermore two columns with sole PBSf and PBSc were run with biogas and air supply as described in Table 6. In the remaining two columns the biogas flow rate was varied (see Table 6) to simulate the expected biogas emissions from old MSW landfills and new landfills for pretreated waste. The flow rate was adjusted to 5 ml/min and 2,5 ml/min respectively, corresponding to 19 l·m-2·h-1 and 9,5 l·m-2·h-1 of methane through the landfill cover (Humer and Lechner, 1999). Outlet
Air
Q2
Q3
60 cm
Sampling point
Q1
Perforated plate
Biogas
Figure 1. Scheme and picture of utilized columns.
Table 1 - Characteristics of the employed materials (TS = total solids). Determinand 3
Density (g/cm ) Void index pH value VS (% dry weight) Water content (% wet weight) Field capacity (% TS) TKN (gN/kg TS) N-NH4 (gN/kg TS) TOC (gC/kg TS) C/N IR4 (mgO2/g TS) Cd (mg/kg TS) Cr (mg/kg TS) Cu (mg/kg TS) Fe (mg/kg TS) Mn (mg/kg TS) Ni (mg/kg TS) Pb (mg/kg TS) Zn (mg/kg TS)
MBP
PB
PBSf
PBSc
NS
0,55 4,6 7,9 32 35 74 11,3 5,0 130 10,1 5,1 0,5 24,5 406 8ֹ001 171 23,4 354 373
0,38 6,0 8,0 59 17 130 20,4 3,2 307 15,0 3,1 0,1 15,2 58,2 7ֹ748 204 12,9 28,1 101
0,45 2,9 7,4 42 31 147 24,9 3,5 290 11,6 2,3 0,1 23,6 164,3 11ֹ261 220 15,9 47,2 310
0,45 9,0 6,5 68 70 193 22,3 2,7 330 14,8 4,2 < 0,02 12,7 97,3 9ֹ643 232 11,3 30,7 284
0,86 4,3 7,4 12 37 55 2,4 0,5 6 2,5 0,4 < 0,02 12,8 23,5 17ֹ160 241 16,5 27,7 37,0
Table 2 - Results of elution tests with distilled water on materials. Determinand BOD5 (mgO2/l) COD (mgO2/l) BOD5 /COD TKN (mgN/l) N-NH4 (mgN/l) N-NO3 (mgN/l) N-NO2 (mgN/l)
MBP
PB
PBSf
PBSc
NS
450 1ֹ625 0,28 89,6 67,7 1,9 1,4
560 1ֹ287 0,43 95,2 39,2 0,7 < 0,01
25 195 0,13 6,7 3,1 9,4 0,9
20 157 0,13 15,1 8,4 34,4 0,4
20 32 0,62 2,8 1,7 2,2 0,1
Table 3 - Results of elution with acetic acid on materials. Determinand Cd (mg/l) Cr (mg/l) Cu (mg/l) Fe (mg/l) Mn (mg/l) Ni (mg/l) Pb (mg/l) Zn (mg/l)
MBP
PB
PBSf
PBSc
NS
< 0,02 < 0,02 0,05 0,91 2,65 0,08 0,10 1,25
< 0,02 0,03 0,22 0,87 2,15 0,06 0,05 0,62
< 0,002 < 0,002 < 0,002 0,02 0,35 < 0,002 < 0,002 0,003
< 0,002 < 0,002 < 0,002 < 0,002 < 0,002 < 0,002 < 0,002 < 0,002
< 0,02 < 0,02 < 0,02 < 0,02 1,68 < 0,02 < 0,02 0,03
Table 4 - Columns, respective fillings and operative conditions (MBP = mechanical-biological pretreated municipal solid waste, PB = mechanical-biological pretreated biowaste, NS = natural soil). Column A1 B1 C1 D1 E1 F1
Type of filling Sterilized MBP MBP Sterilized PB PB Sterilized NS NS
Biogas flow rate
Air flow rate
0,6 l/h
2,7 l/h
Table 5 - Columns, respective fillings and operative conditions (MBP = mechanical-biological pretreated municipal solid waste, NS = natural soil).
Table 6 -
Column
Type of filling
Biogas flow rate
Air flow rate
A2 B2 C2 D2 E2 F2
Geotextile + MBP + Membrane type 3 MBP + Membrane type 1 MBP + Membrane type 2 MBP + Membrane type 3 MBP NS + Membrane type 3
0,6 l/h
2,7 l/h
Columns, fillings and operative conditions (PBSf = fine mechanical-biological pretreated biowaste and sewage sludge, PBSc = coarse mechanical-biological pretreated biowaste and sewage sludge, MBP = mechanical-biological pretreated municipal solid waste). Column A3 B3 C3 D3 E3 F3
Type of filling PBSf PBSc Membrane type 3 MBP + Membrane type 3 MBP + Membrane type 3 MBP + Membrane type 3
Biogas flow rate (l/h) 0,60 0,60 0,60 0,60 0,30 0,15
Air flow rate (l/h) 2,7 2,7 no air flow no air flow 2,0 2,0
Activated carbon membrane
15 cm compost layer
Geotextile
Figure 2. Picture of column A2 (“sandwich”).
3. RESULTS AND DISCUSSION Methane degradation process was studied indicating oxidation rate as mass of methane oxidated per surface and time unit. This rate was calculated by means of a partial mass balance, assuming the system in stady state. The amount of methane oxidized was determined as difference between inlet and outlet mass in a day. Methane oxidation rate was calculated as ratio between the oxidized mass and the inlet mass, divided by surface of the base of the column. Mean methane oxidation rate was also calculated as arithmetic mean excluding the values relating to the adaptation phase (i.e. the phase when methane oxidation does not occur). In Test 1 only CH4, CO2 and O2 concentrations were monitored. The influence of activated carbon membranes on H2S adsorption was considered in Test 2 and 3. During Test 2 and 3 the temperature was monitored and an increase of up to 3 °C was observed in the upper part of the columns. The main results obtained are discussed below. 3.1 Test 1 In columns B1, D1 and F1 methane oxidation started after an adaptation phase that lasted 3 days for column B1, 10 days for column D1 and 2 weeks for column F1. Afterwards, methane oxidation occurred in the same columns at different rates, with a maximum of 16,5 gCH4·m-2·h-1 for column B1 at day 28 of test; a maximum of 13,7 gCH4·m-2·h-1 for column D1 at day 28 and a maximum of 8,9 gCH4·m-2·h-1 for column F1 at day 32. Maximum percentage reductions were of 48,9% in B1, 41,0% in D1 and 26,5% in F1 respectively. The highest mean oxidation rates were observed for MBP and PB composts and were equal to 10,3 and 9,5 gCH4·m-2·h-1 in columns B1 and D1 respectively, while in the column F1 (natural soil) lower values (with a mean value of 6,7 gCH4·m-2·h-1) were observed probably due to the low organic content. In the control columns the reduction of methane concentration was very low and it might be assumed that microbial oxidation of methane in these columns did not occur. Figure 3 shows the comparison of the measured gas profiles within the control (A1, C1, E1) and the active (B1, D1, F1) columns. It can be seen that in control columns concentration profiles for methane and carbon dioxide are almost identical; oxygen and nitrogen profiles indicate that the air pumped from the top is penetrating throughout the whole column. In active columns methane concentration profile shows a decrease upward towards the surface, with a maximum gradient around 20 cm form the bottom. The decrease of carbon dioxide along the column was much lower than what observed for methane, indicating a CO2 production. Moreover, oxygen decreases very quickly downward along the column and reaches zero at the depth of about 25 cm. 3.2 Test 2 Different lag phases were observed in the columns during Test 2 also: methane oxidation started respectively after 3 weeks in A2, 10 days in B2, 4 days in C2, 9 days in D2 and F2, 2 weeks in F2. The results obtained are similar to ones of Test 1, apart from columns A2 and B2 where mean methane oxidation rate was lower and respectively of 6,1 and 4,5 gCH4·m-2·h-1. For column A2 this could be due to the narrow thickness of the compost layer and to the consequent low contact time with the biogas. The maximum mean oxidation rate was observed in column D2 and it resulted equal to 9,4 gCH4·m-2·h-1. Mean oxidation rate in other columns was 8,7 gCH4·m-2·h-1 in column C2, 8,8 gCH4·m-2·h-1 in column E2 and 3,9 gCH4·m-2·h-1 in column F2. The maximum oxidation rate was 9,5 gCH4·m-2·h-1 in column A2 (at day 36), 7,7 gCH4·m-2·h-1 in column B2 (at day 31), 16,5 gCH4·m-2·h-1 in column C2 (at day 44), 17,4 gCH4·m-2·h-1 in column D2 (at day 38), 17,2 gCH4·m-2·h-1 in column E2 (at day 30), 6,9 gCH4·m-2·h-1 in column F2 (at day 30 and
37). Maximum percentage reductions were respectively of 28,3% for A2, 22,3% for B2, 50,2% for C2, 49,3% for D2, 48,5% for E2 and 19,0% for F2. With reference to the gas-chromatographic analysis, H2S was detected in the inlet biogas in concentrations up to 460 ppm and at outlet of column E2 (up to 50 ppm), the only one without the activated carbon membrane. In the other columns the H2S concentration at outlet resulted lower than the detection limit (0,5 ppm). Mercaptans were present only in the biogas at inlet: particularly, carbonyl sulphide was present up to 0,7 ppm, ethylmercaptan up to 0,6 ppm and isopropyl mercaptan up to 4,7 ppm. All mercaptans resulted lower than the detection limits already at the first sampling point. The following Figure 4 shows the representative gas depth profiles for all columns except A2 (where the compost layer was too thin to build a depth concentration profile).
10
Column C1
Column E1
Concentration (% vol)
Concentration (% vol)
Concentration (% vol)
20
30
40
50
60
70
0
10
20
40
50
60
0
70 0
10
10
10
20
C O2 C H4 O2 N2
30
20
C O2 C H4 O2 N2
30
Depth (cm)
0
40
50
50
50
20
30
40
50
60
0
10
20
30
40
50
60
0
10
10
10
30
20
30
C O2 C H4 O2 N2
Depth (cm)
0
Depth (cm)
0
C O2 C H4 O2 N2
50
60
70
Concentration (% vol) 70
0
20
40
Column F1
Concentration (% vol) 70
30
C O2 C H4 O2 N2
Column D1
Concentration (% vol) 10
20
30
40
0
10
20
40
Column B1
Depth (cm)
30
0
Depth (cm)
Depth (cm)
0
Column A1
20
30
40
40
40
50
50
50
10
20
30
40
50
60
70
C O2 C H4 O2 N2
Figure 3. Representative gas depth profiles for control columns (A1, C1, E1) and active columns (B1, D1, F1).
Column B2
Column D2
Concentration (% vol) 10
20
30
40
50
60
Concentration (% vol) 70
0
10
20
30
40
50
Concentration (% vol)
60
70
0 0
10
10
10
20
C O2 C H4 O2 N2
30
20
Depth (cm)
0
Depth (cm)
0
C O2 C H4 O2 N2
30
40
50
50
50
10
20
30
40
50
60
0
10
10
C O2 C H4 O2 N2
Depth (cm)
0
30
40
50
60
70
Concentration (% vol) 70
0
20
30
Column E2
Concentration (% vol) 0
20
C O2 C H4 O2 N2
30
40
Column C2
10
20
40
Depth(cm)
Depth (cm)
0
Column F2
20
10
20
30
40
50
60
70
C O2 C H4 O2 N2
30
40
40
50
50
Figure 4. Representative gas depth profiles for columns B2, C2, D2, E2 and F2. 3.3 Test 3 Different adaptation phases were observed during Test 3 also: methane oxidation started after 10 days in column A3, one week in the other columns (B3, E3 and F3). In the first two columns A3 and B3 mean methane oxidation rate resulted equal to respectively 4,0 and 8,8 gCH4·m-2·h-1. The low rate in column A3 may be due to the lesser void index corresponding to a lower retention time of biogas within the column. The maximum oxidation rate for column A3 was 8,1 gCH4·m-2·h-1 (at day 12), while for column B3 was 14,3 gCH4·m-2·h-1 (at day 29). Maximum reduction percentage was 23,7% for A3 and 40,8% for B3.
H2S was present in the biogas at inlet in concentrations up to 490 ppm and at outlet up to 85 ppm. Mercaptans was found only in the inlet biogas and resulted lower than instrumental limits already at the first sampling point. The efficacy of activated carbon membranes was observed in columns C3 and D3 where air was not blown; hydrogen sulphide and mercaptans were found in the biogas at inlet, but not at outlet. H2S resulted present in concentrations up to 384 ppm, carbonyl sulphide up to 0,08 ppm and ethylmercaptan up to 0,48 ppm. The isopropyl mercaptan wasn’t detected. Besides, no methane absorption was observed by membrane and the material inside the column. In the last two columns E3 and F3 the maximum reduction percentage was equal to respectively 39,4 and 69,7%; the mean oxidation rates were of 5,2 and 4,9 gCH4·m-2·h-1, while maximum oxidation rate was respectively 7,4 gCH4·m-2·h-1 (day 26) and 6,2 gCH4·m-2·h-1 (day 24 and 26). The following Figure 5 shows the representative gas depth profiles for columns A3, B3, E3 and F3.
10
Column B3
Column E3
Concentration (% vol)
Concentration (% vol)
Concentration (% vol)
20
30
40
50
60
70
0
10
20
30
40
50
60
0
70
10
20
30
40
50
Column F3 60
Concentration (% vol) 70
0
0
0
10
10
10
10
20
CO2 CH4 O2 N2
30
20
30
CO2 CH4 O2 N2
20
CO2 CH4 O2 N2
30
D e p th (c m )
0
D e p th (c m )
0
D e p th (c m )
D e p th (c m )
0
Column A3
10
20
30
40
50
20
30
40
40
40
40
50
50
50
50
Figure 5. Representative gas depth profiles for columns A3, B3, E3 and F3.
4. CONCLUSIONS The results obtained during the study may be summarised as follows: • The development of aerobic degradation processes seems to have caused a temperature increase of up to 3 °C, measured in the upper part of the columns. In the same area the formation of an orange-red band linked to the growth of methanotrophic populations was also observed (Humer and Lechner, 1999). • The maximum methane oxidation rate was observed for MBP and it resulted equal to 17,4 gCH4·m-2·h-1. Similar results were obtained for PB e PBSg (see Table 7). Natural soil showed lower oxidation rate.
60
70
CO2 CH4 O2 N2
Table 7 - Summary of obtained results: minimum, maximum and mean methane oxidation rate, expressed as gCH4·m-2·h-1. Minimum oxidation rate
Maximum oxidation rate
Mean oxidation rate
MBP PB PBSf
6,9 5,7 0,9
17,4 13,7 8,1
10,3 9,5 3,6
PBSc
2,7 4,1
14,3 8,9
8,8 6,7
Material
NS
• Hydrogen sulphide was completely adsorbed by activated carbon membranes. • Carbonyl sulphide and ethylmercaptan, present in the biogas in concentrations up to 0,7 ppm
resulted lower than instrumental limits (0,01 ppm) already at the first sampling point. The same happened for the isopropyl mercaptan, present in the biogas in concentrations up to 4,7 ppm and lower than instrumental limit (0,1 ppm) already at the first sampling point. Probably they are absorbed by filling materials. • Activated membranes do not influence the methane oxidation process.
REFERENCES Leikam K., Stegmann R. (1997). Mechanical biological pretreatment of residual municipal solid waste and the behaviour of pretreated waste. Proceedings Sardinia 97. Sixth International Landfill Symposium. CISA, Cagliari, vol. I, 463-474. Humer M., Lechner P. (1999). Methane oxidation in compost cover layers on landfills. Proceedings Sardinia 99. Seventh International Waste Management and Landfill Symposium. CISA, Cagliari, vol. III, 403-410. Scheutz C., Kjeldsen P. (2001). Methane oxidation and biodegradation of halogenated organic compounds in landfill soil cover. Proceedings Sardinia 2001. Eighth International Waste Management and Landfill Symposium. CISA, Cagliari, vol. II, 565-574.