In: Mycorrhiza: Occurrence in Natural and Restored… ISBN: 978-1-61209-226-3 Editor: Marcela Pagano © 2012 Nova Science Publishers, Inc.
Chapter 2
LARGE-SCALE DIVERSITY PATTERNS IN SPORE COMMUNITIES OF ARBUSCULAR MYCORRHIZAL FUNGI Javier Álvarez-Sánchez1,*, Nancy C. Johnson2, Anita Antoninka2, V. Bala Chaudhary2, Matthew K. Lau2, Suzanne M. Owen2, Irene Sánchez-Gallen1, Patricia Guadarrama1 and Silvia Castillo1 1
Facultad de Ciencias, Universidad Nacional Autónoma de México. Circuito Exterior, Ciudad Universitaria 04510 México 2 Department of Biological Sciences, Northern Arizona University, Box 5640, Flagstaff, AZ, 86011 USA
ABSTRACT Surprising little is known about the factors controlling Arbuscular Mycorrhizal (AM) fungal diversity and distribution patterns. A better understanding of these factors is necessary before mycorrhizas can be effectively managed for their benefits in ecosystem restoration and agriculture. The goal of this chapter is to examine the relationships between AM fungal diversity, plant diversity and latitude across a variety of vegetation types and disturbance regimes. We created a large database by compiling seven distinct datasets from across North America to test the hypotheses that 1) diversity of AM fungal communities should be positively related to plant diversity; 2) AM fungal diversity should be higher in low latitudes than in high latitudes; and 3) disturbance and land use should influence AM fungal diversity. The database was composed of 523 samples collected by research groups from Mexico and United States of America with eight different vegetation types and land uses. Abundance of 121 AM fungi taxa as well as data on geographic location, vegetation type, and disturbance history were included in the database. Contrary to our expectations, species richness and evenness of AM fungal spore communities were not correlated with plant richness or latitude. The influence of disturbance on AM fungal species diversity varied with climate. Our findings indicate
*
[email protected]
30
Javier Álvarez Sánchez, Nancy C. Johnson, Anita Antoninka et al. that the factors controlling community diversity differ for plants and mycorrhizal fungi. Disturbance influences AM fungal spore diversity, and the outcome of these effects varies among ecosystems.
Keywords: Arbuscular mycorrhizal fungi, disturbance, diversity, land use, North America.
INTRODUCTION Arbuscular mycorrhizal (AM) fungi are ancient soil organisms belonging to the Phylum Glomeromycota (Schüler et al. 2001). These fungi form obligate symbiotic relationships with plant roots in most terrestrial ecosystems (Trappe 1987, Harrison 1997, CamargoRicalde 2002). In this symbiosis, the fungi facilitate plant uptake of soil resources and reciprocally gain fixed carbon (Smith and Read 1997). Moreover, AM fungi can affect plants‘ competitive abilities (Guadarrama et al. 2004) and play a determinant role in regeneration and plant succession (Carey et al. 1992, Allsopp and Stock 1994, Kardol et al. 2006). Mycorrhizal hyphae contribute to soil aggregate formation, soil conservation and reestablishment of plants in disturbed areas (Bethlenfalvay 1992, Cuenca et al. 1998, Miller and Jastrow 2000). In this regard, AM fungi play key roles in plant community structure, and ecosystem processes. Despite their wide distribution and importance in ecosystems, the factors that influence the geographic distribution of AM fungi in natural and managed ecosystems are still unclear, in large part because of the difficulty of studying these fungi in nature, and the complex factors that can affect their distribution. Chaudhary et al. (2008) proposed a model for Glomeromycotan biogeography that illustrates this complexity. In the early Devonian (400 million years ago), plants had endophytic associations resembling vesicular–arbuscular mycorrhizas (Brundrett 2002), and continental drift may have contributed to diversification and large scale distribution patterns of AM fungi (Allen et al. 1995, Chaudhary et al. 2008). At a more proximate timescale, abiotic forces such as climate and soil properties, combined with biotic forces such as host plant community composition and inter- and intra-specific interactions are likely to be important factors (Rillig et al. 2002, Pringle et al. 2009). Furthermore, Glomeromycotan distribution may be controlled by intrinsic properties of the fungi such as their dispersal ability (Warner et al. 1987) and speciation and extinction rates (Chaudhary et al. 2008). Finally, disturbance history is likely to be an important driver of Glomeromycotan biogeography (Egerton-Warburton et al. 2007, Alguacil et al. 2008). Glomeromycota are obligate biotrophs, consequently, their distribution is ultimately dependent on the distribution of living plants. Despite this restriction, AM fungi are often reported to have low host specificity because in controlled experiments individual fungal taxa have been shown to colonize hundreds of different plant species (Trappe 1987, Allen et al. 1995, Sanders 2003). However, upon closer examination, AM fungi do exhibit some degree of host preference in natural systems (Bever et al. 2001, Helgason et al. 2002); certain taxa of AM fungi proliferate with certain plant species (e.g. Johnson et al. 1992, Bever et al. 1996, Helgason et al. 1998, Vandenkoornhuyse et al. 2002). Several studies show that AM fungi can influence plant diversity and productivity (van der Heijden et al. 1998, Hartnett and Wilson 1999). Moreover, it has been reported that individual species of AM fungi and different assemblages of fungal taxa have variable effects on plant productivity and community structure (Klironomos et al. 2000, Klironomos 2002). Consequently, mycorrhizal
Large Scale Diversity Patterns in Spore Communities …
31
symbioses may influence how plant species coexist and how soil resources are distributed among co-occurring plant species (van der Heijden et al. 2003). It is clear that AM fungi are an important regulator of plant community structure, but what are the reciprocal effects of plants on the community structure of AM fungi? Wardle et al. (2004) suggest that aboveground and belowground diversity is often linked, but studies show contradictory patterns in the relationship between plant diversity and mycorrhizal fungal diversity. Arbuscular mycorrhizal fungal diversity may have positive (Burrows and Pfleger 2002, Oehl et al. 2003, Chen et al. 2004, Börstler et al. 2006), negative (Pietikäinen et al. 2007, Antoninka in preparation), no relationship (Johnson and Wedin 1997), or scale dependent relationships (Landis et al. 2004) with plant diversity. There is generally a negative relationship between diversity and latitude among many groups of macro and microorganisms (Rosenzweig 1995, Kaufman and Willig 1998, Willig et al. 2003), though exceptions exist (Hillebrand 2004, Hughes et al. 2006). Since tropical plant communities are generally much more diverse than temperate plant communities, one may expect that AM fungal diversity may also exhibit a negative relationship with latitude. Surprisingly little is known about latitudinal patterns in AM fungal distribution. Taxonomists have informally noted that AM fungal diversity appears to be greater in tropical locations, with a greater diversity of Gigasporaceae species in particular closer to the equator (Walker 1992, Herrera-Peraza et al. 2001). Formal comparisons of AM fungal diversity between tropical and temperate locations using field spore data (Chaudhary et al. in preparation) and meta-analysis (Öpik et al. 2008) have demonstrated higher diversity in the tropics (but see Stutz et al. 2000). Studies within temperate North America, have demonstrated latitudinal gradients in species distributions (Koske 1987, Allen et al. 1995), but a large-scale latitudinal gradient study of AM fungal species that spans temperate and tropical locations has never been conducted for AM fungi. Disturbance can play a pivotal role in ecosystems from promoting species diversity (Odion and Sarr 2007) to reducing ecosystem function and diversity (Jiménez-Esquilina et al. 2007, Odion and Sarr 2007), depending on the type and severity of the disturbance. AM fungi can be sensitive to disturbances that alter soil characteristics, such as tillage, agricultural and land management practices. But, can these disturbances influence AM fungal diversity? Tillage practices can alter AM fungal community composition and reduce sporulation of certain AM species (Jansa et al. 2002, Alguacil et al. 2008). Nitrogen enrichment or fertilization can reduce or increase AM species richness and diversity depending on the amount of available phosphorus and types of available host-plants (Egerton-Warburton et al. 2007). As the amount of N-deposition increases, it can promote a shift in AM fungal species composition, favoring certain Glomus species and displacing ‗larger‘ spore species (EgertonWarburton and Allen 2000). Soil compaction has been shown to reduce or have no effect on AM fungal colonization (reviewed in Entry et al. 1996, Nadian et al. 1997). Management practices, such as forest fuel reduction, can reduce AM fungal propagule abundance (Korb et al. 2004), reduce AM species richness and alter community composition (Owen et al. 2009). Disturbances associated with exotic plant invasions can either inhibit or promote AM fungal growth (Pringle et al. 2009). Disturbances associated with climate change can also influence the distribution of AM fungi. Simulated climate change, by warming can increase the hyphal length of AM fungi and root colonization (Rillig et al. 2002). CO2 enrichment tends to increase AM fungal abundance while N deposition tends to decrease AM fungal abundance (reviewed by Treseder 2004).
32
Javier Álvarez Sánchez, Nancy C. Johnson, Anita Antoninka et al.
Some AM fungi respond differently to soil disturbances, for example Hart and Reader (2004) found that species from the suborder Glomineae were much less resilient to soil disturbances than species from the suborder Gigasporineae, likely due to the traits of either colonizing plant roots mostly by hyphae or by spores. Molecular methods are increasingly useful for identification of Glomeromycota in field collected samples (Börstler et al. 2006, Hempel et al. 2007), and these methods have been successfully applied to biogeographical studies (Oehl et al. 2003, Öpik et al. 2008). However the usefulness of molecular data to study large scale patterns of AM fungal diversity is limited because currently there are relatively few data sets available which use the same gene regions to identify AM fungi. Unlike molecular data, many data sets of AM fungal spore populations from a wide range of locations are currently available. Analysis of AM fungal spore populations in soils can provide a useful indicator of community composition and diversity (e.g. check Bever et al. 2001, check Landis et al. 2004) as long as the strengths and weaknesses of this method are recognized (Table 1). Spore community data does not provide a perfect measure of AM fungal diversity because not all AM fungi produce spores (Clapp et al. 1995). Also, there is no relationship between spore abundance and total fungal biomass in roots and soils; some taxa of AM fungi produce copious spores, while other taxa produce very few spores per unit biomass. Consequently cross-species comparison of spore abundance is not useful; however, within a single species of AM fungus, comparison of spore abundance across treatments or environmental gradients can be very informative (e.g. Johnson et al. 1991, 1992). Furthermore, large scale patterns in species richness and community composition of AM fungal spores across environmental gradients can be very useful (e.g. Egerton-Warburton et al. 2007). This chapter reports the results of a large-scale study of the species richness, evenness and diversity of AM fungal spores across temperate and tropical latitudes and plant diversity and disturbance gradients in natural and managed lands. The goal of this chapter is to help elucidate the factors controlling the distribution and diversity of this important group of fungi by addressing three questions. First, what is the relationship between plant diversity and AM fungal diversity? Second, is AM fungal diversity greater at tropical latitudes than temperate latitudes? Finally, how does disturbance and land use influence AM fungal diversity? Table 1. Strengths and weaknesses of spore analysis Strengths Spore population data CAN Elucidate occurrence of spore-forming AM fungi Inform ecological inferences within morphospecies of AM fungi Measure reproductive allocation to spores Reveal patterns in AM fungal community structure
Weaknesses Spore population data CAN NOT Detect occurrence of AM fungi that do not sporulate Inform ecological inferences between morpho-species of AM fungi Measure total biomass of AM fungi Reveal AM fungal functioning
Large Scale Diversity Patterns in Spore Communities …
33
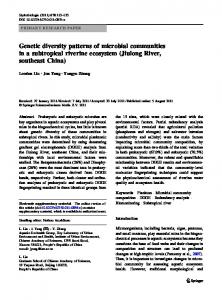
METHODS We compiled seven distinct datasets to generate a large database composed of 523 samples from 8 sites in Mexico and United States of America (USA) (Figure 1). These sites included eight distinct vegetation types and land uses: tropical wet forest, tropical dry forest, temperate forest, pasture, grassland, shrubland, old field and cropland. More details of the study sites can be found in Table 2. A total of 121 AM fungal taxa were reported in the database, of which 76 were identified to species. Geographic location, disturbance history, climate and soil properties were included in the database. Although data were collected by different researchers and for different purposes, our collection techniques were similar enough to allow for useful comparisons.
Figure 1. Map of sites location, according to vegetation type.
Sample Collection and Spore Extraction USA sites - Soils were collected using a pipe or soil sampler ranging in size from 2.5 to 5 cm in diameter and 15 to 20 cm deep. Soils were placed in plastic bags and stored frozen until they were processed. Spores were extracted from soils using a modified wet-sieving and
34
Javier Álvarez Sánchez, Nancy C. Johnson, Anita Antoninka et al.
density centrifugation technique (Gerdemann and Nicolson 1963, McKenney and Lindsey 1987). A 25 g to 30 g soil sample was placed in a 2 L bucket and vigorously filled with water. The soil suspension was poured through two nested sieves with 250 μm and 25 μm openings. Material collected on the 250 μm sieve was rinsed into a petri dish and spores were picked out using a fine forceps. Material collected on the 25 μm sieve was rinsed into (50 ml) centrifuge tubes and spun at 500 g for 3 minutes. The supernatant was poured away and the pellet re-suspended in 2M sucrose and spun at 500 g for 1.5 minutes. The sucrose supernatant was collected on the 25 μm sieve, and the sucrose residue was rinsed away using tap water. The rinsed material was suctioned through a gridded membrane filter and a subsample of spores on the filter were scraped off the membrane filter and mounted on microscope slides using polyvinyl-lacto-glycerol (PVLG). Spores were counted and identified morphologically using a compound microscope (200 - 1,000X). Spores were identified to species using original species descriptions (Schenck and Perez 1990) and on-line references of species descriptions (INVAM, http://invam.caf.wvu.edu and http://www.lrz-muenchen.de/~ schuessler/amphylo). Mexican sites - Soils were collected and stored as USA sites. We applied the wet sieving and decantation technique by Gerdemann and Nicolson (1963), modified by Brundrett et al. (1996). Spores were separated from 100 g (50 g for Tropical Dry Forest and Temperate Forest) of soil by wet sieving and decanting (Gerdemann and Nicolson 1963). Each swirling soil suspension was poured through two mesh sieves, 700 and 45 µm. The sediment was suspended (in water) and sieved again. This process was done 3 times. Table 2. General description of the study sites General site description Cedar 2200 ha Natural Creek Reserve 50 km. LTER in The BioCON Minnesota, experiment is USA described in Reich et al. (2001)
Location (lat/long) 45°24′N, 93°11′W
Grand StaircaseEscalante National Monument, Utah, USA
37°24′N, 111°41′W
Study site
An area of 769,000 ha near the towns of Big Water, Cannonville, Escalante, and Boulder.
MAP and MAT 800 mm; 6.7ºC
296 mm; 10ºC
Vegetation type/ land use (and number of samples) (1) Old forest, abandoned agricultural fields and pristine savannah and grasslands (15)
Disturbance P, ES, LS
(2) Grasses Agropyron repens, Bromus inermis, Koeleria cristata, Poa pratensis, Andropogon gerardii, Bouteloua gracilis, Schizachyrium scoparium, Sorghastrum nutans; herbaceous Achillea millefolium, Anemone cylindrica, Asclepias tuberosa, Solidago rigida, and N-fixing legumes Amorpha canescens, Lespedeza capitata, Lupinus perennis Petalostemum villosum (186) Shrubland with Artemisia ES, tridentata and Artemisia filifolia LS, P (216)
35
Large Scale Diversity Patterns in Spore Communities … PinyonJuniper, Colorado, USA
Semi-arid, midlatitude Steppe
37°49′N, 108°55′W
480 mm; 8.9ºC
Shrubland with Pinus edulis, Juniperus osteosperma, Quercus gambelii, Cercocarpus montanu, Elymus elymoide, Bouteloua gracilis (70)
HD, P
Taylor Woods Ponderosa pine, Arizona, USA
Growing stock was established in 1962 and every 10 years since, study areas have been maintained at a range of growing stock levels within an even-aged management strategy At southern Mexico City, Central Mexico
35°16′N, 111°43′W
560 mm; 6ºC
Semi-arid montane conifer forest (21)
ES, LS, P
19°14′ to 19°17′ N, 99°19′ to 99°16′W
1200; 1100 mm lower altitude; 7.1, 9.2 to12° C
LS, P
Los Tuxtlas Biosphere Reserve, southeastern of Veracruz State
18°32‘ to 18°37‘ N, 95°02‘ to 95°08‘ W
4500 mm; 24ºC
Dominant species are Pinus hartwegii at the top, Abies religiosa in the middle and Quercus rugosa in the lower altitude (6) Tropical rain forest (7)
At southern Los Tuxtlas.
18°15‘ to 18°24‘ N, 94°41‘ to 94°56‘ W
2900 mm; 24ºC
Tropical rain forest; four land uses were considered: mature forest, successional forest, grassland and maize crop (80)
ES, LS, P
Southern Mexico, at Nizanda, Oaxaca.
16o 38‘ to 1000 mm; 16o 83‘ N, 25ºC 94o 00‘ to 95o 00‘ W
Parcels were grouped in three different successional stages (64)
ES, LS
Temperate forest, Mexico Tropical Rain forest, Veracruz, Mexico, northern site Tropical rain forest, Veracruz, Mexico, southern site Tropical dry forest, Oaxaca, Mexico
P
MAP: Mean Annual Precipitation, MAT: Mean Annual Temperature. HD: high level disturbance; ES: medium level disturbance, early successional; LS: low level disturbance, late successional; P: pristine.
Samples were also centrifuged according to the sucrose density gradients technique by Daniels and Skipper (1982). Soil caught in the small sieve was transferred with water into 50 ml centrifuge tubes and centrifuged (Solbat C-600, 24oC) for 4 min at 3,500 rpm. The supernatant liquid was carefully decanted; the pellet was re-suspended in a sucrose solution (440 g/L) and centrifuged at 3,500 rpm for 50 sec. The supernatant was sieved (45 µm) and washed thoroughly for at least one minute (Walker, unpublished data). A Tween solution (two drops of Tween in 100 ml of water) and 5% chlorine solution were added for one and five minutes, respectively. The solid material from the sieve was washed in a Petri dish. Spores were mounted with PVLG on permanent slides marked with a grid. Spores were counted at a compound microscope at magnification up to 10X. Spores were identified to species as USA sites.
36
Javier Álvarez Sánchez, Nancy C. Johnson, Anita Antoninka et al.
Data Analysis An Analysis of Variance of Multiple Regression (Zar 1999) was conducted for spore species richness, evenness, diversity (using the Shannon diversity index) and total abundance, with the predictors, plant species richness (data were natural log transformed), latitude and disturbance. We used the following disturbance categories: high disturbance, low (early successional), medium (late successional), and mature (pristine sites) (Table 2). Pristine refers to undisturbed sites and high refers to USA sites with severe soil disturbances (e.g., Pinyon-Juniper, Colorado, USA, due to long duration and high temperature fires). Because disturbance effects are different between Mexican (e.g., improved plant species responses) and USA (e.g., negative responses), we analyzed them separately.
RESULTS AND DISCUSSION Table 3 gives the statistical results for each of the analyses discussed below. Table 3. Results of the statistical analysis: F (P); R2 USA
AM fungal spore species richness AM fungal spore species evenness AM fungal diversity (H') AM fungal abundance
Mexico
Plant species richness 2.02 (0.16); 0.01
Latitude
Disturbance level
Plant species richness 5.02(0.03);
0.46 (0.49); 0.001
24.54 (