Layout for Visualizing Large Software Structures in 3D Colin Ware*, Glenn Franck*, Monica Parkhi* and Tim Dudley§ *Faculty of Computer Science University of New Brunswick P.O. Box 4400, Fredericton, N.B., Canada E3B 5A3 Phone: (506) 453-4566 Fax: (506) 453-3566 email:
[email protected]
§Nortel 1285 Baseline Road Ottawa, Ontario, Canada K2C 0A7
Abstract There is increasing evidence that 3D visualization of complex structures has advantages over 2D visualization. While nested directed graphs are an important method of representing information in 2D or 3D, they must be effectively organized in order to be understood. Most work on graph layout has assumed that fully automatic layout is desirable. Through our work with graphs representing large software structures, we have found that, due to the importance of the semantic content, it is necessary to combine automatic layout with manual layout. This paper describes a system called GraphVisualizer3D, which was designed to help people understand large nested graph structures by displaying them in 3D. This system is currently being applied to the problem of understanding large bodies of software. In this paper we present the layout strategy developed for GraphVisualizer3D, which combines manual layout techniques and automatic algorithms in a synergistic manner. In order to facilitate manual layout, a grid system is provided that can be nested to any arbitrary depth. The automatic layout is accomplished by layering followed by a node migration algorithm, whereby nodes migrate to their final position under the influence of a variety of different forces. Options are provided to allow users to switch back and forth between manual layout and automatic layout. GV3D has been tested with large examples containing more than 35,000 nodes and 40,000 relationships.
1. INTRODUCTION The work described in this paper is built on a number of suppositions. First is that representing large structures, such as software calling graphs, in three dimensions (3D) is likely to be better than using two dimensions (2D). Second, that nested graphs are critical for the management of complexity. Third, that manual and automatic layout of structures must be combined for maximum utility. In the introductory sections we justify these suppositions. Following this we describe how manual and automatic layout are combined in a system called GraphVisualizer3D (GV3D) that has been built to aid our understanding of large information structures, and, in particular, software architectures. GV3D represents the static structure of a body of software as a nested directed graph. In this paper we illustrate our work with a case representing the software structure of a large Nortel digital switch as well as smaller examples from our own C++ code. 1.1 2D vs. 3D Visualization Some of the evidence for the advantages of 3D visualization is anecdotal. The Cone Tree construct of Robertson et al has convincingly shown the advantage of a particular conical representation for
April 20, 2000
1
tree structured information in 3D [1]. The authors claim that as many as 1000 nodes can be accessed comfortably with this device. Other evidence is empirical; a number of studies have demonstrated the utility of stereo and motion cues in 3D representations of graph information [2,3,4,5]. It appears that rotation or motion parallax is more important than stereopsis, although both together provide the best viewing conditions. Ware and Franck showed that, where the task was tracing paths in a densely interconnected graph, three times as much information could be discerned if the structures were represented in three dimensions using stereo with motion depth cues [2]. This problem of maintaining focus and context is central to visualizing large structures. One solution for 2D layout is called fisheye views, whereby the 2D space is distorted so that the area of interest is enlarged and surrounding regions are shrunk but still visible in the periphery [6,7]. Another solution is to rely on rapid navigation to maintain context. If it is sufficiently easy to zoom in and out of a display, then, whenever contextual information is required, a quick zoom provides it [8]. In 3D, the problem of navigation is made more complex by the need to maintain viewing direction as well as position in 3D space. One important technique that has been developed is the point of focus zoom that allows for a rapid movement in to or out from a point of interest [9]. We have adapted this method in the system we describe here.
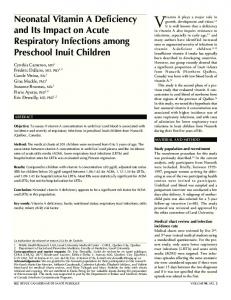
Figure 1. A nested graph in 3D. This example shows three levels of nesting. Each node in the graph can contain a sub-graph. The example shown here represents the structure of a user interface toolkit. The differently colored nodes represent different types of software components, while the differently colored arcs represent different relationships.
April 20, 2000
2
1.2 The Nesting of Graphs A useful method for handling complexity when visualizing large graphs is to hide subgraphs within single nodes. The result is variously called a compound digraph [10], a hierarchical network [7], a metagraph or a nested graph. An example is illustrated in Figure 1. One way of thinking about this kind of graph is to point out that relations between nodes can be represented in either of two different ways. A relationship can be shown by drawing a line between the two nodes, or it can be shown by drawing one node inside the other. Sugiyama calls these adjacency and inclusion relationships, respectively. Inclusion relationships can only be drawn if their subgraph is a tree (or a forest) [10]. In representing software structures, nesting relationships are very common since, in an object oriented approach, many methods will be part of an object, and many objects may be included in a module. Inheritance relationships can also be shown by nesting, so long as there is no multiple inheritance (which would violate the tree principle). One of the major advantages in representing nesting relationships is that nodes containing subgraphs can be shown in either open or closed states. If they are open, then the internal structure is revealed. If they are closed, then this structure is hidden and a single "supernode" is seen. The arcs connecting this node with other nodes now become known as "fat" arcs since each may represent many relations between internal nodes and external nodes. If an information structure is highly modular and hierarchically organized, this provides an effective method for dealing with complexity, since selective areas of detail may be viewed only when needed. This approach has been extensively explored in work by [7, 11] that uses intelligent layout of a nested graph in 2D. The layout automatically changes as nodes open and close to reveal nested structure.
1.3 Layout in 2D and 3D The majority of work on graph layout has been directed towards the problem of fully automatic 2D layout, and, in this context, Eades and Xeumin [12] suggest three general criteria that constitute "good" drawing of directed graphs: 1) Avoid upward pointing arcs. 2) Distribute nodes evenly across the screen. 3) Minimize arc crossings. The first two of these criteria apply equally to 3D layout, except that we wish to distribute the nodes evenly in 3D space, not across the 2D screen. The third criterion, minimizing arc crossings, is less important in 3D for two reasons. The first is that if the image is viewed in stereo or motion, arc crossings can be resolved in depth. The second reason is it that in 3D it is easy to adopt a new viewpoint from which obscured information is clear. This presupposes that 3D manipulation of the viewpoint is made easy. There are many more detailed aesthetic and practical criteria that have been applied to graph layout. Some of the most important relate to the method used to position the nodes in space. Often, layout algorithms use multiple stages, for example, first making the graph acyclic, second assigning nodes to layers and third assigning nodes within the individual layers. There are also many different approaches to the problems involving layout, ranging from simulated annealing, to spring systems, to clustering [13,14,15]. In a spring system, attractive and repulsive spring forces are simulated between nodes. The equilibrium state is then computed at which all the forces balance. One problem with this method is that there may be many solutions, some of which are not appealing. April 20, 2000
3
Simulated annealing is a technique that iterates on a structure, moving nodes towards points of equilibrium. In order to break out of high tension equilibria, random perturbations of the nodes may be introduced during the process. The SemNet project [13] investigated a variety of strategies for 3D layout of graphs, including using semantic distances, connectivity, spring forces and simulated annealing. Although some degree of manual layout was allowed, together with the possibility of anchoring nodes (so that they would not move), the primary focus was on automatic layout. In the following section we provide an overall rationale for the GV3D system. This is a system that we have built to test and evaluate the practical utility of 3D graph visualization. This paper is the first major presentation of GV3D, although there have been a number of previous short reports [16,17]. The major part of this paper is focused on issues relating to layout, beginning with the automatic aspects of the layout followed by the interactive manual techniques and the ways automatic and manual layout coexist. We have evaluated GV3D with examples ranging from our own source code, about 30K lines of C++ code, to the code structure for a 6M line of code Nortel digital switch. This second example graph contains 34,000 nodes with 35,000 relations.
2. DESIGN RATIONALE FOR GV3D It is our belief that relying too much on automatic layout is wrong at the present time since the semantic issues are too difficult. Therefore, our strategy is to design good interactive tidying tools with the goal of having the computer do most but not all of the work. There are numerous and complex relationships between different software objects, and these include calling relationships (which procedures are called by which other procedures), file inclusion relationships and inheritance relationships. These different relationships can be used as the basis for automatic layout algorithms. However, there are also semantic relationships that cannot be automatically extracted.
GV3D is guided by the following four design principles: 1) Layout combining manual and automatic techniques. This approach requires that the algorithms must be fast and take advantage of the nested structure of the data. To provide interactivity, large graphs consisting of tens of thousands of nodes must be laid out in seconds. 2) 3D visualization. There are two primary reasons for concentrating on 3D. The first is the hope of being able to capture and interact with larger structures, while the second is based on the belief that 3D provides a richer environment for displaying complex information structures. Graphical nodes and arcs should have different shapes, sizes and colors reflecting their content. 3) Deep nesting of information. It is important that substructures can he hidden to reduce clutter (by collapsing a sub-graph into a node). With very large structures, nesting of sub-components is also essential to obtain interactivity, simply because this reduces the amount of information that must be draw at a given time . 4) Rapid navigation. Moving in to, out of and around points of interest is essential for the user to learn how parts of the structure relate to one another. Without this, it becomes very difficult for the user to develop a mental map of the structure [18]. 3. LAYOUT IN GV3D To assist our design of layout algorithms, we have developed the following set of layout criteria:
April 20, 2000
4
1) Avoid upward pointing arcs. 2) Highly connected nodes should be placed close together. 3) Unconnected nodes should be moved widely apart. 4) Weighted arcs should be supported in determining placement. GV3D supports arcs having different weights, so that, for example, an inheritance relation can be weighted more heavily than a calling relation. 5) Nesting nodes within nodes should be supported recursively to any arbitrary depth. 6) Nested nodes should be laid out within the parent nodes according to the same criteria that are used for parents. 7) Nodes should be laid out in a series of horizontal layers placed one below the other. 8) Nodes should be laid out in a regular grid pattern within layers. 9) It should be possible to drag and drop nodes in order to move them to new positions. 10) Nodes should snap to the nearest grid intersection. Criteria 7, 8, 9 and 10 above relate to the implementation of grids to assist layout. There are three main reasons for using grids in layout. One is the aesthetic requirement of wanting to create a tidy visual arrangement. The second is that the concept of layers is important in many software engineering applications, which is why the 3D grids are partitioned into a series of layers of horizontal 2D grids. The third is to support manual layout, which becomes much simpler with a grid, especially if nodes can be made to snap to the grid [19].
Graph file (structure only) Define parameters Layout file (positions and appearance)
User Constrained automatic Layout
Manual tidy and structuring
Figure 2. The basic interaction model in GV3D. Automatic layout and manual interactions are alternated and the results can be saved at any time.
3.1 Combining Interactive and Automatic Layout Figure 2 shows an overview of the model of layout within GV3D. Initially, a structure file is read into the system. This can come from a number of sources. For example, in the case of C++ code, we use a code analyzer that is part of the IBM C++ compiler, which produces structure information in the form of a Prolog database. In the case of Nortel Protel code, we were provided with the code structure. This structure, or any other that we wish to visualize, must first be turned into our own graph description language. Once the data has been loaded, the user defines the initial layout parameters such as those determining which kinds of relationships shall be heavily weighted by the automatic layout algorithm. Color and style parameters can also be defined at this stage. Next, the entire graph is given a preliminary layout. Following this, parts of the graph can be tidied up manually as needed. If it is desirable, parts of the graph, or the whole graph, can be laid out again
April 20, 2000
5
with different parameters. The layout can be saved to a file at any time. This file is kept separate from the graph structure file so that many layouts can be saved for a single graph. The entire process is iterative and intended to be ongoing as part of large project management. 3.1 Layout Algorithm The automatic layout algorithm contains two basic steps. Step 1) Determine sizes of nodes and grids: This is based on a recursive algorithm that searches down the containment tree. The size of each node and the grid it contains depends on the size of its nested children. To make the implementation clean the entire graph is nested within a virtual root node - it is virtual because it has no graphical representation. Step 2) Lay out the nested children of each node. This is accomplished in two stages: a) Assign nodes to layers in the 3D grid. b) Assign nodes to positions within a layer using a node migration algorithm. 3.2 Step 1. Sizing Nodes and Grids The size of a node is determined by the size of the grid it contains, and the size of the grid is in turn determined by the number and sizes of the nodes that are laid out within it. Thus, the sizing algorithm is inherently recursive and bottom up; the size of a node depends on the sizes and number of all nested nodes. With the exception of the two smallest nodes (less than two children), there are two possible heights (3 and 7) and three possible base dimensions (1x1, 3x3 or 7x7) for a grid, which map proportionally to the parent node. Space prohibits full details of the method used for determining the size of the 3D layout grid, but it was designed to provide at least twice as much space as would be needed for a dense packing of nodes. An example of 3 levels of nested nodes, together with their grids, is given in Figure 3. The principle we used in choosing the 3D grid appropriate as a container for a particular sub-graph was that the grid should contain at least twice as many cells as necessary to pack the nodes - this was done to allow space for visibility and movement. We also chose to give the nodes a square base and variable heights. We made a closed node 1/5th of the size of an open node. The size of the cells in a grid is the same at any given level of nesting. This is done so that two nodes at the same depth can be opened side-by-side and directly compared. To make this work, the size of the cells in a grid, and thus the size of the node, are relative to the size of grid cells in the parent node's grid. This proportion is referred to as a node's base size. We currently use a value of 1/3 - the grid spacing in an open node is 1/3rd of the grid spacing in the container parent node. There is one exception to this principle, which is the case of the singleton nested node. For example, a single C++ class nested inside a file. In this case, we make the nested node 80% of the size as the parent and when we open the parent the child opens automatically. This anomaly propagates to all children. The purpose of this exception was make nodes as large as possible. Without it singleton nodes were too small.
April 20, 2000
6
Figure 3. A nested graph with the grids made visible. The grids are not normally shown; they only appear during manual layout.
3.3 Step 2. Layout within Nodes The algorithm for positioning nodes nested within container nodes is also recursive. It starts at the nodes contained in the top-level graph and works down through the children nodes, laying out one subgraph inside one single node at each step. This algorithm is top down instead of bottom up because node positions can be affected by siblings of the parent node. Thus, it is necessary that the parent node and siblings of the parent have already been laid out. The algorithm is given in pseudocode in Figure 4 and described in the following sections. There are two stages to laying out within a node. In the first stage the nodes are assigned to layers. In the second stage the nodes are laid out within the layers. Layout(NestedGraph) { // First we assign nodes depths repeat designate roots from among unmarked nodes; this is the set of unmarked nodes with minimum incoming arcs
April 20, 2000
7
for (all root nodes) use a parallel breadth first search to establish the distance from the nearest root. store the path length in the node and mark the node until (all nodes marked) AssignNodesToLayers(NestedGraph); LayoutNodesWithinLayers(NestedGraph); // now we recursively apply the algorithm to all nested subgraphs for (all nested nodes) Layout(nested sub graph); }
AssignNodesToLayers(NestedGraph) { // The purpose of this procedure is to use the distance from the root // node to assign nodes to layers, top down // Full details are not given SurplusLayers = Layers - greatestDepth; // If SurplusLayers is positive (more layers than depths), then // we assign SurplusLayers to depths that have the // greatest concentration of nodes. // If SurplusLayers is negative (more depths than layers), then // we combine adjacent layers that together have the minimum // number of nodes }
LayoutNodesWithinLayers(NestedGraph) { count = MaxCount; repeat for each node starting with the top layer nodes • compute the sum of forces on that node in current position • determine nearest grid position in direction of force vector. • Compute sum of forces on node at that new position if target position is vacant and moving would result in reduced net force then move else if target position is occupied, determine if node in target position can be moved one step in any direction and if the combined move results in a net reduction in force then move. count = count + 1; until (count = MaxCount or no movement occurs) }
April 20, 2000
8
Figure 4. The algorithm to lay out nested nodes has three major components: 1) assignment of depths of the nodes; 2) assignments of nodes to layers; 3) layout within layers. Node migration within a layer is governed by the sum of forces on a node.
Assignment to Layers The purpose of this stage is to spread out the nodes among the available layers. This is done by first defining a set of roots; these are nodes that either have no incoming arcs, or have the least number of incoming arcs. The algorithm does a breadth first search from these root nodes, assigning each node an integer depth from the nearest root. Because this breadth first search uses the direction of the arcs, the result tends to be that arcs point downward, although this is not always the case since there can be cycles. It can occur that certain subgraphs are missed on the initial assignment to layers if they do not contain a root defined on the first pass. As shown in Figure 5, this can occur when there is a cycle in the subgraph. Therefore, the algorithm is repeated for all unassigned nodes until all nodes have been assigned a depth. After the depth has been calculated for each node, these depths are mapped to layers. Recall that the number of layers is fixed, having been specified in the grid sizing operation. b a c
d
Figure 5. A graph consisting of two components. On the first pass, nodes a and b are designated roots. On the second pass, nodes c and d are designated roots.
Assignment within a layer The first stage in placement within a layer is to assign nodes to random positions within the assigned grid layers. Following this, a node migration algorithm is iteratively applied. Nodes move to new position under the influence of a variety of different forces. This algorithm bears some similarity to spring based and simulated annealing methods, but differs in that it is grid based and the forces are heterogeneous and heuristic in nature. Six types of forces are used. Variables used: K is a force type coefficient - it is used for tuning the algorithm. We can, for example, differentially weight the effects of between layer and within layer forces. N is the number of "sub" arcs represented by that "fat" arc. W is a user definable weight that can be used to set the relative influence of an arc type. For example inheritance may be weighted more than file inclusion. d represents a signed distance. S is the size of the grid; i.e., the number of grid cells in either x or z. Units are all in grid coordinates.
April 20, 2000
9
1) Edge force; this forces pushes the node away from the edge of the graph and towards the center. 1 1 Fx = K + (d1 + 1) (d2 + 1) d1 is the distance from the left hand edge of the grid d2 is the distance from the right hand edge of the grid The force F force is calculated independently in x and z 2) Connected force between layers; this results from a connection to a node on a different layer (a relative). It pulls the target node toward the relative as if they were on the same level (it cannot pull the node to another level). F = KWNd d is based on Euclidean distance in the plane 3) Connected force within a layer; this is one of the strongest forces, and applies between from nodes which are connected and within the same layer. The force pulls one node towards the other, with a minimum distance of 1 F = KWN(d − 1) d is based on Euclidean distance in the plane . We subtract a unit vector in the direction of the force. 4) Unconnected force; this is another of the strongest forces. It occurs when two nodes in the same layer are not connected, and the result is a push in the direction away from the other node. S − d F = K S d is based on Euclidean distance in the plane . 5) External force; arcs can connect nodes nested within one node to nodes nested within another (i.e. that are external). This force pulls the target node towards the edge of the grid that is closest to the external node. The components of the force in each of the x and z directions operate independently, as with the edge force. There are two factors influencing the magnitude of the force, one external and the other internal. It is directly proportional to the number of arcs which are connected, and it is proportional to the distance from the node to the edge of the local grid toward which the force is directed. d = (distance to left side) if psibling < p parent Fx = KNd d = (distance to right side) if psibling > p parent psibling = position of the parent' s sibling p parent = position of the parent node 6) Arc force; in order to avoid nodes intersecting arcs, arcs are made to repel nodes.
April 20, 2000
10
K if d ≠ 0 F = dd 100K if d = 0
Node Migration Within Layers The algorithm for node placement is iterative and is a form of simulated annealing. Nodes migrate through the grid depending on the forces that affect them. A node only moves one step at a time, to one of the 8 adjacent grid positions that is closest to the direction of the combined force vector. A node is only moved if it will result in a reduction in energy. If another node is in the way, then we test to see if there is a double move such that the sum of forces on both nodes is reduced. We calculate the effect of moving the node into the blocking node’s location and moving the blocking node to one of its 8 adjacent positions. The nodes are processed from the top layer downwards, either for a fixed number of iterations, or until the subgraph reaches equilibrium.
3.4 Manual Layout and Interaction with the Algorithm The interactive style that is intended for large data sets involves first running automatic layout on the entire graph, followed by subsequent manual layout as we visit the data. This occurs as part of the ongoing effort to understand its functionality and the relationships between the components. Often, the user may wish to group a set of nodes that are known to the user to have similar functionality. The layout of a set of nodes may also occur as a product of design activity. When a designer, or someone involved in a re-engineering project, has an idea for partitioning the objects in a certain way, they will be dragged into different regions of the 3D grid to exemplify the new design. Moving individual nodes Nodes can be moved in a horizontal plane by selecting with the left mouse button and dragging. As soon as a dragging motion is made, the grid appears, as does a ghostly virtual node. The ghostly node functions a 3D cursor to guide the position of the actual node, which snaps automatically to the empty grid position nearest the cursor. If the middle mouse button is depressed with the left mouse button still held, then movement up and down between layers can be accomplished by moving the mouse forward and back. Moving groups of nodes GV3D allows for the selection of a group of nodes by drawing out a bounding box or by means of multiple single node selections using the mouse. Once a group of nodes is selected in this way, the whole set can be moved as a group, in the same way that an individual object can be moved. Setting layout parameters The main layout parameter that is available to the user is the ability to change the weight on different types of arcs. Thus, we typically weight inheritance heavily compared to a simple usage relationship. In a mature system, different applications would have established default weights so that the need for this interaction would be removed from the user. Figure 6 illustrates an example showing the effects of weighting.
April 20, 2000
11
Figure 6. A simple example showing the effects of different weightings. In the example graph on the left, nodes are laid out with the red arcs weighted heavily. In the right graph the same nodes are laid out with the green arcs heavily weighted.
Figure 7. Three stages of design. At the left is the graph before layout. In the middle, the graph has been laid out and a group of nodes are being selected. On the right, the selected nodes are grouped into a module.
Defining new objects GV3D allows for new containment relationships to be interactively formed. The user selects a group of nods and uses a menu option to create a new module that encapsulates the subgraph defined by those nodes and their interconnections. This process is illustrated in Figure 7 in which a group of nodes is selected and encapsulated. Laying out sub-assemblies One of the shortcomings of the algorithm (which is common to the simulated annealing class of methods) is that a node may become stuck behind other nodes, even though a lower energy solution is possible. One option to get around this stalemate situation is to manually move some of the nodes and then continue with the iterative migration procedure layout for that particular sub graph. The user has the option of applying the algorithm recursively to layout all sub-graphs of a selected node, or to eliminate certain anchored nodes from the layout process. 3.5 3D Viewpoint control
April 20, 2000
12
We have designed a set of 3D widgets to allow for the scene to be rotated and translated using either velocity control or position control. They are illustrated in Figure 1. They consist of three translation widgets and two rotation widgets. Each widget has a small rectangle and a triangle attached. Each rectangle is a direct manipulation position control; when it is selected the scene moves with the mouse according to the axis selected. Each triangle provides a velocity control. A second method for moving the viewpoint is a kind of point of focus zoom adapted from [9]. The user can position the cursor over a particular module and depress the middle mouse button. This causes the module to be scaled and simultaneously be moved towards the center of the screen The rate of movement is such that the size changes at a constant rate; the distance towards the target is halved in approximately two seconds, and in the next two seconds it is halved again. Double clicking on a target causes exactly the reverse effect - we zoom back out.
4. SCENARIOS OF USE We are currently investigating three different scenarios of use: 4.1 Training Large software projects may have over 100 new programmers join the development or maintenance teams every year. The time taken for these programmers to appreciate the architecture of the code they are working on is a major expense, as it may be many months before they can do any useful work. It is hoped that 3D visualization of code architecture can shorten this training process and improve the level of understanding. In addition, it may improve the level of understanding of the system even for experienced programmers who have been working on the system for many years. 4.2 Code Management The process of re-engineering often involves the migration of code from one structure or high level architecture to another. This is usually done in a phased manner because of the risks inherent in making too many changes in a single step. 3D visualization can be used to provide an overview of the process, allowing a manager to easily see what parts of the code are where at a given stage in the process. Figure 8 shows an example of the structure of a large digital switch in the process of a major re-organization. The large bundles of arcs clearly show the major code migration patterns. 4.3 Re-Engineering design Re-engineering involves building a new structure from an existing one. A major part of the process may be a discover of the existing relationships and code interdependencies. We have a current project to use 3D visualization to help designers understand complex webs of dependencies.
April 20, 2000
13
Figure 8. A graph showing code migration patterns in a large digital switch that is in the process of a major re-organization.
5. CONCLUSION The 3D layout algorithm combined with a set of interaction techniques has been demonstrated to be a practical and useful interface to large nested graphs. The migration algorithm we describe in this paper has been demonstrated to be fast and flexible, and it provides a straightforward way of combining a variety of layout criteria. The advantage of the migration algorithm, as opposed to spring based systems, is that it readily integrates a heterogeneous set of movement criteria. This method is also very easy to customize for particular applications, since ad hoc forces can be added to satisfy particular requirements. There are many synergies involved in the approach of combining automatic layout techniques with manual techniques. The process of laying out software has much in common with the act of designing and managing software. Both involve understanding the code, increasing cohesion and managing coupling. Laying out code effectively means that modules that are meaningfully related should be positioned together and linked in the graphical representation. What we are suggesting is that the process of visual thinking that is part of organizing materials visually is likely to stimulate exactly the right kind of thinking about code structure.
April 20, 2000
14
Answering the question "which is better, 3D or 2D" is difficult, if not impossible. However, one thing that can be said of 3D is that it enhances the design space, since 2D designs can be subsumed under a 3D design space. However, the larger design space brings with it the need for a much richer set of interaction techniques. We believe that the particular set of techniques described in this paper is an effective and practical interface, and that it can be used with realistically large problem domains. In general, this may be our most significant accomplishment, to have built a 3D network visualization system that has been demonstrated to work for a full scale industrial sized application. Acknowledgments We are indebted to Arthur Ryman at IBM Toronto Labs for his support throughout this project, David Hui, for some of the early development, and Anthony Korsman was especially helpful in obtaining the large data sets we used to test GV3D.
References 1. G.G., Robertson, J.D. Mackinlay and S.K. Card, Cone Trees: Animated 3D Visualizations of Hierarchical Information. CHI'91 Proceedings. 189-194. (1991). 2. C. Ware and G. Franck, Viewing a Graph in a Virtual Reality Display is Three Times as Good as a 2D Diagram, IEEE Conference on Visual Languages. St. Louis, October. 182-183. (1994). 3. R.L. Sollenberger and P. Milgram, The effects of Stereoscopic and Rotational Displays in a Three-Dimensional Path-Tracing Task. Human Factors, 35(3) 483-500. (1993). 4. K. Arthur, K.S. Booth, and C. Ware, Evaluating Human Performance for Fishtank Virtual Reality. ACM Transactions on Information Systems, 11(3), 239-265. (1993). 5. Y. Xiao, and P. Milgram, Visualization of Large Netwoks in 3-D Space: Issues in Implementation and Experimental Evaluation. Proceedings of the 1992 CAS conference. 247258. (1992). 6. M. Sarkar, and M.H. Brown, Graphical Fisheye Views. Communications of the ACM 37(12) 73-84. (1994). 7. J.L. Dill, L. Bartram, A. Ho, and F. Henigman, A continuously variable zoom for navigating large heirarchical networks. IEEE International Conference on Systems, Man and Cybernetics, Oct 2-5. (1994). 8. B.B. Bederson, and J.D. Hollan, Pad++: A Zooming Graphical Interface for Exploring Alternate interface Physics. Proceedings of UIST’94 Nov, 17-26. (1994). 9. J.D. Mackinlay, S.K. Card and G.G. Robertson, Rapid controlled movement through a virtual 3D workspace. SIGGRAPH’90 Conference Proceedings. In Computer Graphics, 24(4) 171174. (1990). 10. K. Sugiyama, and K. Misue, Visualization of Structural information: Automatic Drawing of Compound Digraphs. IEEE Transactions on Systems, Man and Cybernetics, 21 (4). 876-892. (1991)
April 20, 2000
15
11. L. Bartram, A. Ho, J. Dill and H. Henigman, The continuous Zoom: A constrained Fisheye Technique for Viewing and Navigating Large Information Spaces. ACM UIST’95 Proceedings 207-214. (1995). 12. P. Eades and Y. Xuemin. How to draw a directed graph. In IEEE Workshop on Visual Languages. 13-17, (1989). 13. K.M. Fairchild, S.E. Poltrock, and G.W. Furnas, SemNet: Three-Dimensional Graphic Representations of Large Knowledge Bases. In Cognitive Science ad Its Applications for Human-Computer Interaction. Ed Raymond Guindon Lawrence Erlbaum. 201-233. (1988). 14. E.B. Messinger, L.A. Rowe and R.R. Henry. A divide and Conquer Algorithm for the Automatic Layout of Large Directed Graphs. IEEE Transactions on Systems, Man and Cybernetics. 21(1) 1-11. (1991). 15. N. Drew and B. Hendley, Visualizing Complex Interacting Systems. CHI'95 Proceedings, 204-205. (1995). 16. G. Franck and C. Ware, Representing Nodes and Arcs in 3D Networks IEEE Conference on Visual Languages. St. Louis, October. 189-190. (1994). 17. C. Ware and G. Franck, Visualizing Object Oriented Software in Three Dimensions. IBM Centre for Advanced Studies, CASCON'93. IBM and NRC 612-620, Toronto. (1993). 18. L Strausfeld, Financial Viewpoints: Using point of view to enable understanding of information. CHI'95 proceedings, 208-209. (1995). 19. E.A. Bier, Snap-Dragging in Three Dimensions, Computer Graphics, 24(2) 193-204. (1990)
April 20, 2000
16