Jun 16, 2014 - Following. [19], we call the outermost member of a closed family of λ-lines a coherent .... endpoint is close to the center of the expected Lagrangian vortex, and the second ..... Listing 2: Double gyre script for elliptic λ-line LCSs.
arXiv:1406.3527v1 [nlin.CD] 13 Jun 2014
LCS Tool : A Computational Platform for Lagrangian Coherent Structures K. Onu1 , F. Huhn2 , and G. Haller2 1
Mechanical Engineering, McGill University, Montreal, Canada. 2 Institute of Mechanical Systems, ETH Zurich, Switzerland. June 16, 2014 Abstract We give an algorithmic introduction to Lagrangian coherent structures (LCSs) using a newly developed computational engine, LCS Tool. LCSs are most repelling, attracting and shearing material lines that form the centerpieces of observed tracer patterns in two-dimensional unsteady dynamical systems. LCS Tool implements the latest geodesic theory of LCSs for two-dimensional flows, uncovering key transport barriers in unsteady flow velocity data as explicit solutions of differential equations. After a review of the underlying theory, we explain the steps and numerical methods used by LCS Tool, and illustrate its capabilities on three unsteady fluid flow examples.
1
Introduction
Lagrangian Coherent Structures (LCSs) are evolving organizing centers of trajectory patterns in non-autonomous dynamical systems [20, 28, 17]. Applications of LCSs include oceanic and atmospheric flows [4, 23], biological transport problems [34, 31, 21], aeronautics [32], celestial mechanics [13], crowd dynamics [1], and aperiodically forced mechanical oscillators [14]. Haller [15] proposed that ridges of the Finite-Time Lyapunov exponent (FTLE) are heuristic indicators of hyperbolic (i.e., repelling- and attractingtype) LCSs. A number of examples indeed support this principle [28]. Equating FTLE ridges with LCSs, however, would create theoretical inconsistencies, as well as false positives and negatives in hyperbolic LCS detection [16, 26]. In addition, the role of the FTLE field in the accurate detection of elliptic (vortextype) and parabolic (jet-core type) LCSs has remained an open question (but see [3]). More recent work has focused on an exact mathematical formulation of the properties defining LCSs [16, 11, 18, 19, 5]. In two-dimensional flows, hyperbolic 1
and parabolic LCSs turn out to be stationary curves of the averaged material shear [12], whereas elliptic LCSs are stationary curves of the averaged strain [19]. These variational formulations lead to explicit solutions for LCSs as nullgeodesics of appropriate Lorentzian metrics. Here we present a simple algorithmic introduction to geodesic LCS detection without details on the the underlying mathematics. We then review the implementation of this approach in a computational engine called LCS Tool1 . This engine is a library of MATLAB functions that extract LCSs from two-dimensional unsteady flows. The examples we present here have been programmed into demonstration scripts. The list of publicly available software for LCS detection further includes the following packages: • MANGEN [24] calculates FTLE and advects material curves in twodimensional velocity fields. It also includes a graphical user interface and uses MPI for parallel calculations. • LCS MATLAB Kit [7] calculates the FTLE from velocity datasets. Includes a graphical user interface. • Newman [10] calculates the FTLE in N dimensions. Assists ridge extraction of FTLE fields. Supports analytic- and dataset-based velocity definitions. • FlowVC [29] is a general-purpose LCS platform for two- and three- dimensional datasets. Parallel calculations are supported with OpenMP, CUDA and OpenCL. These packages primarily target the automated generation of FTLE plots to aid the visual assessment of hyperbolic LCSs in the flow. The purpose of LCS Tool and this article is to provide an all-purpose numerical engine for the geodesic extraction of LCSs as parametrized material curves in unsteady two-dimensional flows, and extend the scope of such extraction to elliptic LCSs.
2
Theory
We consider two-dimensional, finite-time, unsteady velocity fields of the form x˙ = v(x, t),
x ∈ U ⊂ R2 ,
t ∈ [t− , t+ ].
(1)
Trajectories of (1) are denoted x(t; t0 , x0 ), with x0 ∈ U denoting their initial position in the open set U at an initial time t0 ∈ [t− , t+ ]. The flow map is then defined as Ftt0 (x0 ) := x(t; t, x0 ), mapping initial positions to current positions at time t. The time interval [t− , t+ ] is part of the definition of the finite-time dynamical system (1). This interval 1 LCS
Tool is publicly available at: https: // github. com/ jeixav/ LCS-Tool .
2
may be a time scale of interest or the maximum interval over which velocity data is available from simulations or observations. The right Cauchy-Green strain tensor associated with the flow map is defined as � �T Ctt0 (x0 ) = ∇Ftt0 (x0 ) ∇Ftt0 (x0 ), (2) measuring Lagrangian strain in the velocity field. This tensor is symmetric and positive definite [33]. We label the eigenvalues and eigenvectors of Ctt0 (x0 ) as follows: Ctt0 ξi = λi ξi , 0 < λ1 ≤ λ2 , i = 1, 2; � � 0 −1 |ξi | = 1, ξ2 = Ωξ1 , Ω = . (3) 1 0
2.1
Elliptic LCSs
We seek positions of closed material lines at time t0 that prevail as coherent Lagrangian vortex boundaries (or elliptic LCSs) over a time interval [t0 , t] ⊂ [t− , t+ ]. Haller and Beron-Vera [19] argue that such initial material line positions are closed stationary curves of the averaged strain functional q ˆ σ hr0 (s), C t (r(s))r0 (s)i t0 1 p ds, Q(γ) = σ 0 hr0 (s), r0 (s)i obtained by averaging the tangential strain arising over [t0 , t] along closed material lines parametrized as r(s) with s ∈ [0, σ]. Solutions to this variational problem turn out to be closed orbits of one of two parametrized vector-field families s s 2 λ − λ λ2 − λ1 2 λ η± = ξ1 ± ξ2 , (4) λ2 − λ1 λ2 − λ1 with λ > 0 playing the role of a parameter. Such closed orbits satisfy the differential equation λ r 0 = η± (r), (5) which
� tcoincide 2with � � null-geodesics of the Lorentzian metric family eλ (u, v) = u, Dt0 (r) − λ I v . For this reason, we refer to the computation of elliptic LCSs as limit cycles of (5) as geodesic detection of elliptic LCSs. Any orbit of (5) turns out to stretch uniformly under the flow map Ftt0 . Specifically, any subset of an orbit of (5) increases its arclength precisely by a factor of λ. For this reason, we refer to trajectories of (5) as λ-lines. Following [19], we call the outermost member of a closed family of λ-lines a coherent Lagrangian vortex boundary.
3
2.2
Hyperbolic LCSs
Next we consider positions of material lines at time t0 that prevail as most repelling or attracting material lines (or hyperbolic LCSs) over a time interval [t0 , t] ⊂ [t− , t+ ]. Farazmand et al. [12] argue that hyperbolic LCSs are stationary curves of the averaged shear functional ˆ hr0 (s), Dtt0 (r(s))r0 (s)i 1 1 σ q ds, Dtt0 = [Ctt0 Ω−ΩCtt0 ], Q(γ) = σ 0 2 hr0 (s), Ctt0 (r(s))r0 (s)ihr0 (s), r0 (s)i obtained by averaging the Lagrangian shear arising over [t0 , t] along closed material lines parametrized as r(s) with s ∈ [0, σ]. More precisely, hyperbolic LCSs are stationary curves of Q(γ) with respect to fixed-endpoint perturbations. We note that parabolic LCSs (Lagrangian jet cores) are also stationary curves of Q(γ), but under variable endpoint perturbations (cf. [12]). Solutions to this variational problem turn out to be orbits of the ξ1 or ξ2 eigenvector field. Repelling LCSs (shrinklines) are obtained as trajectories of the differential equation r0 = ξ1 (r), (6) and attracting LCSs (stretchlines) are obtained as trajectories of the differential equation r0 = ξ2 (r). (7) Shrinklines and
stretchlines � coincide with the null-geodesics of the Lorentzian metric h(u, v) = u, Dtt0 (r)v . For this reason, we refer to the computation of hyperbolic LCSs as strongest normally-repelling or normally-attracting orbits of (5) as geodesic detection of hyperbolic LCSs. To compute the normal repulsion of shrinklines, we note that an infinitesimal normal perturbation to a shrinkline γ at its point r grows under the flow map Ftt0 by a factor of λ2 (r) in the direction normal to Ftt0 (γ). Similarly, small normal perturbations to a stretchline decay by a factor λ1 (r) in the direction normal to the evolving stretchline.
4
1. Define a Cartesian grid for initial conditions of trajectories. Define an auxiliary grid for differentiating with respect to initial conditions. 2. Solve (1) starting from each grid point and auxiliary grid point over the time interval [t0 , t]. This gives a discrete approximation to the flow map Ftt0 (x0 ). 3. Use finite differencing over the auxiliary grid to compute numerically the derivative of the flow map DFtt0 (x0 ). the Cauchy-Green strain tensor field Ctt0 (x0 ) = � T t t DFt0 (x0 ) DFt0 (x0 ), its eigenvalue field λ1,2 (x0 ), and eigenvector fields ξ1,2 (x0 ) over the initial condition grid.
4. Compute
Table 1: Algorithm to calculate the invariants of the Cauchy-Green strain tensor field.
3
Numerical methods
Here we describe a step-by-step numerical implementation of the geodesic detection of elliptic and hyperbolic LCSs through the differential equations (5), (6), and (7).
3.1
Computing the invariants of the Cauchy-Green strain tensor
The common first step in calculating elliptic and hyperbolic LCSs is the computation of the Cauchy-Green strain tensor field Ctt0 (x0 ), as defined in (2). The function performing this calculation in LCS Tool is eig cgStrain. The main steps executed by this function are enumerated in Table 1, while Table 3.1 summarizes the syntax of eig cgStrain. The Cartesian grid of initial conditions mentioned in Table 1 is rectangular, with user-defined vertical and horizontal ranges and resolutions. The optimal resolution may be determined by a successive doubling of the initial resolution until convergence of the extracted LCSs is observed visually. If the domain of interest comprises only a few expected LCSs, e.g., one vortex, then a resolution of about 500 grid point along the longest axis usually gives good results. Otherwise, a higher resolution must be chosen. The auxiliary grid (cf. Table 1) comprises four points placed symmetrically around each point of the Cartesian grid (Figure 1). These points are used to achieve increased accuracy in the finite-difference approximation ! x (t;t ,x +δx )−x (t;t ,x −δx ) x (t;t ,x +δx )−x (t;t ,x −δx ) 1
∇Ftt0 (x0 ) ≈
0
0
1
1
0
0
1
2|δx1 | x2 (t;t0 ,x0 +δx1 )−x2 (t;t0 ,x0 −δx1 ) 2|δx1 |
5
1
0
0
2
1
0
0
2
2|δx2 | x2 (t;t0 ,x0 +δx2 )−x2 (t;t0 ,x0 −δx2 ) 2|δx2 |
[cgEigenvector,cgEigenvalue] = eig cgStrain(derivative,domain,timespan,resolution) derivative function handle for flow velocity equations domain 2 × 2 array to define flow domain timespan 1 × 2 array to define flow timespan resolution 1 × 2 array to define Cauchy-Green strain main grid auxGridRelDelta eigenvalueFromMainGrid
incompressible odeSolverOptions
resolution optional scalar between 0 and 0.5 to specify auxiliary grid spacing. Default is 10−2 . optional logical to control whether eigenvalues of Cauchy-Green strain are calculated from main or auxiliary grid. Default is true. optional logical to specify if incompressibility is imposed. Default is false. optional odeset structure to specify flow map integration parameters
Table 2: Syntax of the function eigcgStrain. of ∇Ftt0 at a point x0 of the Cartesian grid. Here δxi is a vector of length |δxi | > 0 that points from the Cartesian grid-point x0 in the ith coordinate direction (Figure 1). Computational improvements arising from the use of the auxiliary grid over simply using the nearest points of the main grid were reported in Ref. [11]. Experience suggests an auxiliary grid spacing of 1-10% of the main grid spacing. The function eig cgStrain of LCS Tool provides the option to calculate Cauchy– Green eigenvectors from the auxiliary grid using eigenvalues calculated from the main grid. We have found that for flows defined analytically, the eigenvalues can reliably be calculated from the main grid. For the flows defined by datasets, using the auxiliary grid for eigenvalue calculations gives better results. As mentioned above, a typical main grid for the Cauchy-Green strain tensor comprises 500×500. This means that after the addition of 4 auxiliary grid point around each main grid points, eq. (1) must be integrated over 1.25 million initial conditions. To avoid excessive computational times in MATLAB, we vectorize (1), i.e., combine its right-hand-side evaluated over each initial points into a single system of equations. The resulting system is composed of independent blocks of two-dimensional first-order ODEs. We then use MATLAB’s ode45 to perform trajectory integration from all grid points simultaneously. This process typically takes five to ten minutes with default error tolerances. A potential drawback of vector form integration is that memory requirements may become excessive at high resolutions. Furthermore, writing the velocity function in vector form is more error-prone than the simpler two-dimensional form. The Cauchy-Green strain tensor generically admits points singularities, i.e., points where Ctt0 (x0 ) has repeated eigenvalues. At these points the eigenvectors ξ1 (x0 ) and ξ2 (x0 ) are no longer well-defined. This generically arises at a finite 6
Figure 1: Illustration of the main grid (filled circles) and the auxiliary grid (empty circles) used in the computation of the derivative of the flow map in the definition (2) of the Cauchy–Green stain tensor. The variable auxGridRelDelta specifies the grid spacing of the auxiliary grid relative to the main grid spacing. set of isolated points within the computational domain [9], and hence lie off the computational grid with probability one. 3.1.1
Special case: incompressible velocity fields
Incompressible flows (i.e. those satisfying ∇ · v = 0) admit the relationship λ1 (x0 )λ2 (x0 ) = 1 at all points of the computational domain [2]. Incompressibility can be computationally imposed by first calculating λ2 (x0 ), then setting λ1 (x0 ) = 1/λ2 (x0 ) and calculating the strain eigenvectors ξ2 from λ2 , then ξ1 from the relationship in (3). Experience shows that computing λi in this order gives higher accuracy than in the reverse order [11]. At some grid points, λ2 < 1 may occur due to numerical integration errors. By setting the integration tolerances to smaller values, the number of such grid points is reduced. Enforcing λ2 ≥ 1 everywhere, however, can incur excessive computational cost. To this end, the function eig cgStrain records the number of points with λ2 < 1, providing a measure for setting feasible integration tolerances. 3.1.2
Special case: data-defined velocity fields
Velocity fields defined by datasets require pre-processing before they are used in the numerical integration of (1). This requires spatial and temporal interpolation that enables the evaluation of the velocity function at arbitrary points 7
1. Position Poincare sections in flow domain to specify initial positions of lambda-lines λ 2. Integrate λ-lines tangent to η± (see (5).)
3. Calculate Poincare map 4. Find closed orbits for fixed points of the Poincare map 5. Identify outermost closed orbit on each Poincare section Table 3: Algorithm to calculate elliptic LCSs and coherent Lagrangian vortex boundaries. in U and at arbitrary times between t− and t+ . In section 4.3, we present an ocean dataset example with details of possible interpolation functions.
3.2
Computing elliptic LCSs
As discussed in section (2.1), positions of elliptic LCSs at time t0 are found λ as closed orbits of the η± vector fields defined in (4). We find such orbits by integrating (5) from points of an appropriately chosen section (Poincare section), and evaluating the first return map (Poincar´e map) onto this section. A λ-line returning to its starting point is then an elliptic LCS. The outermost member of a family of closed λ-lines (obtained by varying λ) is a coherent Lagrangian vortex boundary [19]. The main steps in calculating elliptic LCSs are enumerated in Table 3 and described in further detail below. The syntax of elliptic LCS functions in LCS Tool is shown in Table 4. The first step is to define the position of Poincare sections in regions where closed λ-lines are expected based on a visual analysis of the orbit structure of λ vector field. The Poincare section is to be oriented such that the first the η± endpoint is close to the center of the expected Lagrangian vortex, and the second endpoint is outside this vortex. There is no automated procedure implemented yet in LCS Tool for the positioning of Poincare sections (see, however, [22] for a recently developed algorithm). Additionally, the number of lambda-lines launched from the Poincar´e section, poincareSection.numPoints, must be defined. A reasonable default value is 100. The second step is to integrate the λ-lines starting from the Poincare section to obtain the corresponding Poincare map. Integration of λ-lines is performed λ using the η± vector fields defined in (4) over the main grid. The underlying eigenvector fields ξi (x0 ) have generic but removable orientation discontinuities, which require monitoring and reorientation, as needed. This process is sketched in Table 5 and illustrated in Figure 2. Linear interpolation is used in the interpoλ lation of η± within a grid element, since using higher-order interpolation would necessitate verifying that there are no orientation discontinuities beyond the 8
[shearline.etaPos,shearline.etaNeg] = lambda line(cgEigenvector,cgEigenvalue, lambda) cgEigenvector array of Cauchy-Green strain eigenvectors cgEigenvalue array of Cauchy-Green strain eigenvalues lambda scalar lambda value in Equation (4) [closedOrbits,orbits] = poincare closed orbit multi(domain,resolution,shearline, PSList) domain array to define flow domain resolution 1 × 2 array to define main grid resolution for Cauchyshearline PSList
nBisection dThresh odeSolverOptions periodicBc
Green strain tensor λ λ structure of arrays of η+ and η− values on main grid user-defined structure for Poincare section end-points, number of λ-lines launched from Poincare section, and maximum closedλ-line length optional number of bisection steps to refine zero crossings of Poincare map. Default values: 5. optional threshold to discard discontinuous zero crossings of Poincare map. Default value: 10−2 . optional odeset structure to specify λ-line integration parameters optional 1 × 2 logical array to specify periodic boundary conditions. Default is [false,false].
Table 4: Syntax of LCS Tool’s elliptic LCS functions.
9
1. Linearly interpolate vector field orientation at initial position 2. At next position, check whether vector field has rotated by over 90°, if yes, flip the vector field orientation by 180°. 3. Stop integration when λ-line returns to Poincare section, λ-line reaches the domain boundary, or maximum integration length has been reached. Table 5: Algorithm used for variable time step integration of λ-lines.
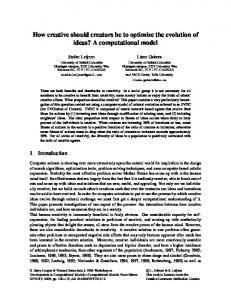
#1 #2 Initial Figure 2: Schematic illustration of the variable-time-step λ-line integration. At the initial point, there is an orientation discontinuity at the lower-right grid point that must be corrected prior to linear interpolation. At point #1, no λ orientation discontinuities are present. At point #2 all interpolated η± vectors must be rotated by 180° to match the orientation of the trajectory. four nearest grid points. We identify orientation discontinuities by checking the λ vectors at adjacent grid points. Rotations exceeding 90° inner product of the η± between two such neighboring vectors are classified as orientation discontinuities and are corrected before linear interpolation. When setting the Cauchy-Green strain tensor main grid resolution, one may find it helpful to calculate a histogram of eigenvector-field rotations to ensure that all rotations are well below 90°. λ An example of a Poincare map produced from integration of the η± field is shown in Figure 3. Most orbits will return to the Poincare section and their integration will then be stopped using the ODE event detection function of MATLAB. Some orbits may, however, deviate far from the Poincare section and do not return for any reasonable integration time. To control this behavior, we specify a maximum orbit length, poincareSection.orbitMaxLength . In practice, viewing the Poincare section as the radius of a circle and setting the maximum λ-line integration length to twice the circumference gives good results. In Figure 3, circle markers indicate fixed points of the Poincare map, i.e.,
10
0.04 0.03
p(s) − s
0.02 0.01 0 −0.01 −0.02 0
0.05
0.1
0.15
s
Figure 3: Example of a Poincare map obtained for an elliptic LCS region. Circle markers indicate closed orbit positions. The filled circle indicates the outermost fixed point of the Poincare map, marking the intersection of a coherent Lagrangian cortex boundary with the Poincare section. points where the distance between the final and the initial point of the orbit P (s) − s, is zero. The function poincare closed orbit multi performs the computations. As seen in Figure 3, LCS Tool uses a filtering parameter dThresh to discard sign changes of P (s) − s that are likely due to numerical sensitivity or a jump discontinuity of the Poincare map. Specifically, the location of each detected zero crossing is first refined by the bisection method. If after a predetermined number of iterations, nBisection (default value 5) the two points around the zero crossing still have absolute values above dThresh, the zero crossing is discarded. Once all valid closed λ-lines have been located, the outermost closed λ-orbit associated with every Poincare section is identified as a coherent Lagrangian vortex boundary.
3.3
Computing hyperbolic LCSs
As discussed in section (2.2), positions of hyperbolic LCSs at time t0 are found as the strongest repelling orbits of the vector field (6) (repelling LCSs), and strongest attracting orbits of the vector field (7) (attracting LCSs). By repulsion and attraction we mean a property of the LCS (as an evolving material line) under the flow map Ftt0 . We identify the strongest repelling shrinklines as those crossing a local maximum of the λ2 (x0 ) field. Similarly, we identify the strongest attracting stretchlines as those crossing a local minimum of the λ1 (x0 ) field.
11
1. Define a local maximization distance. 2. Find all points of the main grid that are local maxima of λ2 within a circle whose radius is the local maximization distance. 3. Define a maximum shrinkline length 4. Integrate a shrinkline forward and backward according to Equation (6) and using the largest λ2 local maximum as the initial position. Integrate until the shrinkline has attained the maximum shrinkline length, or until it has reached the domain boundary. 5. Flag any remaining local maxima of λ2 within the maximization distance of the shrinkline as ineligible initial positions for subsequent shrinklines 6. Continue integrating shrinklines using local maxima of λ2 as initial positions until no eligible local maxima of λ2 remain. 7. Remove all shrinkline segments falling within elliptic LCSs. Table 6: Algorithm to calculate initial positions of repelling LCSs at time t0 . The algorithm for attracting LCSs is similar. These local maxima and minima of the appropriate λi (x0 ) eigenvalue field can be thought of as the extensions of the concept of a saddle points to the present finite-time, temporally aperiodic flow setting. The main steps of our hyperbolic LCS detection algorithm are enumerated in Table 6. The basic function to compute hyperbolic LCSs in LCS Tool is seed curves from lambda max, with its syntax is given in Table 7. In classical, infinite-time dynamical systems, elliptic and hyperbolic invariant manifolds cannot intersect, as the trajectories in their intersection would then have to follow two different asymptotic behaviors simultaneously. In finitetime dynamical systems, hyperbolic LCSs may well intersect elliptic LCSs, with hyperbolic LCSs continuing to act as cores of mixing patterns observed in the interior of elliptic LCSs. Motivated by convention and for clarity in visualization, however, the default setting of LCS Tool removes hyperbolic LCS segments from the interior of elliptic LCSs. These removed segments can be turned back on demand, as shown in Figure 4.
12
[curvePosition,curveInitialPosition] = seed seed curves curves from from lambda lambda max(distance, max(distance, [curvePosition,curveInitialPosition] = cgEigenvalue,cgEigenvector,flowDomain,flowResolution) cgEigenvalue,cgEigenvector,flowDomain,flowResolution) distance threshold distance distance for for placement placement of of λλ2(x (x0 ) maxima distance threshold 2 0 ) maxima cgEigenvalue array of Cauchy-Green strain eigenvalues cgEigenvalue array of Cauchy-Green strain eigenvalues cgEigenvector array of of Cauchy-Green Cauchy-Green strain strain eigenvectors eigenvectors cgEigenvector array flowDomain 2 × 2 array to define flow domain flowDomain 2 × 2 array to define flow domain flowResolution × 22 array array to to define define Cauchy-Green Cauchy-Green strain strain main main grid grid flowResolution 11 × periodicBc periodicBc nMaxCurves nMaxCurves odeSolverOptions odeSolverOptions
resolution resolution optional 11 × × 22 logical logical array array to to specify specify periodic periodicboundary boundary optional conditions. Default Default is is [false,false] [false,false].. conditions. optional maximum maximum number number of of curves curves (i.e. (i.e. shrinklines shrinklinesofof optional stretchlines) to to generate. generate. Default Default isis numel(cgEigenvalue) numel(cgEigenvalue). . stretchlines) optional odeset odeset structure structure to to specify specify flow flowmap mapintegration integration optional parameters parameters
−31
−31
−31.5
−31.5
Lat it ude ( ◦ )
Lat it ude ( ◦ )
Table 7: Syntax of the function function seed seed curves curves from from lambda lambda max max
−32
−32.5
−33
−32
−32.5
−33
−33.5
−33.5
2
2.5
3
3.5
4
4.5
2
Longit ude ( ◦ )
2.5
3
3.5
4
4.5
Longit ude ( ◦ )
Figure 4: (Left) Elliptic LCS (green) (green) with with repelling repelling LCSs LCSs (red) (red) continuing continuinginto into its interior. (Right) Final positions positions x(t) x(t) = = (x (x11(t), (t),xx22(t)) (t)) = = FFttt0t0(x (x00)) ofof tracer tracer particles, with their x1 (t)-position encoded encoded in in red red and and xx22(t)-position (t)-positionencoded encodedinin LCSspatterns (black) green color. Note the continued continued impact impact of of the the repelling repellinghyperbolic LCSs on tracer on tracer inside the elliptic LCS (white). inside the patterns elliptic LCS.
13 13
4
Examples
In this section we present examples of the use of LCS Tool to obtain LCSs in three different examples: a double gyre, a jet, and an oceanic geostrophic flow. All three examples are available as demonstration files in the demo folder of LCS Tool. By executing these scripts, readers can follow LCS Tool computations step-by-step. Additionally, LCS Tool includes scripts to animate the three flows.
4.1
Double gyre
The double gyre is a model for a time-dependent two-gyre system observed in geophysical flows [30]. The model consists of two counter-rotating sinusoidal vortices with a harmonically oscillating line in-between. Lagrangian particle motions satisfy the non-autonomous dynamical system x˙ = −πA sin[πf (x, t)] cos(πy),
∂f (x, t) , ∂x f (x, t) = � sin(ωt)x2 + [1 − 2� sin(ωt)]x. y˙ = πA cos[πf (x, t)] sin(πy)
(8)
The MATLAB function describing this model velocity field is given in Listing 1, specifying the right-hand-side of the particle ODE in a way that supports vectorized integration. function derivative = derivative(t,x,epsilon,amplitude,omega) 2
4
6
8
10
12
idx1 = 1:2:numel(x)−1; idx2 = 2:2:numel(x); a = epsilon∗sin(omega∗t); b = 1 − 2∗epsilon∗sin(omega∗t); forcing = a∗x(idx1).ˆ2 + b∗x(idx1); derivative = nan(size(x)); derivative (idx1) = −pi∗amplitude∗sin(pi∗forcing).∗cos(pi∗x(idx2)); derivative (idx2) = pi∗amplitude∗cos(pi∗forcing).∗sin(pi∗x(idx2)).∗(2∗a∗x(idx1) + b);
Listing 1: Definition of double gyre flow. In what follows, the parameter values are: A = 0.1, � = 0.1, ω = π/5. The flow timespan is t ∈ [0, 10] and the domain is x ∈ [0, 2], y ∈ [0, 1]. By examining the FTLE field (which is optionally provided by LCS Tool), we position Poincare sections to capture elliptic LCSs. An LCS Tool demo script to perform this operation is given in Listing 2 where two Poincare sections are defined (ll. 1819). The free stretching parameter λ (Eq. 5) is varied over the range [0.93, 1.07] with increments of 0.01 (ll. 27-28). In a loop (ll. 35-39), closed orbits for all 14
predefined λ values are computed and the outermost closed orbit is kept as the Lagrangian vortex boundary. In this script, we have chosen small values for the error tolerances of the integration of the Cauchy-Green strain tensor (l. 14) and λ-lines (l. 26) to facilitate convergence. 1
3
5
7
9
11
13
%% Input parameters epsilon = .1; amplitude = .1; omega = pi/5; domain = [0,2;0,1]; resolution = [500,250]; timespan = [0,10]; %% Velocity definition lDerivative = @(t,x,˜)derivative(t,x,false,epsilon,amplitude,omega); incompressible = true; %% LCS parameters cgStrainOdeSolverOptions = odeset('relTol',1e−5);
15
17
19
21
23
25
27
% Lambda−lines poincareSection = struct('endPosition',{},'numPoints',{},'orbitMaxLength',{}); poincareSection(1).endPosition = [0.55,0.55;0.1,0.1]; poincareSection(2).endPosition = [1.53,.45;1.95,0.05]; [poincareSection.numPoints] = deal(100); nPoincareSection = numel(poincareSection); for i = 1:nPoincareSection rOrbit = hypot(diff(poincareSection(i).endPosition(:,1)),diff(poincareSection (i).endPosition(:,2))); poincareSection(i).orbitMaxLength = 2∗(2∗pi∗rOrbit); end lambdaLineOdeSolverOptions = odeset('relTol',1e−6); lambdaStep = 0.01; lambdaRange = 0.93:lambdaStep:1.07;
29
31
33
35
37
39
%% Cauchy−Green strain eigenvalues and eigenvectors [cgEigenvector,cgEigenvalue] = eig cgStrain(lDerivative,domain,resolution, timespan,'incompressible',incompressible,'odeSolverOptions', cgStrainOdeSolverOptions); %% Lambda−line LCSs for lambda = lambdaRange ... closedLambdaLineCandidate = poincare closed orbit multi(domain, resolution,shearline,poincareSection,'odeSolverOptions', lambdaLineOdeSolverOptions,'showGraph',showGraph); ... end
15
Listing 2: Double gyre script for elliptic λ-line LCSs In Figure 5, the resolution of the Cauchy-Green strain tensor is varied from [500 × 250] to [1000 × 500]. The location of the outermost closed λ-line changes insignificantly, demonstrating convergence. For all tested resolutions the λ values of the outermost closed orbits are constant. This is also suggests that the lowest tested resolution of [500 × 250] is sufficient to identify the elliptic LCS in this example. Figure 6 shows the complete picture of elliptic and hyperbolic LCSs of the double gyre at this resolution. Listing 3 lists the corresponding LCS Tool commands. The maximal length of shrinklines and stretchlines, strainlineMaxLength and stretchlineMaxLength, is set to 20, a multiple of the domain size, since the hyperbolic LCSs may wind around vortices several times. As usual, the local maximization distance is set larger for stretchlines than for shrinklines (cf. l. 4 and l 9). The purpose of the maximization distance is to obtain spatially separated LCSs and to avoid a dense tangle of lines that basically indicates the same hyperbolic LCS (cf. Table 6, point 5). Setting the local maximization distance for stretchlines larger than for shrinklines allows obtaining a comparable number of stretchlines and shrinklines overall in the flow domain (recall that hyperbolic LCS seed points are discarded if they are within the local maximization distance of an existing hyperbolic LCS.) Shrinklines are locally tangent to ridges of λ2 maxima, whereas stretchlines are locally normal to these ridges. Setting the local maximization distance of stretchlines and shrinklines equal would therefore produce a greater number of stretchlines than shrinklines overall.
2
4
% Shrinklines shrinklineMaxLength = 20; gridSpace = diff(domain(1,:))/(double(resolution(1))−1); shrinklineLocalMaxDistance = 2∗gridSpace; strainlineOdeSolverOptions = odeset('relTol',1e−6);
6
8
10
12
14
16
% Stretchlines stretchlineMaxLength = 20; stretchlineLocalMaxDistance = 10∗gridSpace; stretchlineOdeSolverOptions = odeset('relTol',1e−6); %% Hyperbolic shrinkline LCSs [shrinklineLcs,shrinklineLcsInitialPosition] = seed curves from lambda max( shrinklineLocalMaxDistance,shrinklineMaxLength,cgEigenvalue(:,2), cgEigenvector(:,1:2),domain,resolution,'odeSolverOptions', shrinklineOdeSolverOptions); ... %% Hyperbolic stretchline LCSs [stretchlineLcs,stretchlineLcsInitialPosition] = seed curves from lambda max( stretchlineLocalMaxDistance,stretchlineMaxLength,−cgEigenvalue(:,1),
16
cgEigenvector(:,3:4),domain,resolution,'odeSolverOptions', stretchlineOdeSolverOptions); ...
Listing 3: Excerpt from demo script to compute hyperbolic LCS for the double gyre flow.
17
500 x 250 1 0.5 0.8 0.4 0.6 y
0.3 0.4
0.2
0.2 0 0
0.1 0.5
1 x
1.5
2 FTLE
750 x 375 1
0.6
0.8
0.5 0.4
y
0.6
0.3 0.4 0.2 0.2 0 0
0.1 0.5
1 x
1.5
2 FTLE
1000 x 500 1 0.6 0.5
0.6
0.4
y
0.8
0.3 0.4 0.2 0.2 0 0
0.1 0.5
1 x
1.5
2 FTLE
Figure 5: 5: Convergence Convergence of of closed λ-lines for increasing main-grid resoluFigure tion in in the the double-gyre double-gyre model. model. The outermost closed λ-line (bold green tion line) is is the the vortex vortex boundary. boundary. line) (Top) [500x250], λ-values of closed orbits from from interior interior to to exterior, exterior, left gyre: bits λ = (0.97, 0.98, 0.99, 1.00, 1.01), 18 right gyre: gyre: λλ = = (1.00, (1.00, 1.01, 1.01, 1.02, 1.03, 1.04); (Middle) [750x375], left: right = (0.97, (0.97, 0.98, 0.98, 0.99, 0.99, 1.00, 1.00, 1.01), 1.01), right: λ = (1.00, 1.01, 1.02, 1.03, 1.04, 1.05); λλ = (Bottom) [1000x500], [1000x500], left: left: λ = (0.97, 0.98, 0.99, 1.00, 1.01), right: λ = (Bottom) (1.00, 1.01, 1.01, 1.02, 1.02, 1.03, 1.03, 1.04, 1.04, 1.05). 1.05). (1.00,
1 0.5 0.8 0.4 0.6 y
0.3 0.4
0.2
0.2 0 0
0.1 0.5
1 x
1.5
2 FTLE
1 0.5 0.8 0.4 0.6 y
0.3 0.4
0.2
0.2 0 0
0.1 0.5
1 x
1.5
2 FTLE
Figure 6: LCSs in the double gyre flow. Resolution [500 × 250]. λ = 1.00 and 1.04 for the left and the right gyre. λ ∈ [0.93, 1.07], ∆λ = 0.01. (Top) Elliptic (green) and repelling (red) LCSs with the FTLE shown in the background. (Bottom) Elliptic and attracting (blue) LCSs.
19
4.2
Bickley jet
The Bickley jet models a meandering zonal jet flanked above and below by counter-rotating vortices. This is an idealized model of geophysical flows such as the Gulf Stream or the polar night jet perturbed by a Rossby wave [8, 3]. The velocity is given by v(x, y, t) = (−∂y ψ, ∂x ψ) where ψ(x, y, t) = ψ0 (x, y) + ψ1 (x, y, t), y y ψ0 (x, y) = c3 y − U Ly tanh + �3 U Ly sech2 cos k3 x, Ly Ly " 2 # X 2 y ikn x ψ1 (x, y, t) = U Ly sech Re �n fn (t)e . Ly n=1 As a forcing function, we choose a solution running on the chaotic attractor of the damped-forced Duffing oscillator. Specifically, we let dφ1 = φ2 , dt dφ1 = −0.1φ2 − φ31 + 11 cos(t), dt f1,2 (t) = 2.625 × 10⁻² φ1 (t/6.238 × 105 ). The parameter values we use are: U = 62.66, c2 = 0.205U , c3 = 0.461U , Ly = 1.77 × 10⁶ , �1 = 0.0075, �2 = 0.04, �3 = 0.3, Lx = 6.371 × 10⁶ π, kn = 2nπ/Lx , σ1 = 0.5k2 (c2 − c3 ), σ2 = 2σ1 . The integration time is T = 4Lx /U , a multiple of a the eddy turnover time in the flow (see also LCS Tool file flow animation.m). Listing 4 shows the code of LCS Tool in which the chaotically perturbed velocity field is defined (ll. 11-18), the boundaries are set to periodic in the x-direction (l. 20), and five Poincare sections are defined where we expect coherent vortices (ll. 46-50). λ-values for the closed orbit detection are varied over the range [0.80, 1.20] with a step of 0.01. Figure 7 shows elliptic and hyperbolic LCSs of the Bickley jet with the FTLE field in the background.
2
4
6
8
10
12
%% Input parameters u = 62.66; lengthX = pi∗earthRadius; lengthY = 1.77e6; epsilon = [.075,.4,.3]; domain = [0,lengthX;[−1,1]∗2.25∗lengthY]; resolutionX = 500; timespan = [0,4∗lengthX/u]; %% Velocity definition perturbationCase = 3; phiTimespan = [0,25];
20
14
16
18
20
22
phiInitial = [0,0]; phiSol = ode45(@d phi,phiTimespan,phiInitial); timeResolution = 1e5; phi1 = deval(phiSol,linspace(phiTimespan(1),phiTimespan(2),timeResolution),1) ; phi1Max = max(phi1); lDerivative = @(t,x,˜)derivative(t,x,false,u,lengthX,lengthY,epsilon, perturbationCase,phiSol,phi1Max); incompressible = true; periodicBc = [true,false]; %% Cauchy−Green strain eigenvalues and eigenvectors [cgEigenvector,cgEigenvalue] = eig cgStrain(lDerivative,domain,resolution, timespan,'incompressible',incompressible);
24
26
28
%% LCS parameters % Lambda−lines lambdaStep = 0.01; lambdaRange = 0.80:lambdaStep:1.10; lambdaLineOdeSolverOptions = odeset('relTol',1e−6);
30
32
34
36
38
% Shrinklines shrinklineMaxLength = 1e8; shrinklineLocalMaxDistance = 8∗gridSpace; shrinklineOdeSolverOptions = odeset('relTol',1e−4); % Stretchlines stretchlineMaxLength = 1e8; stretchlineLocalMaxDistance = 4∗gridSpace; stretchlineOdeSolverOptions = odeset('relTol',1e−4);
40
42
44
46
48
50
52
%% Lambda−line LCSs % Define Poincare sections; first point in center of elliptic region and % second point outside elliptic region poincareSection = struct('endPosition',{},'numPoints',{},'orbitMaxLength',{}); poincareSection(1).endPosition poincareSection(2).endPosition poincareSection(3).endPosition poincareSection(4).endPosition poincareSection(5).endPosition
= = = = =
[3.25e6, 1.5e6; 1.4e6, 2.6e6]; [6.50e6,−1.4e6; 5.0e6, −3.0e6]; [1.0e7, 1.5e6; 8.0e6, 2.6e6]; [1.35e7,−1.4e6; 1.5e7, −0.5e6]; [1.65e7, 1.5e6; 1.5e7, 2.6e6];
% Number of orbit seed points along each Poincare section [poincareSection.numPoints] = deal(80);
54
56
58
% Set maximum orbit length to twice the expected circumference nPoincareSection = numel(poincareSection); for i = 1:nPoincareSection rOrbit = hypot(diff(poincareSection(i).endPosition(:,1)),diff(poincareSection (i).endPosition(:,2)));
21
poincareSection(i).orbitMaxLength = 2∗(2∗pi∗rOrbit); 60
62
64
66
68
70
end ... for lambda = lambdaRange ... [shearline.etaPos,shearline.etaNeg] = lambda line(cgEigenvector, cgEigenvalue,lambda); closedLambdaLineCandidate = poincare closed orbit multi(domain, resolution,shearline,poincareSection,'odeSolverOptions', lambdaLineOdeSolverOptions); ... end ... %% Hyperbolic shrinkline LCSs [shrinklineLcs,shrinklineLcsInitialPosition] = seed curves from lambda max( shrinklineLocalMaxDistance,shrinklineMaxLength,cgEigenvalue(:,2), cgEigenvector(:,1:2),domain,resolution,'periodicBc',periodicBc,' odeSolverOptions',shrinklineOdeSolverOptions);
72
74
%% Hyperbolic stretchline LCSs [stretchlineLcs,stretchlineLcsInitialPosition] = seed curves from lambda max( stretchlineLocalMaxDistance,stretchlineMaxLength,−cgEigenvalue(:,1), cgEigenvector(:,3:4),domain,resolution,'periodicBc',periodicBc,' odeSolverOptions',stretchlineOdeSolverOptions);
Listing 4: Bickley jet script for hyperbolic and elliptic LCSs.
22
6
−6
y
x 10
x 10 5
3 2 1 0 −1 −2 −3
4 3 2 1
0
0.5
1 x
2 FTLE
1.5
7
x 10
6
−6
y
x 10
x 10 5
3 2 1 0 −1 −2 −3 0
4 3 2 1 0.5
1 x
2 FTLE
1.5
7
x 10
Figure Figure 7: 7: Elliptic Elliptic and and hyperbolic hyperbolic (top: (top: red red -- repelling, repelling, bottom: bottom: blue blue -- attracting) attracting) LCSs in the Bickley jet. λ-valuestrains of coherent eddies from LCSs in the Bickley jet. λ-valuestrains of coherent eddies from left left to to right right [0.95, 0.80, 0.94, 0.80, 0.94], λ ∈ [0.80, 1.20], ∆λ = 0.01. [0.95, 0.80, 0.94, 0.80, 0.94], λ ∈ [0.80, 1.20], ∆λ = 0.01.
23 23
4.3
Ocean velocity data from satellite altimetry
This last example demonstrates the use of LCS Tool on velocity data derived from satellite-observed sea-surface heights under the geostrophic approximation. In contrast to the previous two analytic examples, the velocity field is available only with discrete temporal and spatial resolution. Our region of interest is a small domain in the South Atlantic Ocean, where exceptionally coherent eddies (Agulhas rings) were recently found by [19] using the theory we surveyed in Section 2.1. In the geostrophic approximation, the sea-surface height η serves as a streamfunction for surface velocities. In a longitude-latitude (ϕ, θ) coordinate system, the evolution of a fluid particle is given by g ∂θ η(ϕ, θ, t) R2 f (θ) cos θ g ˙ ∂ϕ η(ϕ, θ, t) θ(ϕ, θ, t) = + 2 R f (θ) cos θ
ϕ(ϕ, ˙ θ, t) = −
(9) (10)
where g is the constant of gravity, R is the mean radius of the Earth, and f (θ) ≡ 2Ω sin θ is the Coriolis parameter, with Ω denoting the Earth’s mean angular velocity. The data is given at a spatial resolution of 1/4° and a temporal resolution of 7 days. Due to the discrete data, defining the right-hand side of Equation (9) and (10) involves spline interpolation in space and time. An interpolant is generated first, then the function flowdata derivative evaluates the interpolants for the zonal and meridional velocity at the needed coordinates. Listing 5 shows the relevant part of the code in LCS Tool’s ocean demo file hyperbolic shear lcs .m. In lines 8-11, the commands for the interpolation of the velocity data set are given.
2
4
6
8
10
12
% Input parameters domain = [0,6;−34,−28]; resolution = [400,400]; timespan = [100,130]; % Velocity definition load('ocean geostrophic velocity.mat'); ... interpMethod = 'spline'; vlon interpolant = griddedInterpolant({time,lat,lon},vlon,interpMethod); vlat interpolant = griddedInterpolant({time,lat,lon},vlat,interpMethod); lDerivative = @(t,x,˜)flowdata derivative(t,x,vlon interpolant,vlat interpolant); incompressible = true;
14
16
18
% LCS parameters % Cauchy−Green strain cgEigenvalueFromMainGrid = false; cgAuxGridRelDelta = 0.01;
24
20
22
24
26
28
30
32
34
36
38
40
42
% Lambda−lines lambdaStep = 0.02; lambdaRange = 0.90:lambdaStep:1.10; lambdaLineOdeSolverOptions = odeset('relTol',1e−6); % Shrinklines shrinklineMaxLength = 20; gridSpace = diff(domain(1,:))/(double(resolution(1))−1); shrinklineLocalMaxDistance = 2∗gridSpace; shrinklineOdeSolverOptions = odeset('relTol',1e−4); % Stretchlines stretchlineMaxLength = 20; stretchlineLocalMaxDistance = 4∗gridSpace; stretchlineOdeSolverOptions = odeset('relTol',1e−4); ... % Cauchy−Green strain eigenvalues and eigenvectors [cgEigenvector,cgEigenvalue] = eig cgStrain(lDerivative,domain,resolution, timespan,'incompressible',incompressible,'eigenvalueFromMainGrid', cgEigenvalueFromMainGrid,'auxGridRelDelta',cgAuxGridRelDelta); % Lambda−line LCSs % Define Poincare sections; ... poincareSection = struct('endPosition',{},'numPoints',{},'orbitMaxLength',{}); ... poincareSection(1).endPosition = [3.3,−32.1;3.7,−31.6]; poincareSection(2).endPosition = [1.3,−30.9;1.9,−31.1];
44
46
48
50
52
% Number of orbit seed points along each Poincare section [poincareSection.numPoints] = deal(100); % Set maximum orbit length to twice the expected circumference nPoincareSection = numel(poincareSection); for i = 1:nPoincareSection rOrbit = hypot(diff(poincareSection(i).endPosition(:,1)),diff(poincareSection (i).endPosition(:,2))); poincareSection(i).orbitMaxLength = 2∗(2∗pi∗rOrbit); end
54
56
58
60
62
for lambda = lambdaRange ... [shearline.etaPos,shearline.etaNeg] = lambda line(cgEigenvector, cgEigenvalue,lambda); closedLambdaLineCandidate = poincare closed orbit multi(domain, resolution,shearline,poincareSection,'odeSolverOptions', lambdaLineOdeSolverOptions,'showGraph',showGraph); ... end ... % Hyperbolic shrinkline LCSs
25
64
66
shrinklineLcs = seed curves from lambda max(shrinklineLocalMaxDistance, shrinklineMaxLength,cgEigenvalue(:,2),cgEigenvector(:,1:2),domain, resolution,'odeSolverOptions',shrinklineOdeSolverOptions); ... % Hyperbolic stretchline LCSs stretchlineLcs = seed curves from lambda max(stretchlineLocalMaxDistance, stretchlineMaxLength,−cgEigenvalue(:,1),cgEigenvector(:,3:4),domain, resolution,'odeSolverOptions',stretchlineOdeSolverOptions);
Listing 5: LCS Tool demo script to compute LCS from an ocean data set. We choose the integration time as T = 30 days (Listing 5, l. 4), which is larger than the eddy turnover time in this region. The resolution of the main computational grid for initial conditions is set to 400 × 400 (l. 3). This corresponds to a resolution of roughly 0.015° and gives good results. With this choice, the resolution of the tracer grid is 15 times higher than the resolution of the velocity field. The flow is integrated and the Cauchy-Green strain tensor is computed by the function eig cgStrain (l. 35). Incompressibility of the flow is enforced (l. 12), the auxiliary grid distance is set to 1% of the main grid distance (l. 17), and eigenvalues are computed from the auxiliary grid (l. 16). Elliptic LCSs are computed in line 54, after the Poincare sections have been set λ fields have been defined (l. 53). λ-values are varied over a (ll. 41-42) and the η± range of [0.90, 1.10] with a step of 0.02 (l. 20). Hyperbolic LCSs are computed in lines 57 and 59. Figure 8 shows the positions of elliptic and hyperbolic LCSs on 22 November 2006, which is the same time instant analyzed in [19, 4]. Here the integration time is chosen as T = 30 days, as opposed to 90 days in the cited references, to avoid the length tangling of hyperbolic LCSs. Our analysis via LCS Tool reveals five coherent eddy boundaries. The large coherent eddy at (3, −32) has a non-stretching boundary, i.e., λ = 1.00. It corresponds to eddy #2 in Figure 3 of [4]. Additionally, four further smaller coherent eddy cores are found. They do not stay coherent over a time of 90 days. All closed orbits are stable under increased spatial resolution for the Cauchy-Green strain tensor field. Repelling LCSs (red) and attracting LCSs (blue) are superimposed over the plot of FTLE values. The hyperbolic LCSs determine the deformation of the fluid in-between coherent eddy cores.
26
−28 0.3 −29
0.25
5 3 Latitude (°)
−30
−31
0.2
2
0.15
4 −32
0.1
1
−33
−34 0
0.05
1
2 3 4 Longitude (°)
5
6 FTLE
−28 0.3 −29
0.25
5 3 Latitude (°)
−30
−31
0.2
2
0.15
4 −32
0.1
1
−33
−34 0
0.05
1
2 3 4 Longitude (°)
5
6 FTLE
Figure 8: (Top) Elliptic LCSs (green, λ = 1.00, 1.08, 0.94, 0.90, 1.06) and and repelling LCSs (red) in the ocean data set. Background gray-scale is the finite finite time Lyapunov exponent. Dashed green lines are Poincare sections. White dots dots indicate λ 2 local maxima used as initial positions for shrinkline integration. integration. 27 (Bottom) Elliptic LCSs (green) and attracting LCSs (blue).
5
Conclusions
We have described a computational toolbox, LCS Tool, that implements recent variational results for Lagrangian Coherent Structures (LCSs) in twodimensional unsteady flows. We have also demonstrated the performance of LCS Tool on two analytic flow models and a geophysical velocity dataset. The publicly available software library producing these results enables the exploration of variational LCS methods without assuming a detailed knowledge of geodesic LCS theory. LCS Tool leverages the capabilities of MATLAB extensively. For FTLEbased extraction of LCSs, computational performance has received considerable attention [6, 25]. We hope to see similar computational advances for the publicly available LCS Tool platform. Optimizing computational performance will likely aid the application of variational LCS methods to large-scale real-time forecasting applications, such as the tracking of environmental contaminants [27]. We also hope that LCS Tool will serve as a foundation for the numerical implementation of recent theoretical advances. These include the geodesic theory of parabolic LCSs (jet cores) [12] and the variational theory of hyperbolic and elliptic LCSs for three-dimensional flows [5].
Acknowledgments The altimeter products used in this work are produced by SSALTO/DUACS and distributed by AVISO, with support from CNES http://www.aviso.oceanobs. com/duacs
References [1] S. Ali and M. Shah. A Lagrangian Particle Dynamics Approach for Crowd Flow Segmentation and Stability Analysis. IEEE International Conference on Computer Vision and Pattern Recognition (CVPR), 2007. [2] V.I. Arnold. Mathematical methods of classical mechanics. Springer-Verlag, 1978. [3] F.B. Beron-Vera, M.J. Olascoaga, M.G. Brown, H. Ko¸cak, and I.I. Rypina. Invariant-tori-like Lagrangian coherent structures in geophysical flows. Chaos, 20:017514, 2010. doi: 10.1063/1.3271342. [4] F.J. Beron-Vera, Y. Wang, M.J. Olascoaga, G. Goni, and G. Haller. Objective detection of oceanic eddies and the Agulhas leakage. J. Phys. Ocean., 2013. doi: 10.1175/JPO-D-12-0171.1. [5] D. Blazevski and G. Haller. Hyperbolic and elliptic transport barriers in three-dimensional unsteady flows. Physica D, 273–274:46–62, 2014.
28
[6] C. Conti, D. Rossinelli, and P. Koumoutsakos. GPU and APU computations of Finite Time Lyapunov Exponent fields. J. Comp. Phys., 231(5): 2229–2244, 2012. doi: 10.1016/j.jcp.2011.10.032. [7] J. O. Dabiri. LCS MATLAB Kit, 2009. URL http://dabiri.caltech. edu/software.html. [8] D. del Castillo-Negrete and P. J. Morrison. Chaotic transport by Rossby waves in shear flow. Phys. Fluids A, 5(4):948–965, 1993. [9] T. Delmarcelle and L. Hesselink. The topology of symmetric, secondorder tensor fields. In Visualization, 1994., Visualization ’94, Proceedings., IEEE Conference on, pages 140–147, 10 1994. doi: 10.1109/VISUAL.1994. 346326. [10] P.C. du Toit. Transport and separatrices in time-dependent flows. PhD thesis, California Institute of Technology, 2010. URL http://resolver. caltech.edu/CaltechTHESIS:10072009-165901284. [11] M. Farazmand and G. Haller. Computing Lagrangian coherent structures from their variational theory. Chaos, 22(1), 2012. doi: 10.1063/1.3690153. [12] M. Farazmand, D. Blazevski, and G. Haller. Shearless transport barriers in unsteady two-dimensional flows and maps. Physica D, 278-279:44–57, 2014. [13] E.S. Gawlik, J.E. Marsden, P.C. Du Toit, and S. Campagnola. Lagrangian coherent structures in the planar elliptic restricted three-body problem. Celest. Mech. Dyn. Astr., 103:227–249, 2009. [14] A. Hadjighasem, M. Farazmand, and G. Haller. Detecting invariant manifolds, attractors, and generalized KAM tori in aperiodically forced mechanical systems. Nonlinear Dynamics, 73(1-2):689–704, 2013. ISSN 0924-090X. doi: 10.1007/s11071-013-0823-x. [15] G. Haller. Distinguished material surfaces and coherent structures in threedimensional fluid flows. Physica D, 149:248–277, 2001. [16] G. Haller. A variational theory of hyperbolic Lagrangian Coherent Structures. Physica D, 240(7):574–598, 3 2011. doi: 10.1016/j.physd.2010.11.010. [17] G. Haller. Lagrangian coherent structures. Ann. Rev. Fluid Mech. (to appear), 2014. [18] G. Haller and F.J. Beron-Vera. Geodesic Theory of Transport Barriers in Two-Dimensional Flows. Physica D, 241(20):1680–1702, 10 2012. doi: 10.1016/j.physd.2012.06.012. [19] G. Haller and F.J. Beron-Vera. Coherent Lagrangian vortices: the black holes of turbulence. J. Fluid Mech., 731:R4, 2013. doi: 10.1017/jfm.2013. 391. 29
[20] G. Haller and G. Yuan. Lagrangian coherent structures and mixing in two-dimensional turbulence. Physica D, 147:352–370, 2000. [21] F. Huhn, A. von Kameke, V. P´erez-Mu˜ nuzuri, M.J. Olascoaga, and F.J. Beron-Vera. The impact of advective transport by the South Indian Ocean Countercurrent on the Madagascar plankton bloom. Geophys. Res. Lett., 39:L06602, 2012. [22] D. Karrasch, F. Huhn, and G. Haller. Automated detection of coherent Lagrangian vortices in two-dimensional unsteady flows. submitted, 2014. [23] T.-Y. Koh and B. Legras. Hyperbolic lines and the stratospheric polar vortex. Chaos, 12(2):382–394, 2002. [24] F. Lekien. Time-dependent dynamical systems and geophysical flows. PhD thesis, California Institute of Technology, 2003. URL http://resolver. caltech.edu/CaltechETD:etd-04082003-180353. [25] P. Miron, J. V´etel, A. Garon, M. Delfour, and M. El Hassan. Anisotropic mesh adaptation on Lagrangian Coherent Structures. J. Comp. Phys., 231 (19):6419–6437, 2012. doi: 10.1016/j.jcp.2012.06.015. [26] G. Norgard and P.-T. Bremer. Second derivative ridges are straight lines and the implications for computing Lagrangian Coherent Structures. Physica D, 241(18):1475–1476, 9 2012. ISSN 0167-2789. doi: 10.1016/j.physd.2012.05.006. [27] M. J. Olascoaga and G. Haller. Forecasting sudden changes in environmental pollution patterns. Proc. Nat. Acad. Sci., 109(13):4738–4743, 2012. [28] T. Peacock and G. Haller. Lagrangian coherent structures: The hidden skeleton of fluid flows. Physics Today, 66(2):41–47, 2013. doi: 10.1063/PT. 3.1886. [29] S.C. Shadden. FlowVC, 2010. URL http://shaddenlab.berkeley.edu/ software.html. [30] S.C. Shadden, F. Lekien, and J.E. Marsden. Definition and properties of Lagrangian coherent structures from finite-time Lyapunov exponents in two-dimensional aperiodic flows. Physica D, 212(3-4):271–304, 12 2005. doi: 10.1016/j.physd.2005.10.007. [31] P. Tallapragada, S.D. Ross, and D.G. Schmale III. Lagrangian coherent structures are associated with fluctuations in airborne microbial populations. Chaos, 21(3):033122, 2011. doi: 10.1063/1.3624930. [32] W. Tang, P.W. Chan, and G. Haller. Accurate extraction of Lagrangian coherent structures over finite domains with application to flight data analysis over Hong Kong International Airport. Chaos, 20(1):017502, 2010. doi: 10.1063/1.3276061. 30
[33] C. Truesdell and W. Noll. The Non-Linear Field Theories of Mechanics. Springer, 2004. [34] M.M. Wilson, J. Peng, J.O. Dabiri, and J.D. Eldredge. Lagrangian coherent structures in low Reynolds number swimming. J. Phys.: Condens. Mat., 21(20):204105, 2009. doi: 10.1088/0953-8984/21/20/204105.
31