www.nature.com/scientificreports
OPEN
received: 29 January 2015 accepted: 14 July 2015 Published: 19 August 2015
Less is more: Avoiding the LIBS dimensionality curse through judicious feature selection for explosive detection Ashwin Kumar Myakalwar1,*, Nicolas Spegazzini2,*, Chi Zhang3, Siva Kumar Anubham1, Ramachandra R. Dasari2, Ishan Barman3 & Manoj Kumar Gundawar1 Despite its intrinsic advantages, translation of laser induced breakdown spectroscopy for material identification has been often impeded by the lack of robustness of developed classification models, often due to the presence of spurious correlations. While a number of classifiers exhibiting high discriminatory power have been reported, efforts in establishing the subset of relevant spectral features that enable a fundamental interpretation of the segmentation capability and avoid the ‘curse of dimensionality’ have been lacking. Using LIBS data acquired from a set of secondary explosives, we investigate judicious feature selection approaches and architect two different chemometrics classifiers –based on feature selection through prerequisite knowledge of the sample composition and genetic algorithm, respectively. While the full spectral input results in classification rate of ca.92%, selection of only carbon to hydrogen spectral window results in near identical performance. Importantly, the genetic algorithm-derived classifier shows a statistically significant improvement to ca. 94% accuracy for prospective classification, even though the number of features used is an order of magnitude smaller. Our findings demonstrate the impact of rigorous feature selection in LIBS and also hint at the feasibility of using a discrete filter based detector thereby enabling a cheaper and compact system more amenable to field operations.
Spectroscopic data is widely employed to characterize sample composition and to relate function to the compositional information. In particular, optical spectroscopy methods, notably Raman spectroscopy1,2, laser induced fluorescence (LIF)3, infrared (IR) absorption4 and laser induced breakdown spectroscopy (LIBS)5, has received considerable attention for high-energy materials (HEM) (explosives) detection because of the lack of sample preparation requirements and ability to provide real-time assessment in stand-off mode. While the vibrational spectroscopic approaches provide a wealth of molecular information, LIBS furnishes complementary elemental information and offers higher signal sensitivity due to the intense emission lines. Researchers have exploited the single-shot and facile elemental analysis capability of LIBS in diverse fields ranging from planetary exploration6,7, archaeology8 to pharmaceutical formulation identification9, HEM screening10,11 as well as in other biomedical12–14 and polymer applications15. The incorporation of statistical models in the analysis of LIBS coupled with the seminal work by Miziolek and co-workers16 and stand-off operations at Los Alamos National Laboratory17 has further enhanced its attractiveness for evaluation of complex materials of stochastically varying compositions. 1
Advanced Centre of Research in High Energy Materials, Prof C R Rao Road, University of Hyderabad, Gachibowli, Hyderabad, Telangana, 500046, India. 2Laser Biomedical Research Center, G. R. Harrison Spectroscopy Laboratory, Massachusetts Institute of Technology, Cambridge, MA 02139, USA. 3Department of Mechanical Engineering, Johns Hopkins University, Baltimore MD 21218, USA. *These authors contributed equally to this work. Correspondence and requests for materials should be addressed to I.B. (email:
[email protected]) or M.K.G. (email: manoj@ uohyd.ac.in) Scientific Reports | 5:13169 | DOI: 10.1038/srep13169
1
www.nature.com/scientificreports/ Specific to HEM detection, there are two principal research goals: first, to identify a specimen as a HEM and second, to classify the specimen as a specific HEM. Yet, HEMs typically are nitro-rich molecules and exhibit grossly similar spectral profiles with prominent emission lines corresponding to nitrogen, carbon, hydrogen and oxygen. Furthermore, the spectral interference emanating from trace quantities of grease, oils18 and biomaterials19 as well as the presence of oxygen and nitrogen in the ambient air, and hydrogen and oxygen in the atmospheric moisture impedes the reliable detection of the materials in the field. Consequently, the basic spectroscopic approach of employing atomic (and in cases molecular) intensity ratios for these kinds of materials yield very limited results. Also, the substrate effects for HEM residue detection, which have been detailed by Gottfried et al.20, exacerbates the segmentation challenges due to the potential alterations to the light emission from the microplasma. Taken together, it is not surprising that non-analyte specific peaks appear in the spectral profile due to the entrainment of air and the (variable) substrate information21. Approaches that partially alleviate these issues include noble gas purging and double pulse method. However, purging is not a viable option for on-field application and while the double pulse method shows some improvement in the signal enhancement22, purely ambient air peaks (e.g. oxygen and nitrogen) cannot be avoided. In this milieu, the application of multivariate chemometrics methods to LIBS datasets has enabled the extraction of information both amenable to and hidden from human examination and the resultant combination has been successfully utilized for materials’ identification23,24. The underlying hypothesis is that while assessing the spectral signatures of several specimen shows significant complexity, comparing hundreds of such spectra reveal subtle, yet reproducible, patterns that are valuable for objective sample identification. Various multivariate segmentation methods including principal component analysis (PCA)16,25, soft independent modeling of class analogy (SIMCA)21, partial least squares-discriminant analysis (PLS-DA)16,21,23, artificial neural network (ANN)26 and support vector machine (SVM)27 have been exploited to analyze the rich LIBS datasets. Concomitant advances in instrumentation, especially the use of echelle spectrographs, have further enabled measurements of high resolution thereby providing larger number of spectral features for classifier development. However, the massive amount of data collected puts forth a different challenge as far as the development of a robust classifier is concerned. Given the high dimensionality of the LIBS dataset and the relative sample sparsity (stemming from the unavailability of large numbers of HEM samples), the quest for the ‘perfect’ classifier can often produce unwarranted conclusions and lead to apparently functional algorithms that cannot be used prospectively. Boosting the sample per feature ratio by appropriate selection of spectral regions can not only produce classifiers that are more insensitive to outliers and possess higher generalization power but also aid in interpretability by identification of the smallest possible subset of maximally discriminatory features. Recently, considerable effort has been directed towards developing and evaluating different procedures that objectively identify wavelength bands that contribute useful information and/or eliminate regions that contain mostly noise or spurious information1,21,28. In principle, judicious wavelength selection for spectroscopic datasets focusing on marker-specific features could even result in models having a greater predictive ability. Despite these advantages and the suitability of LIBS for feature selection due to its inherently narrow emission peaks, wavelength selection for building LIBS-based segmentation models has received scant attention in the literature. Here we present two distinct approaches for wavelength selection in LIBS spectra and investigate their relative merits in influencing the classification outcomes for a set of HEM samples. Specifically, we establish segmentation models based on: (A) spectral regions selected on the basis of a priori knowledge of the chemical composition of the samples; and (B) spectral regions determined through implementation of genetic algorithm (GA), a powerful search heuristic that mimics the process of natural selection. First, we examine four spectral regions as well as the full spectrum in constructing PLS-DA derived classification models. PLS-DA is used as a representative multivariate segmentation framework, with the understanding that classification techniques for LIBS and vibrational spectra often provide similar levels of accuracy in prediction due to the richness of the spectral data. The spectral regions were based on the presence of the prominent peak of the organics in the following manner: (a) R1 region that combines the carbon and hydrogen peaks, (b) R2 region that consists of the spectral window spanning from the carbon to the CN lines, (c) R3 region covering the prominent organic window from carbon to hydrogen, and (d) the R4 spectral region encompassing the atmospheric window of the oxygen and nitrogen peaks. Based on this categorization, we find that the correct classification rate using only the R3 region is nearly equal to that of the full spectrum, although it uses ~63% of the intensity values recorded at the detector. Evidently, this finding opens the door for using a detector with significantly smaller spectral coverage that also reduces the possibility of overfitting to variable, yet uninformative, regions of the spectra. Even more significantly, we observe that using the probabilistic, non-local GA search process, a spectral subset featuring an order of magnitude less wavelength information than the full spectrum is capable of surpassing the prediction performance of the latter. The approaches described herein are also sufficiently broad and general to address critical applications in disease diagnosis as well as pharmaceutical and forensic analysis. We also envision that rigorous validation of limited wavelength subsets may provide much-needed momentum to the development of discrete filter-based detector units that can fundamentally reduce the cost, complexity and spatial footprint of the echelle spectrograph – intensified CCD combination of present day LIBS platforms.
Scientific Reports | 5:13169 | DOI: 10.1038/srep13169
2
www.nature.com/scientificreports/
Materials and Methods
Experimental studies were undertaken to accomplish the following objectives: (1) discern the relevant discriminatory features (i.e. the differential spectral markers) for the HEM samples under consideration; and (2) use the selected features to establish decision algorithms for HEM sample recognition and determine their sensitivity. For the sensitivity analysis, the rate of correct classification (and corresponding misclassification and unclassification) was computed when all classes of the HEM samples were split into training and testsets.
Experimental section. A detailed description of our LIBS experimental setup was provided in our previous article29. Briefly, a frequency-doubled Nd:YAG laser of 7 ns pulse duration was used as the excitation source. The laser beam was focused by a 10 cm plano-convex lens onto the sample to create the plasma. The plasma emission was collected with a collimating lens assembly CC 52 (Ocean optics Inc.) that was then guided through an optical fiber (core diameter: 400 μ m) to the spectrograph (ANDOR Mechelle 5000) coupled to an iSTAR DH734 ICCD detector. The samples were subjected to ca. 22 mJ of laser energy with the pulse energy output measured using a pyro-electric joule meter (Molectron, EPM 2000, Coherent Inc). The experiments were carried out in ambient air at atmospheric pressure. A gate delay of 1 μ s and gate width 2 μ s was used for signal acquisition. A set of HEM samples namelyoctahydro-1,3,5,7-tetranitro-1,3,5,7-tetrazocine (also known as high-molecular-weight RDX (HMX)), nitrotriazalone (NTO), pentaerythritoltetranitrate (PETN), 1,3,5-trinitro-1,3,5-triazacyclohexane (RDX), 2,4,6-trinitrotoluene (TNT) were acquired from the High Energy Materials Research Laboratory (HEMRL), Pune, India. The fine powder material was pressed into 1 cm diameter pellets by a die-hydraulic pressing machine by applying 3–4 tons of pressure. The pelletization operation improves signal reproducibility, as the position of the focal spot is almost unchanged for all the laser pulses arriving at the pellet surface in sharp contrast to a powder specimen. The pellets were pressed to within 91–94% of the theoretical maximum density for each explosive. The samples were placed on a manual X-Y-Z translation stage such that spectra could be collected from different spatial locations in the pellet to estimate measurement variability. For our present investigations, 472 spectra were acquired from the HEM samples. Specifically, 133 spectra for HMX, 75 for NTO, 60 for PETN, 61 for RDX, and 143 for TNT were included for the ensuing classification analysis. Each spectral profile represents the signal averaged over 3 consecutive pulses. It is worth noting that the acquired spectra were screened for further analysis by subjecting them to a minimum signal-to-noise ratio threshold and performing spectral outlier detection using correlation distance. In order to prevent the deleterious impact of spectral artifacts, chemometric analysis was performed without the application of any additional preprocessing methods.
Data Analysis
Variable selection by genetic algorithm. Wavelength selection for spectroscopy is typically tackled
through a priori knowledge about the composition of the target specimen. However, as alluded to earlier, complex sample matrix as well as the environment contribute substantive signals from interferents that overlap with the principal features of interest. In order to choose a globally optimal feature subset capable of offering maximal and robust discrimination between the considered HEMs, we employed GA. GAs have provided robust solutions across many applications, offer the possibility to converge on optimal solutions swifter than multidimensional raster grid searches, and possess the ability to escape local maxima during the search for an optimal global solution30,31. GAs are based on ideas developed in evolutionary biology, where different potential solutions are treated as competing individuals in an evolving population. They have been gainfully utilized for spectral feature selection, where the central idea is the manipulation of binary strings (chromosomes) that contain genes which in turn encode experimental factors or variables32,33. Here an initially random population of individuals, or “chromosomes,” was generated with certain characteristics. The optimized GA parameters were: population size, 64 chromosomes; window width, 10%; % initial terms, 1%; max number of generations, 100; percent at convergence, 50%; mutation rate 0.005; regression algorithm and # of LV, PLS and 10 LV’s; cross validation, random and three splits for multiple iterations. For our analysis, we selected spectral subsets in increments of 1% of the total population (25699 points at which intensity values were recorded) with a minimum of 1%. The optimal spectral subset for each increment was selected by maximizing the correct classification rate in a cross-validation routine in the training population.
PLS-DA multivariate analysis. Although it was originally developed as a multivariate regression method, PLS34 has been extensively used to solve classification problems by encoding the class membership of the measured samples in the target matrix35,36. An important feature of this supervised technique is that it is specifically suited to deal with problems in which the number of variables is large (compared to the number of observations) and collinear, two major challenges encountered when LIBS spectra are used. Furthermore, PLS-DA provides a powerful tool for discrimination even when the variability within a class is similar to the inter-class variability by virtue of establishing the maximal separation between each class via fitting one global model to the entire dataset. In PLS-DA, a PLS regression model is calculated that relates the independent variables (spectral data) to a binary response encoded as: {1, 0, 0, 0, 0} Scientific Reports | 5:13169 | DOI: 10.1038/srep13169
3
www.nature.com/scientificreports/
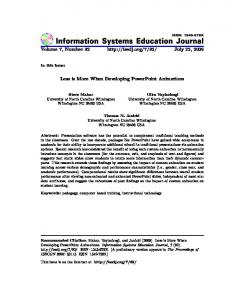
Figure 1. Representative LIBS spectra of high-energy material (HEM) samples: HMX, NTO, PETN, RDX and TNT. The spectra are normalized and offset for visualization purposes.
for sample belonging to class 1, {0, 1, 0, 0, 0} for sample belonging to class 2, and so on until class 5. Typically, a threshold value based on the Bayesian method37, is defined between 0 and 1, and calculated on the basis of the values predicted during the classification process, so an object is assigned to a particular class if its prediction is larger than the threshold value for this class. As in the PLS regression model, the optimal number of latent variables (LVs) retained are chosen before the modeling process and this is determined by using the fractional misclassification error rate in cross validation38.
Sensitivity Test. The sensitivity investigations were performed for the two approaches(region selection based on a priori compositional information and GA) by randomly splitting the 472 sample datasets into 282 for training, 95 for tuning and 95 for test, respectively. Wavelength selection was performed on the training set whereas the tuning set was used to determine the unclassification thresholds for the developed classification model. The test set was kept aside for final classification purposes. The size of the test set represents a compromise between opting for a test set size large enough to minimize the standard error in computing the misclassification rate, while maintaining the training and tuning set sizes large enough to construct and optimize a robust classifier. To obtain more representative rates of correct classification, misclassification and unclassification, 100 independent iterations were performed by re-splitting the entire data into training, tuning and test sets. In the following, we describe the procedure for application of each classifier for one iteration where the dataset has already been randomly split into training, tuning and test sets. Additionally, to determine the number of the LVs we employed a leave-one-out cross-validation procedure in the training set. Also, for predicting the class of a spectrum, we used equally weighted scaled orthogonal and score distances. Here, using the tuning set, we defined an unclassification criterion to prevent the misclassification of potential samples that are distant from the center of the PLS-DA model. Based on the assumption of normal distribution of the distances of the tuning dataset to the center of the PLS-DA model, distance thresholds were established (mean ± 3.5*standard deviation) to unclassify correspondingly distant test samples. In other words, if the membership probability for every class is observed to be