NASA/TM—2002-211692
Lessons Learned From CM-2 Modal Testing and Analysis Mark E. McNelis, Thomas W. Goodnight, and Kelly S. Carney Glenn Research Center, Cleveland, Ohio Kim D. Otten Analex Corporation, Brook Park, Ohio
June 2002
The NASA STI Program Office . . . in Profile Since its founding, NASA has been dedicated to the advancement of aeronautics and space science. The NASA Scientific and Technical Information (STI) Program Office plays a key part in helping NASA maintain this important role.
•
CONFERENCE PUBLICATION. Collected papers from scientific and technical conferences, symposia, seminars, or other meetings sponsored or cosponsored by NASA.
The NASA STI Program Office is operated by Langley Research Center, the Lead Center for NASA’s scientific and technical information. The NASA STI Program Office provides access to the NASA STI Database, the largest collection of aeronautical and space science STI in the world. The Program Office is also NASA’s institutional mechanism for disseminating the results of its research and development activities. These results are published by NASA in the NASA STI Report Series, which includes the following report types:
•
SPECIAL PUBLICATION. Scientific, technical, or historical information from NASA programs, projects, and missions, often concerned with subjects having substantial public interest.
•
TECHNICAL TRANSLATION. Englishlanguage translations of foreign scientific and technical material pertinent to NASA’s mission.
•
•
•
TECHNICAL PUBLICATION. Reports of completed research or a major significant phase of research that present the results of NASA programs and include extensive data or theoretical analysis. Includes compilations of significant scientific and technical data and information deemed to be of continuing reference value. NASA’s counterpart of peerreviewed formal professional papers but has less stringent limitations on manuscript length and extent of graphic presentations. TECHNICAL MEMORANDUM. Scientific and technical findings that are preliminary or of specialized interest, e.g., quick release reports, working papers, and bibliographies that contain minimal annotation. Does not contain extensive analysis. CONTRACTOR REPORT. Scientific and technical findings by NASA-sponsored contractors and grantees.
Specialized services that complement the STI Program Office’s diverse offerings include creating custom thesauri, building customized data bases, organizing and publishing research results . . . even providing videos. For more information about the NASA STI Program Office, see the following: •
Access the NASA STI Program Home Page at http://www.sti.nasa.gov
•
E-mail your question via the Internet to
[email protected]
•
Fax your question to the NASA Access Help Desk at 301–621–0134
•
Telephone the NASA Access Help Desk at 301–621–0390
•
Write to: NASA Access Help Desk NASA Center for AeroSpace Information 7121 Standard Drive Hanover, MD 21076
NASA/TM—2002-211692
Lessons Learned From CM-2 Modal Testing and Analysis Mark E. McNelis, Thomas W. Goodnight, and Kelly S. Carney Glenn Research Center, Cleveland, Ohio Kim D. Otten Analex Corporation, Brook Park, Ohio
Prepared for the Ninth International Congress on Sound and Vibration cosponsored by the NASA Kennedy Space Center, the International Institute of Acoustics and Vibration, and the University of Central Florida Orlando, Florida, July 8–11, 2002
National Aeronautics and Space Administration Glenn Research Center
June 2002
Available from NASA Center for Aerospace Information 7121 Standard Drive Hanover, MD 21076
National Technical Information Service 5285 Port Royal Road Springfield, VA 22100
Available electronically at http://gltrs.grc.nasa.gov/GLTRS
LESSONS LEARNED FROM CM-2 MODAL TESTING AND ANALYSIS Mark E. McNelis, Thomas W. Goodnight, and Kelly S. Carney National Aeronautics and Space Administration Glenn Research Center Cleveland, Ohio 44135, USA Kim D. Otten Analex Corporation Brook Park, Ohio 44142, USA
Abstract The Combustion Module-2 (CM-2) is a space experiment that launches on Shuttle mission STS107 in the SPACEHAB Double Research Module. The CM-2 flight hardware is installed into SPACEHAB single and double racks. The CM-2 flight hardware was vibration tested in the launch configuration to characterize the structure’s modal response. Cross-orthogonality between test and analysis mode shapes were used to assess model correlation. Lessons learned for pre-test planning and model verification are discussed.
INTRODUCTION The Combustion Module-2 (CM-2) is a combustion science experiment consisting of eight packages installed into SPACEHAB single and double racks. CM-2 is manifest for Shuttle mission STS-107 in the SPACEHAB Double Research Module. The CM-2 hardware is a reflight of CM-1 hardware, which was originally designed and environmentally qualified for Spacelab for Shuttle missions STS-83 (April 4, 1997) and STS-94 (July 1, 1997). Modal testing and model correlation analysis was conducted on the modified double rack flight hardware (center post removed) for the purpose of finite element model verification. Verified rack models are analytically installed into the SPACEHAB Double Research Module for an integrated Shuttle coupled loads analysis.
TEST AND ANALYSIS OBJECTIVES The objective of the CM-2 modal testing was to characterize the primary modes in each axis for the test configuration. The objective of the CM-2 model correlation was to establish correspondence between test and analysis primary mode shapes. The cross-orthogonality correlation goal is greater than 0.9 for diagonal terms, and less than 0.1 for off-diagonal terms of the matrix. The fundamental frequency correlation goal in each axis is ± 5 percent, and ± 10 percent for higher order frequencies.
NASA/TM2002-211692
1
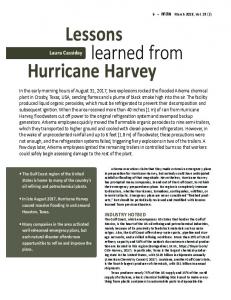
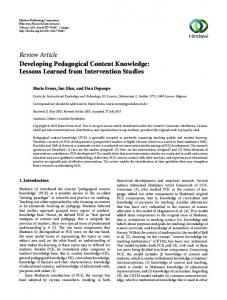
Base shake modal testing was implemented using a 35,000 pound force vertical electrodynamic shaker, and a 28,000 pound force horizontal electrodynamic shaker and 96 channels of digital data acquisition at the NASA Glenn Research Center’s Structural Dynamics Laboratory. This approach was innovative in that it combined environmental and modal testing (Reference 1). The test configuration incorporated a rigid fixture attached to the double rack, and supported by the shaker with a 72 inch expander head. The double rack test configuration is shown in Figure 1. The double rack has dimensions: 80 inches height, 41 inch width and 29 inch depth. The L-shaped fixture weighed 1,360 pounds and was constructed from 6 inch x 6 inch x ½ inch box beams. The empty fixture fundamental frequencies were 120 Hz (Z-axis), 142 Hz (Y-axis), and 158 Hz (X-axis). The test configured double rack weighed 2,480 pounds including the double rack, five packages and the test fixture. Four control accelerometers and five load cells (three-axis strain gauge type) located at the rack to fixture interface were used for test control and limit response (Figure 2). Rack test excitation included sinusoidal (excitation level: 1 /8, ¼, ½, g’s-peak, frequency range: 5-400 Hz) and random vibration (excitation level: ¼ flight excitation with an overall of 0.75 Grms, frequency range: 20-2,000 Hz). Sinusoidal testing was conducted at several low level excitations to assess linearity of the structure. The rack structure responded as a strain softening system. Test control was excellent with respect to the random vibration excitation. Frequency response functions (FRFs) were computed based on the H2 = Gyy/Gxy method (emphasizing resonant response) using a reference triaxial accelerometer mounted on the shaker table. Due to laboratory constraints (data acquisition and accelerometer availability), 82 response accelerometers were used for modal testing. Pre-test modal analysis was performed using a three-tiered approach to define accelerometer locations: 1) kinetic energy, 2) systematized Guyan reduction (Reference 2), and 3) engineering judgment. The criterion for selection of target modes is based on effective modal mass (> 10%). Pre-test target modes of the test configuration were 31.4 Hz (X-axis), 36.1 Hz (Y-axis), 52.1 Hz and 53.4 Hz (Z-axis). The two closely spaced Z-axis modes could not be differentiated due to spatial under sampling using the 82 channel response accelerometer set. The lesson learned from this is to perform modal assurance criterion and cross-orthogonality checks between the high fidelity finite element model (197,994 degrees of freedom) and the reduced fidelity finite element model (82 translation degrees of freedom) for the primary modes. Spatial under sampling could have been avoided by having additional accelerometer locations to better characterize the mode shape.
TEST AND ANALYSIS RESULTS Testing was conducted from October 20–25, 1999 at the NASA Glenn Research Center Structural Dynamics Laboratory. The primary test modes measured were at 24.3 Hz (X-axis), 28.7 Hz (Y-axis), 35.9 Hz and 41.2 Hz (Z-axis). High quality frequency response functions were obtained from testing. Modal parameter estimation was computed using the polyreference curve fitting technique. There was test configuration interaction between the rack, fixture, shaker, head
NASA/TM2002-211692
2
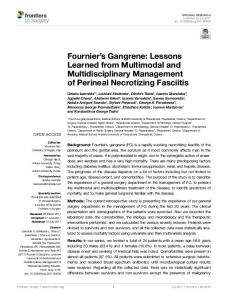
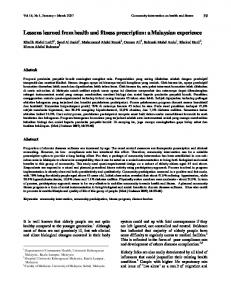
expander and armature observed at 150 Hz, 269 Hz and 400 Hz. These interactions did not compromise the modal test as the frequency range of interest was from 0–75 Hz. Post-test model correlation was performed to improve the finite element model prediction of the rack test mode shapes. Model improvements included correlating the empty fixture by modifying the stiffness property of the fixture beam sections (modifying Young’s Modulus). The next step in the correlation process was to analytically install the double rack with the correlated fixture. Correlation of the analytical model with the primary test modes was accomplished by adding translation springs at the rack to fixture interface. These springs represented the stiffness provided by the interface load cells. A total of 45 iterations were performed to correlate the model. Some model updating was performed to better constrain a front panel package connection. A comparison of the correlated model and test configuration frequency, modal assurance criteria, and cross-orthogonality is summarized in Table 1. Satisfactory correlation was obtained between analysis and test frequencies, with a maximum difference of 4.2% occurring for the primary Z-axis mode. Spatial under sampling of the two Z-axis modes is evident based on the low values for the modal assurance criterion and cross-orthogonality calculations. Figure 3 illustrates the front view of the full (197,774 DOF) finite element model. A comparison of analysis and test based mode shapes are shown in Figures 4, 5, and 6. Figures 4 and 5 illustrate the primary bending mode shape in the X and Y-axes respectively. Figure 6 illustrates the primary (combined Y-axis torsion and Z-axis bending mode) and secondary Z-axis mode shapes. The modal assurance criterion and cross-orthogonality are computed based on Reference 3. Modal Assurance Criterion (MAC) values range from 0 (no correlation between shapes) to 1 (full correlation). MACij = ((φtT)i (φa)j)2 / (φtTφt)i (φaTφa)j Cross-Orthogonality is a mass weighted orthogonality. Acceptable cross-orthogonality values are 0.9 or greater on the diagonal terms of the matrix. ORTHOij = (φtT)i Maa (φa)j Where:
φa represents the analytical mode shape partitioned to the test degrees of freedom φt represents the test mode shapes Maa represents the analytical mass matrix portioned to the test degrees of freedom
Tables 2 and 3 illustrates the MAC and mass weighted orthogonality comparison for the high fidelity model (197,994 degrees of freedom) and the reduced model (test degrees of freedom). The high fidelity model is partitioned to the test locations (82 degrees of freedom). The high cross-coupling orthogonality for the Z-axis modes (off-diagonal orthogonality value of 0.21) indicates it is difficult to discern the difference between the two mode shapes.
NASA/TM2002-211692
3
Tables 4 and 5 illustrates the MAC and cross-orthogonality comparison between analysis and test. The analysis results are based on the high fidelity analysis model partitioned to the test degrees of freedom (reduced model). Based on a comparison of these tables, it is evident that the cross-orthogonality yield a higher value than the MAC for the primary modes. Since the MAC is normalized to the highest amplitude response, the effect of a large amplitude local response can mask the global response. Because the cross-orthogonality calculation is mass weighted, it eliminates the effects of local modal response. This highlights the importance of using crossorthogonality criteria for model correlation.
CONCLUSIONS The CM-2 Double Rack combined environmental and modal testing was an economical way to facilitate verification testing in the NASA Structural Dynamic’s Laboratory. The base shake modal testing approach was taken due to low project funding, and is not a traditional modal test. Lessons learned from the model correlation effort include: a. The importance of characterizing the degree of nonlinearity of the structure by performing sinusoidal sweep testing at several excitation levels. Based on the degree of nonlinearity, the level of difficulty for model correlation can be established. b. In order to best characterize the primary test mode shapes and avoid spatial under sampling, it is essential to compute cross-orthogonality between the high fidelity finite element model and the reduced analysis model (test degrees of freedom), prior to testing. c. Computation of cross-orthogonality between test and analysis is a more important criterion for evaluating model correlation than the modal assurance criterion. The crossorthogonality check reduces the effects of local modal response by weighting the results with the mass matrix.
REFERENCES 1. “CM-2 Environmental/Modal Testing of SPACEHAB Racks,” by Mark E. McNelis and Thomas W. Goodnight, NASA Glenn Research Center, Michael A. Farkas, The Boeing Company, proceedings from the 7th International Congress on Sound and Vibration, July 4–7, 2000, Garmisch-Partenkirchen, Germany. 2. “Cassini Spacecraft Modal Survey Test Report,” by Ken S. Smith and Chia-Yen Peng, JPL Document D-13300, January 22, 1996, California Institute of Technology, Pasadena, California, USA. 3. “Cross-Orthogonality Calculations for Pre-Test Planning and Model Verification,” by Ken Blakely and Ted Rose, proceedings of the 1993 MSC World User’s Conference, The MacNeal Schwendler Corporation, Los Angeles, California, USA.
NASA/TM2002-211692
4
FIGURE 1. CM-2 Double Rack Test Configuration
Fixture
Experiment Package
Y
Expander Head Vertical Shaker X
Z
FIGURE 2. Rack to Fixture Interface Instrumentation
NASA/TM2002-211692
5
TABLE 1. Comparison of Correlated Model and Test Results Mode 2 3 8 10
Effective Mass 43.5% 47.4% 41.8% 2.1%
Axis X Y Z Z
Analysis 25.3 Hz 28.1 Hz 37.4 Hz 41.3 Hz
Test 24.3 Hz 28.7 Hz 35.9 Hz 41.2 Hz
Difference 4.1% 2.1% 4.2% 0.2%
MAC 0.95 0.78 0.42 0.34
ORTHO 0.97 0.95 0.67 0.09
TABLE 2. High Fidelity Analysis versus Reduced Analysis Model Modal Assurance Criterion Modal Assurance Criterion Primary X- 25.3 Hz Primary Y- 28.1 Hz Primary Z- 37.4 Hz Secondary Z- 41.3 Hz
Primary X 25.3 Hz 1.00 0.08 3.3E-02 1.5E-02
Primary Y 28.1 Hz 0.08 1.00 0.16 5.1E-02
Primary Z Secondary Z 37.4 Hz 41.3 Hz 3.3E-02 1.5E-02 0.16 5.1E-02 1.00 0.25 0.25 1.00
TABLE 3. High Fidelity Analysis versus Reduced Analysis Model Mass Weighted Orthogonality Mass Weighted Orthogonality Primary X- 25.3 Hz Primary Y- 28.1 Hz Primary Z- 37.4 Hz Secondary Z- 41.3 Hz
Primary X 25.3 Hz 0.97 8.8E-04 8.8E-03 3.4E-03
Primary Y 28.1 Hz 8.8E-04 0.96 0.02 5.0E-03
Primary Z Secondary Z 37.4 Hz 41.3 Hz 8.8E-03 3.4E-03 0.02 5.0E-03 0.83 0.21 0.21 0.13
TABLE 4. Reduced Analysis Model versus Test Modal Assurance Criterion Modal Assurance Criterion Primary X- 25.3 Hz Primary Y- 28.1 Hz Primary Z- 37.4 Hz Secondary Z- 41.3 Hz
Primary X 24.3 Hz 0.95 2.3E-05 6.8E-05 1.1E-03
Primary Y 28.7 Hz 4.0E-03 0.78 0.01 1.8E-03
Primary Z Secondary Z 35.9 Hz 41.2 Hz 2.8E-03 1.2E-04 0.01 4.2E-03 0.42 0.21 0.14 0.34
TABLE 5. Reduced Analysis Model versus Test Cross-Orthogonality Cross-Orthogonality Primary X- 25.3 Hz Primary Y- 28.1 Hz Primary Z- 37.4 Hz Secondary Z- 41.3 Hz
NASA/TM2002-211692
Primary X 24.3 Hz 0.97 0.09 0.02 9.0E-04
6
Primary Y 28.7 Hz 0.03 0.95 0.02 0.02
Primary Z Secondary Z 35.9 Hz 41.2 Hz 0.10 0.03 0.37 0.11 0.67 0.05 0.16 0.09
FIGURE 3. Rack Finite Element Model Front View (197,994 DOF)
FIGURE 4. Primary X-Axis Mode Shapes Undeformed Model (82 DOF)
NASA/TM2002-211692
Reduced Model (82 DOF) Mode 2, Freq = 25.4 Hz Effective Weight = 59.5%
7
Test (82 DOF) Freq = 24.3 Hz Damping = 2.03%
FIGURE 5. Primary Y-Axis Mode Shapes Undeformed Model (82 DOF)
Reduced Model (82 DOF) Mode 3, Freq = 28.4 Hz Effective Weight = 87.7%
Test (82 DOF) Freq = 28.7 Hz Damping = 3.48%
FIGURE 6. Primary and Secondary Z-Axis Mode Shapes Undeformed Model (82 DOF)
NASA/TM2002-211692
Test (82 DOF) Freq = 35.9 Hz Damping = 1.68%
8
Test (82 DOF) Freq = 41.2 Hz Damping = 1.66%
Form Approved OMB No. 0704-0188
REPORT DOCUMENTATION PAGE
Public reporting burden for this collection of information is estimated to average 1 hour per response, including the time for reviewing instructions, searching existing data sources, gathering and maintaining the data needed, and completing and reviewing the collection of information. Send comments regarding this burden estimate or any other aspect of this collection of information, including suggestions for reducing this burden, to Washington Headquarters Services, Directorate for Information Operations and Reports, 1215 Jefferson Davis Highway, Suite 1204, Arlington, VA 22202-4302, and to the Office of Management and Budget, Paperwork Reduction Project (0704-0188), Washington, DC 20503.
1. AGENCY USE ONLY (Leave blank)
2. REPORT DATE
3. REPORT TYPE AND DATES COVERED
Technical Memorandum
June 2002 4. TITLE AND SUBTITLE
5. FUNDING NUMBERS
Lessons Learned From CM-2 Modal Testing and Analysis WU–400–31–3A–00
6. AUTHOR(S)
Mark E. McNelis, Thomas W. Goodnight, Kelly S. Carney, and Kim D. Otten 7. PERFORMING ORGANIZATION NAME(S) AND ADDRESS(ES)
8. PERFORMING ORGANIZATION REPORT NUMBER
National Aeronautics and Space Administration John H. Glenn Research Center at Lewis Field Cleveland, Ohio 44135 – 3191
E–13422
9. SPONSORING/MONITORING AGENCY NAME(S) AND ADDRESS(ES)
10. SPONSORING/MONITORING AGENCY REPORT NUMBER
National Aeronautics and Space Administration Washington, DC 20546– 0001
NASA TM—2002-211692
11. SUPPLEMENTARY NOTES
Prepared for the Ninth International Congress on Sound and Vibration cosponsored by the NASA Kennedy Space Center, the International Institute of Acoustics and Vibration, and the University of Central Florida, Orlando, Florida, July 8–11, 2002. Mark E. McNelis, Thomas W. Goodnight, and Kelly S. Carney, NASA Glenn Research Center; Kim D. Otten, Analex Corporation, Brook Park, Ohio 44142. Responsible person, Mark E. McNelis, organization code 7735, 216–433–8395. 12a. DISTRIBUTION/AVAILABILITY STATEMENT
Unclassified - Unlimited Subject Category: 18
12b. DISTRIBUTION CODE
Distribution: Nonstandard
Available electronically at http://gltrs.grc.nasa.gov/GLTRS This publication is available from the NASA Center for AeroSpace Information, 301–621–0390. 13. ABSTRACT (Maximum 200 words)
The Combustion Module-2 (CM-2) is a space experiment that launches on Shuttle mission STS-107 in the SPACEHAB Double Research Module. The CM-2 flight hardware is installed into SPACEHAB single and double racks. The CM-2 flight hardware was vibration tested in the launch configuration to characterize the structure’s modal response. Crossorthogonality between test and analysis mode shapes were used to assess model correlation. Lessons learned for pre-test planning and model verification are discussed.
14. SUBJECT TERMS
15. NUMBER OF PAGES
14
Modal response; Random vibration; Shakers 17. SECURITY CLASSIFICATION OF REPORT
Unclassified NSN 7540-01-280-5500
18. SECURITY CLASSIFICATION OF THIS PAGE
Unclassified
16. PRICE CODE 19. SECURITY CLASSIFICATION OF ABSTRACT
20. LIMITATION OF ABSTRACT
Unclassified Standard Form 298 (Rev. 2-89) Prescribed by ANSI Std. Z39-18 298-102